-
Rising adoption of precision agriculture is driving demand for farm management software, with over 55% of large farms using digital tools to optimize inputs and improve yields.
-
Increasing integration of IoT, sensors, and drones is enabling real-time farm monitoring, with connected agriculture devices growing at a CAGR of over 12% globally.
-
Growing focus on data-driven decision-making is improving farm productivity, with software adoption helping increase crop yields by 15–20% on average.
-
Expansion of cloud-based platforms and mobile apps is accelerating adoption, with over 60% of new deployments being cloud-enabled for remote farm management.
-
Government support and subsidies for smart farming technologies are boosting adoption, particularly in emerging markets, contributing to over 25% growth in digital agriculture investments.
Farm Management Software Market Report Scope & Overview:
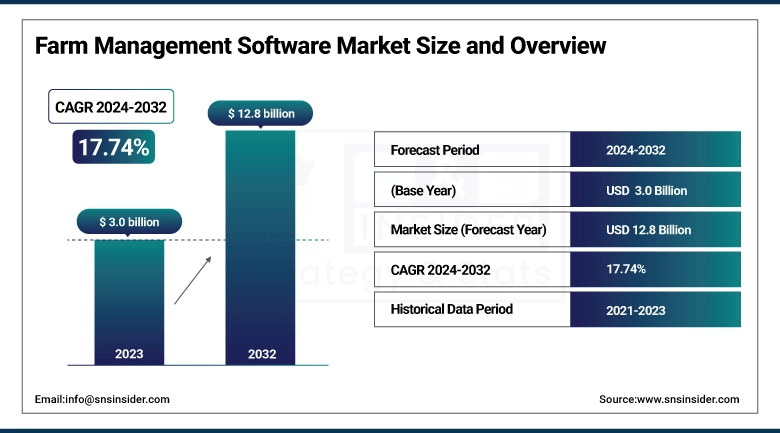
The Farm Management Software Market was valued at USD 3.0 billion in 2023 and is expected to reach USD 12.8 billion by 2032, growing at a CAGR of 17.74% from 2024-2032.
The statistical insights for the Farm Management Software Market reflect evolving digital adoption trends in agriculture. In 2023, there was a notable rise in the adoption of precision tools, such as crop monitoring systems and automated irrigation, driven by the need for data-driven decision-making. Usage trends indicated increasing engagement from mid-sized farms and a shift towards younger, tech-savvy farmers, signaling a generational transformation in farming practices. Integration capabilities across platforms improved significantly, with seamless connectivity to IoT devices, drones, and ERP systems streamlining operations. These technologies collectively contributed to enhanced operational efficiency, enabling better yield forecasting, input cost optimization, and labor savings. Additionally, the report highlights the emergence of AI-powered analytics, increased use of mobile-first farm management platforms, and a growing emphasis on climate-smart agriculture and sustainability-focused tools.
Farm Management Software Market Size and Forecast
-
Market Size in 2023: USD 3.0 Billion
-
Market Size by 2032: USD 12.8 Billion
-
CAGR: 17.74% from 2024 to 2032
-
Base Year: 2023
-
Forecast Period: 2024–2032
-
Historical Data: 2020–2023
To Get more information on Farm Management Software Market - Request Free Sample Report
Farm Management Software Market Trends
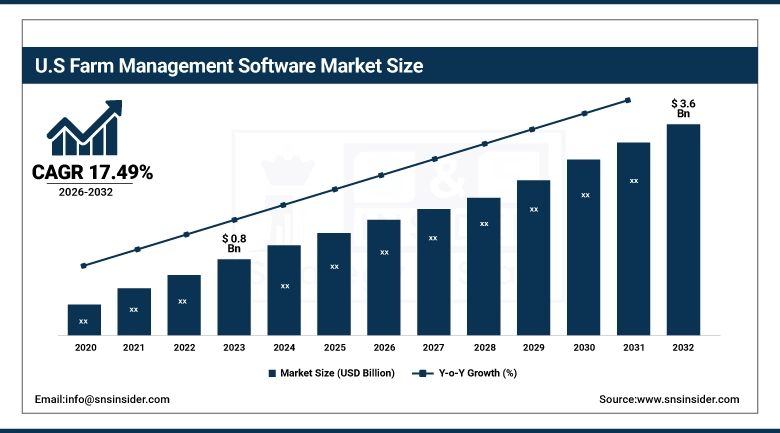
The U.S. Farm Management Software Market was valued at USD 0.8 billion in 2023 and is expected to reach USD 3.6 billion by 2032, growing at a CAGR of 17.49% from 2024-2032. driven by the increasing adoption of precision agriculture techniques and the integration of advanced technologies like IoT and AI, which enhance operational efficiency and productivity. This trend is further supported by government initiatives promoting sustainable farming practices.
Market Dynamics
Driver
-
Increasing use of data-driven tools is boosting demand for farm management software.
The adoption of precision agriculture is changing the way farmers approach their work, using data to make better decisions, increase yields, and use inputs more efficiently. At the point of the agriculture business, farm management software is largely responsible for gathering, processing, and applying data from an assortment of assets , including sensors, drones, and satellite imagery. With increasing demands on farmers to maximize productivity with minimal environmental impact, software solutions that provide real-time insights and automation are quickly becoming a necessity for the industry. Government incentives and increasing awareness are propelling this adoption in the U.S. and other developed markets, with farm management software becoming a key tool in the farmer's toolkit.
Restraint
-
High setup costs and low digital literacy hinder adoption, especially among small farmers.
Despite its benefits, the high initial cost of farm management software and the infrastructure needed for full functionality—such as hardware integration, connectivity, and training—pose a significant barrier, especially for small-scale farmers. Additionally, a lack of digital literacy among some farmer demographics limits the software’s full utilization. These factors can delay return on investment and discourage adoption in regions with lower access to capital or limited broadband infrastructure. Vendors must offer scalable and user-friendly solutions to overcome these barriers and expand their customer base.
Opportunity
-
Emerging technologies are enabling smarter, more efficient farm operations through software.
Technological innovations such as artificial intelligence, the Internet of Things, and big data analytics offer immense growth opportunities for the farm management software market. These technologies allow for predictive analytics, smart irrigation, automated machinery, and weather forecasting—drastically improving decision-making and operational efficiency. As farms become increasingly digitized, software platforms that offer real-time, actionable insights and integrate seamlessly with existing tools will be in high demand. This creates fertile ground for software developers and agri-tech startups to innovate and scale intelligent solutions tailored to evolving farmer needs.
Challenge
-
Farmers remain cautious due to unclear data usage policies and ownership rights.
As farm management software collects and stores sensitive farm data, concerns about data privacy, misuse, and ownership are growing among farmers. Many users are uncertain about who has access to their data, how it's being used, and the risks of potential breaches or exploitation by third parties. This lack of transparency can create mistrust, slowing adoption rates. Addressing this challenge will require clear policies, secure platforms, and industry-wide data governance standards that ensure farmers retain control over their information while benefiting from advanced analytics and connectivity.
Segmentation Analysis
By Agriculture Type
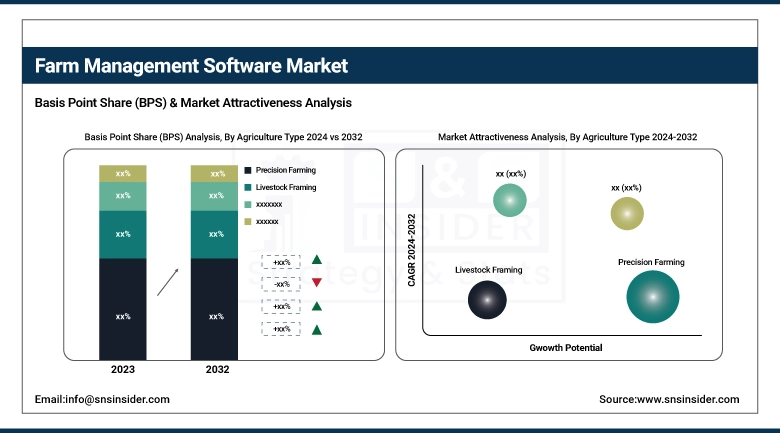
In 2023, the precision farming segment dominated the market and accounted for a significant revenue share. The precision farming market is expanding as a result of the increasing trend of data-driven farming. Big data is not something new; as there is an increasing amount of big data available, farmers can base their decision-making on a thorough data analysis instead of living in old ways of farming. This includes leveraging weather information, soil conditions, and crop health monitor reports obtained via sensors and remote sensing technologies.
The smart greenhouse segment is expected to grow at the fastest CAGR during the forecast period. This is leading to the increased use of smart greenhouses as demand for fresh, locally grown produce rises. As more consumers seek out fresh, high-quality produce grown without hazardous chemicals, there is a rising demand for sustainable and organic farming.
By Component
In 2023, the software segment dominated the farm management software market, with a revenue share of over 65%. The incorporation of IoT and cloud-based solutions transformed the FMS by providing real-time monitoring, remote access, and automated data processing. FMS bolsters productivity by analyzing field data collected by IoT-enabled sensors, including soil moisture, temperature, nutrient levels, and more, generating actionable insights. Let us take the example of a farmer; his data can be accessed from anywhere in the world, simplifying the data which can be shared with other stakeholders in the agricultural supply chain.
The services segment is projected to witness the fastest CAGR during the forecast period. Growth in this segment is driven by the rise of FMS models that are subscription-based and based on the cloud. Many FMS providers also provide solutions, like Software-as-a-Service, that will need ongoing support, updates, and maintenance. Farmers who subscribe to such services usually turn to the customer support teams for troubleshooting, software updates, and cybersecurity measures to secure their farm data.
By Deployment
In 2023, the web-based segment dominated the market and accounted for 52% of the revenue share. This is one of the significant factors in the growth of the web-based FMS market with the growing focus on data security and cloud computing. Many farmers have begun to trust cloud technology since data encryption technology and cybersecurity protocols protect sensitive farm data. As the confidence in cloud services grows, farmers are increasingly ready to implement the associated solutions to help optimize their operations without sacrificing any type of data security.
The cloud-based segment is expected to be the fastest-growing segment. The growing adoption of precision agriculture technologies is excretory the growth of cloud-based FMS. Data processing is a critical part of precision farming as farming is a data-driven industry that enables immediate decisions on crops and resources. The cloud-based FMS promotes precision agriculture, where this type of system is able to integrate seamlessly with GPS technology, remote sensing devices, drones, and other IoT tools to gather data about soil health, crop growth, and environmental conditions.
Regional Analysis
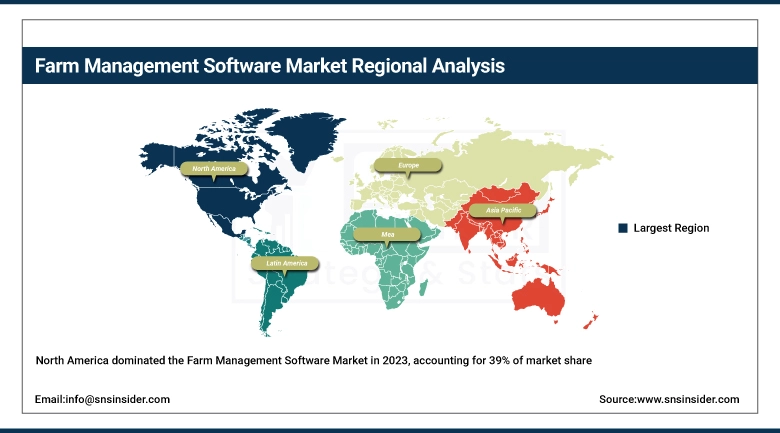
In 2023, North America dominated the market and accounted for 39% of the revenue share. Farm consolidation and the growth of agribusiness in North America are creating demand for more sophisticated and holistic farm management software. These farms are becoming bigger and more complicated, requiring better and sharper software to handle everything from field production through financial modeling. Agribusinesses can leverage FMS platforms, which allow them to control operations, inventory management, labor oversight, and financial management all from a single system.
Get Customized Report as per Your Business Requirement - Enquiry Now
Asia Pacific is expected to register the fastest CAGR during the forecast period in the farm management software market. The market growth in the region is driven by the increasing concern for environmental sustainability and the effect of climate change on agriculture. As extreme weather events, including droughts, floods, and storms, continue to increase in frequency and severity, farmers have no choice but to explore methods for adapting to shifting climatic conditions.
Key players
-
Trimble Inc. – Trimble Ag Software
-
Deere & Company – John Deere Operations Center
-
Raven Industries, Inc. – Slingshot
-
AG Leader Technology – AgFiniti
-
Climate LLC (Bayer AG) – Climate FieldView
-
Topcon Positioning Systems, Inc. – TAP (Topcon Agriculture Platform)
-
AgJunction Inc. – AutoFarm
-
Iteris, Inc. – ClearAg
-
Agworld Pty Ltd – Agworld Platform
-
Granular, Inc. – Granular Business
-
Conservis Corporation – Conservis Platform
-
CropIn Technology Solutions – SmartFarm
-
Trimble Agriculture – Farmer Pro
-
FarmLogs (Bushel) – FarmLogs
-
Resson Aerospace Corporation – Resson Agricultural Management Platform
Recent Developments
-
July 2024: Syngenta launched Cropwise, a digital farming platform designed to integrate advanced digital solutions for comprehensive farm management, aiming to optimize productivity and sustainability.
-
December 2024: Conservis was acquired by Traction Ag, Inc., marking a consolidation in the farm management software sector to enhance service offerings and technological capabilities.
| Report Attributes | Details |
|---|---|
| Market Size in 2023 | US$ 3.0 Billion |
| Market Size by 2032 | US$ 12.8 Billion |
| CAGR | CAGR of 17.74 % From 2024 to 2032 |
| Base Year | 2023 |
| Forecast Period | 2024-2032 |
| Historical Data | 2020-2022 |
| Report Scope & Coverage | Market Size, Segments Analysis, Competitive Landscape, Regional Analysis, DROC & SWOT Analysis, Forecast Outlook |
| Key Segments | • By Component (Software, Services) • By Agriculture Type (Precision Farming, Livestock Monitoring, Smart Greenhouse, Others) • By Deployment (Web-based, Cloud-based) |
| Regional Analysis/Coverage | North America (US, Canada, Mexico), Europe (Eastern Europe [Poland, Romania, Hungary, Turkey, Rest of Eastern Europe] Western Europe] Germany, France, UK, Italy, Spain, Netherlands, Switzerland, Austria, Rest of Western Europe]), Asia Pacific (China, India, Japan, South Korea, Vietnam, Singapore, Australia, Rest of Asia Pacific), Middle East & Africa (Middle East [UAE, Egypt, Saudi Arabia, Qatar, Rest of Middle East], Africa [Nigeria, South Africa, Rest of Africa], Latin America (Brazil, Argentina, Colombia, Rest of Latin America) |
| Company Profiles | Trimble Inc., Deere & Company, Raven Industries Inc., AG Leader Technology, Climate LLC (Bayer AG), Topcon Positioning Systems Inc., AgJunction Inc., Iteris Inc., Agworld Pty Ltd, Granular Inc., Conservis Corporation, CropIn Technology Solutions, Trimble Agriculture, FarmLogs (Bushel), Resson Aerospace Corporation |
Frequently Asked Questions
Ans- Farmers remain cautious due to unclear data usage policies and ownership rights.
Ans- The Increasing use of data-driven tools is boosting demand for farm management software.
Ans- Asia-Pacific is expected to register the fastest CAGR during the forecast period.
Ans- The CAGR of the Farm Management Software Market during the forecast period is 17.74% from 2024-2032.
Ans - The Farm Management Software Market was valued at USD 3.0 billion in 2023 and is expected to reach USD 12.8 billion by 2032.
Get in Touch
