Traffic Sensor Market Size:

Get more information on Traffic Sensor Market - Request Sample Report
The Traffic Sensor Market size was valued at USD 627.4 million in 2023 and is expected to grow at a CAGR of 8.5 % from 2024 to 2032, and is projected to reach US$ 1307.4 million by 2032.
The growing need for real-time information systems to manage traffic flow efficiently is a significant driver of the traffic sensor market's expansion. Governments worldwide are actively implementing initiatives to modernize their transportation infrastructure, further fueling market growth. Additionally, the rising popularity of cycling as a mode of transportation is prompting the incorporation of a greater number of bicycles counting coupled with rapid urbanization, creates a pressing need for efficient traffic management systems. Traffic sensors provide real-time data on traffic flow, congestion levels, and vehicle characteristics, allowing authorities to optimize traffic signals, implement congestion pricing, and improve overall traffic flow.
Traffic Sensor Market Dynamics:
KEY DRIVERS:
-
Growing Traffic Congestion and Urbanization
-
Increasing Focus on Road Safety (Road traffic deaths account for 1.3 million fatalities globally each year - World Health Organization):
Example: The European Union mandates the use of traffic sensors for advanced driver-assistance systems (ADAS) in new vehicles by 2022. This regulation is expected to drive demand for traffic sensors in the automotive industry.
RESTRAINTS:
-
High Initial Investment Costs
Deploying traffic sensor systems requires upfront costs for equipment, installation, and integration. The average cost of installing a loop detector traffic sensor can range from $5,000 to $10,000 per lane which can be a barrier. So, this the high initial investment can deter smaller towns and municipalities with budget constraints from adopting traffic sensor technology.
OPPORTUNITIES:
-
Developments in sensor technology like LiDAR, loT and AI-powered video analytics offer more robust and detailed traffic data collection.
-
Integration with Cloud Computing and Big Data
Combining traffic sensor data with cloud computing and big data analytics allows for real-time traffic management and predictive maintenance.
Example: IBM is working with cities to develop cloud-based traffic management platforms that utilize traffic sensor data to optimize traffic flow.
CHALLENGES:
-
Limited or outdated infrastructure in some regions can pose challenges for deploying and maintaining traffic sensor systems.
-
Standardization and Interoperability Issues
The lack of standardized communication protocols can create compatibility issues between different traffic sensor systems from various vendors.
Example: Different cities might use incompatible traffic sensor systems, hindering data sharing and regional traffic management strategies.
IMPACT OF RUSSIA-UKRAINE WAR
The Russia-Ukraine war has had a complex impact on the traffic sensor market. While the conflict itself doesn't directly create demand for traffic sensors, there are both negative and positive repercussions. On the one hand, disrupted supply chains and sanctions on Russia, a major manufacturer of some sensor materials, can lead to shortages and price hikes. This could potentially slow down existing traffic management projects that rely on these sensors. On the other hand, the war might indirectly boost the market in certain regions. Increased focus on national security and border control measures could lead to higher investments in traffic monitoring systems in neighbouring European countries. like automotive radar which uses similar components as traffic sensors, suggest a disruption to the global economic recovery, potentially affecting overall market growth
IMPACT OF ECONOMIC SLOWDOWN
Reduced economic activity often leads to less traffic congestion. This can lead to a decrease in government spending on infrastructure projects, including those related to intelligent transportation systems (ITS) that utilize traffic sensor data. This could decrease demand for new sensor deployments. However, economic slowdown can also present opportunities. Cities might look to optimize existing traffic management systems to improve efficiency and reduce costs. Traffic sensors play a crucial role in achieving this by providing valuable data for traffic signal optimization and congestion mitigation. Additionally, with tighter budgets, authorities might prioritize cost-effective solutions, potentially favouring some traffic sensor technologies over others.
Traffic Sensor Market Segment Overview:
By Sensor Type
Based on Sensor Type, the market is segmented into Bending Plate Sensors, Piezoelectric Sensors, Inductive Loop Sensors, Acoustic Sensors, Image Sensors, Lidar Sensors, Magnetic Sensors, Infrared Sensors, Radar Sensors, and Thermal Sensors. The image sensor is expected to target the largest market share of traffic sensors in 2030. With the image sensor images are viewed on cameras located near or on the street. In addition, images seen from the vehicle's camera can be used to detect the vehicle behind it, measure the distance to the next vehicle, detection, and route detection. This traffic image sensor can be built into the traffic signal controller because of its compact size. Image sensor provides high sensitivity even in poor light conditions and, these image sensors has the ability to process at high speeds which provides better daytime imaging performance.
By Technology
Based on Technology, the market is segmented into RFID, GSM, 2D Sensor, 3D Sensor, and Others. In addition to the many technological benefits of 3D sensor technology for traffic quality monitoring applications, many traffic control authorities continue to rely solely on 2D sensors for quality control processes. Although useful for a limited number of situations, the 2D sensor is limited in its ability to achieve 100% quality control, which is considered a major concern, especially when there is congestion in many urban vehicles, where quality control is close to 100%. great popularity as a result of these factors, the 2D sensor will continue to dominate the market for traffic sensors.
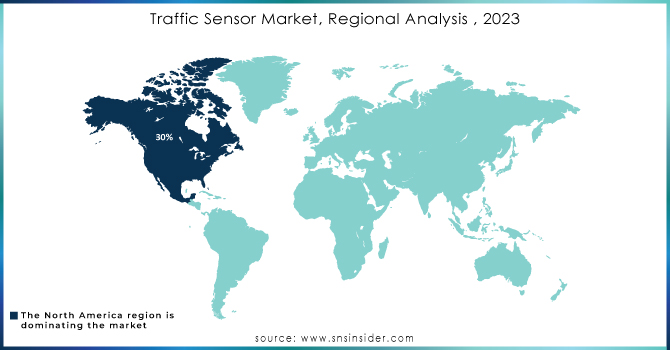
Traffic Sensor Market Regional Analysis:
North America currently holds a leading position with around 30 % market share in the traffic sensor market. North American countries have a history of early adoption of new technologies, including traffic sensor systems. This established infrastructure creates a strong foundation for further market growth. Also, Traffic congestion is a major concern in many North American cities. Governments and municipalities are actively investing in traffic management solutions, including traffic sensor technology. North America has stringent road safety regulations that mandate the use of traffic sensors in certain situations. This regulatory push further fuels market growth.
The Asia Pacific region is expected to experience the fastest growth in the traffic sensor market. The rapid pace of urbanization in countries like China and India is creating a surge in traffic volume, making traffic management a top priority. also, Many Asian governments are investing heavily in smart city initiatives, which often include traffic sensor technology as a key component. in addition, Traffic sensor technology is becoming more cost-effective, making it an attractive solution for developing economies in Asia Pacific. on the other hand, the Asia Pacific region is expected to experience the fastest growth in the traffic sensor market. The rapid pace of urbanization in countries like China and India is creating a surge in traffic volume, making traffic management a top priority. also, Many Asian governments are investing heavily in smart city initiatives, which often include traffic sensor technology as a key component. in addition, Traffic sensor technology is becoming more cost-effective, making it an attractive solution for developing economies in Asia Pacific. on the other hand, the lack of well-developed infrastructure in some parts of Asia Pacific can pose challenges for implementing and maintaining traffic sensor systems. the lack of well-developed infrastructure in some parts of Asia Pacific can pose challenges for implementing and maintaining traffic sensor systems.
Get Customized Report as per your Business Requirement - Request For Customized Report
KEY PLAYERS:
The major key players are Axis Communication, International Road Dynamics, TE Connectivity, Sick, Q-Free ASA, EFKON, FLIR Systems, SWARCO, TransCore, Raytheon Company, Kistler Group, Kapsch Traffic, Sensys Networks, Siemens, LeddarTech, Raytheon, Siemens and others players.
RECENT DEVELOPMENT
In March 07, 2024, The Department of Transportation (DOT) announced a pilot program to test next-generation traffic sensor technology on select highways. This program aims to evaluate the effectiveness of new sensors in improving traffic flow and reducing accidents.
In April 12, 2024, Siemens announced a collaboration to develop and integrate advanced traffic sensor technology into smart city infrastructure projects. This collaboration aims to improve traffic management, pedestrian safety, and overall urban mobility.
| Report Attributes | Details |
|---|---|
| Market Size in 2023 | US$ 624.7 Million |
| Market Size by 2032 | US$ 1307.4 Million |
| CAGR | CAGR of 8.5% From 2024 to 2032 |
| Base Year | 2023 |
| Forecast Period | 2024-2032 |
| Historical Data | 2020-2022 |
| Report Scope & Coverage | Market Size, Segments Analysis, Competitive Landscape, Regional Analysis, DROC & SWOT Analysis, Forecast Outlook |
| Key Segments | • By Sensor Type (Bending Plate Sensors, Piezoelectric Sensors, Inductive Loop Sensors, Acoustic Sensors, Image Sensors, Lidar Sensors, Magnetic Sensors, Infrared Sensors, Radar Sensors, Thermal Sensors) • By Technology (RFID, GSM, 2D Sensor, 3D Sensor, Others) • By Application (Vehicle Measurement And Profiling, Traffic Monitoring, Weigh In Motion, Automated Tolling (E-Toll)) |
| Regional Analysis/Coverage | North America (US, Canada, Mexico), Europe (Eastern Europe [Poland, Romania, Hungary, Turkey, Rest of Eastern Europe] Western Europe] Germany, France, UK, Italy, Spain, Netherlands, Switzerland, Austria, Rest of Western Europe]), Asia Pacific (China, India, Japan, South Korea, Vietnam, Singapore, Australia, Rest of Asia Pacific), Middle East & Africa (Middle East [UAE, Egypt, Saudi Arabia, Qatar, Rest of Middle East], Africa [Nigeria, South Africa, Rest of Africa], Latin America (Brazil, Argentina, Colombia, Rest of Latin America) |
| Company Profiles | Axis Communication, International Road Dynamics, TE Connectivity, Sick, Q-Free ASA, EFKON, FLIR Systems, SWARCO, TransCore, Raytheon Company, Kistler Group, Kapsch Traffic, Sensys Networks, Siemens, LeddarTech, Raytheon, Siemens and Oher companies. |
| Key Drivers | • Urgent need to deploy real-time information systems in transportation infrastructure. • With rapid urbanisation and a growing population, there is a greater emphasis on promoting road safety awareness. |
| Restraints | • Pavement deterioration and traffic disruptions occur during the installation and maintenance of traffic sensors. • Non-intrusive sensors have a high installation cost and are required. |
Frequently Asked Questions
Manufacturers, Consultants, Association, Research Institutes, private and university libraries, suppliers, and distributors of the product.
Top-down research, bottom-up research, qualitative research, quantitative research, and Fundamental research.
The COVID-19 had a negative impact on the market for traffic sensors market. It is expected that, after the Covid19 situation, the global Traffic Sensor Industry will grow significantly.
The market has been segmented with respect to type, technology and application.
The market size will be valued at USD 1205 million by 2031.
Get in Touch
