Electronic Toll Collection Market Size Analysis:
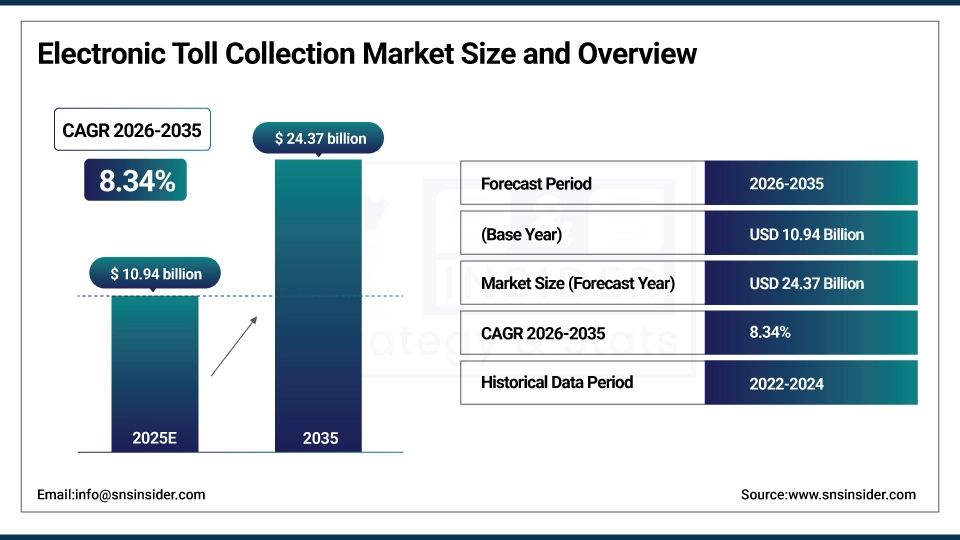
The Electronic Toll Collection Market Size was valued at USD 10.94 billion in 2025 and is expected to grow at 8.34% CAGR to reach USD 24.37 billion by 2035.
The demand for reducing traffic congestion and road accidents as well as the development of smart transportation infrastructure is driving the growing market growth for smart traffic systems. Gen AI applications through fraud detection and analysis of traffic patterns are creating disruptive innovations in the area of toll management, including data optimized tolling rates in real-time. Innovation and R&D are leading to constant transformation, with ETC systems across the world becoming increasingly scalable and efficient.
Electronic Toll Collection (ETC) Market Size and Growth Projection
-
Market Size in 2025: USD 10.94 Billion
-
Market Size by 2035: USD 24.37 Billion
-
CAGR: 8.34% from 2026 to 2035
-
Base Year: 2025
-
Forecast Period: 2026–2035
-
Historical Data: 2022–2024
Get more information on Electronic Toll Collection Market - Request Sample Report
Key Electronic Toll Collection Market Trends:
-
The rising adoption of congestion pricing models is encouraging the use of seamless and interoperable tolling systems.
-
Growing emphasis on reducing traffic delays and driver costs is driving demand for next-generation ETC solutions.
-
Governments are increasingly prioritizing smart transportation infrastructure to enhance urban mobility and reduce congestion.
-
Contactless and cashless toll payment adoption is accelerating due to efficiency, convenience, and environmental benefits.
-
Investments in advanced ETC technologies are expanding to improve sustainability, operational efficiency, and traffic flow.
U.S. Electronic Toll Collection Market Size Outlook
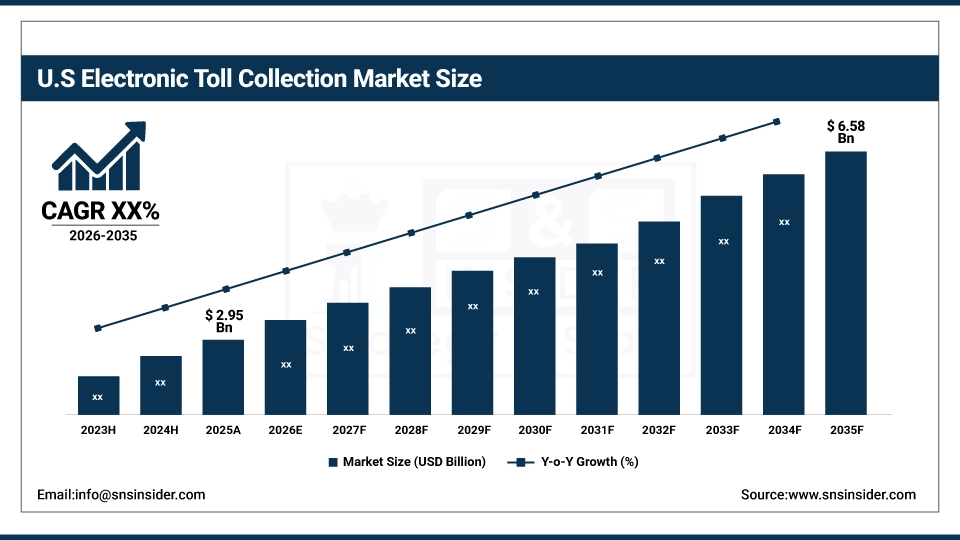
The U.S. Electronic Toll Collection (ETC) Market size is projected to grow from USD 2.95 Billion in 2025E to USD 6.58 Billion by 2035. Growth is driven by the increasing need to reduce traffic congestion on major highways and the modernization of aging transportation infrastructure. Rising adoption of all-electronic tolling systems, open-road tolling, and interoperable transponder technologies (like multi-state interoperability) further fuels market expansion. Additionally, the integration of these systems with smart city initiatives and the push for congestion pricing in major metropolitan areas are accelerating the deployment of advanced, cashless tolling solutions across the country.
Electronic Toll Collection Market Growth Drivers:
-
Demand for Electronic Toll Collection Market Increasing as Traffic Congestion and Rising Costs
The growing problem of traffic congestion in urban areas and highways acts as another major driving factor for the Electronic Toll Collection (ETC) market. However, for instance, under congestion pricing, drivers with E-ZPass get a USD 3 credit on the USD 9 toll, a reminder of the need for a tolling solution that works seamlessly with each system. The sitting in traffic cost drivers more than 1800 USD per year, or almost three weeks of work, according to a transportation analytics company. Rising costs and inefficiencies are driving demand for next-generation Electronic Toll Collection systems that decrease wait times, enhance traffic flow, and mitigate congestion. With governments moving towards developing smart transport infrastructure, Electronic Toll Collection systems are becoming paramount to increase urban mobility and lower costs.
Electronic Toll Collection Market Restraints:
-
Excessive Dependence On Technology And Vulnerability To Technical Breakdowns
Reliance on technology is a major restraint on the ETC market as it is sensitive to technical failures. ETC (electronic toll collection) systems involve LIDAR, radio frequency identification (RFID), dedicated short range communication (DSRC) systems, and other communication systems to perform these transactions, resulting in operational challenges of signal interference and malfunctioning systems, and the consequence of an integrity deficiency of information. Either regular updates or maintenance of every system could increase operational cost or it could cause discontinuity in smooth functioning of Electronic Toll Collection systems. To overcome these hurdles, continuous development of Electronic Toll Collection tech is needed.
Electronic Toll Collection Market Opportunities:
-
Electronic Toll Collection Market Growth with Contactless Payment Solutions
Due to the increasing shift towards contactless payment methods in urban toll systems, the Electronic Toll Collection market is rapidly growing. Compared to traditional toll collection systems, which operate through cash transactions, these systems are more than 50% efficient, with congestion at tollbooths decreasing by up to 30%, while providing operational and environmental benefits. With governments placing greater focus on modernizing infrastructure, the need for better toll systems supported by contactless payments is likely to grow. As a result, electronic tolling systems are set to see increased investments, with benefits of accelerating traffic flow, improving sustainability, and optimizing the collection of tolls.
Electronic Toll Collection Market Segment Analysis:
By Technology
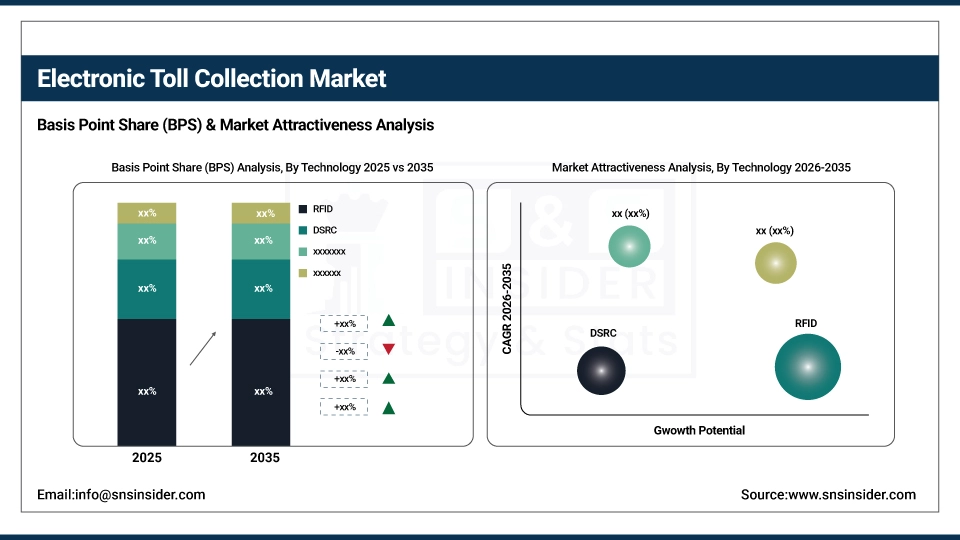
In 2025, the market was segmented into RFID, ARP, GNSS, and others, with RFID dominating the Electronic Toll Collection Market holding upwards of a 55% market share leveraging radio frequency identification for seamless tolling. RFID technology is used in vehicles to the pass through the tollbooths without stopping, alleviating the traffic signals. Its growth trajectory is attributed to increasing demand for contactless payments, lower operational costs, and scalability. The DSRC segment is projected to witness the fastest growth during the forecast period of 2026-2035, whose enabling rapid and low-latency communication facilitates data sharing in real time, enhances the efficiency of toll collection and this in conjunction with growing investment in smart infrastructure investment.
By Type
The Electronic Toll Collection market is dominated by Transponder/Tag-based tolling systems with a market share of approximately 70% in 2025. Equipped with RFID technology, these systems enable seamless and contactless toll collection, thereby reducing congestion and optimizing traffic flow. They are essential to modern tolling infrastructure due to their efficiency and convenience, as well as the increasing demand for digital payment solutions. The Other Tolling Systems segment, which includes GPS, video-based, and ANPR technologies, will also see substantial growth as it requires hardly any field hardware and is highly scalable.
By Offering
In 2025, the Hardware segment dominated the Electronic Toll Collection Market, accounting for over 60% of the share, owing to the availability of transponders, tags, and readers. This increase is driven by a growing rollout of the automated toll systems that make the process more efficient and cut down on congestion. The Back-office and Other Services segment is projected to have the highest CAGR over the forecast period 2026-2035, due to growth for software solutions, data analytics, and system integration, leading to improved data management, payment processing, and system scalability.
By Application
The Highways segment, including toll systems integrated within highways and expressways to decrease congestion and improve traffic flow, led the Electronic Toll Collection Market in 2025, accounting for 61% of the total market share. This growth is propelled by the requirement for efficient, contactless tolling solutions along with the development of smart highway infrastructure. As urban areas invest in automated tolling systems for traffic management and improved air quality, the Urban Areas segment is anticipated to witness the fastest growth between 2026 and 2035. This growth is intensifying with government initiatives and smart city investments.
Electronic Toll Collection Market Regional Analysis:
North America Electronic Toll Collection Market Insights
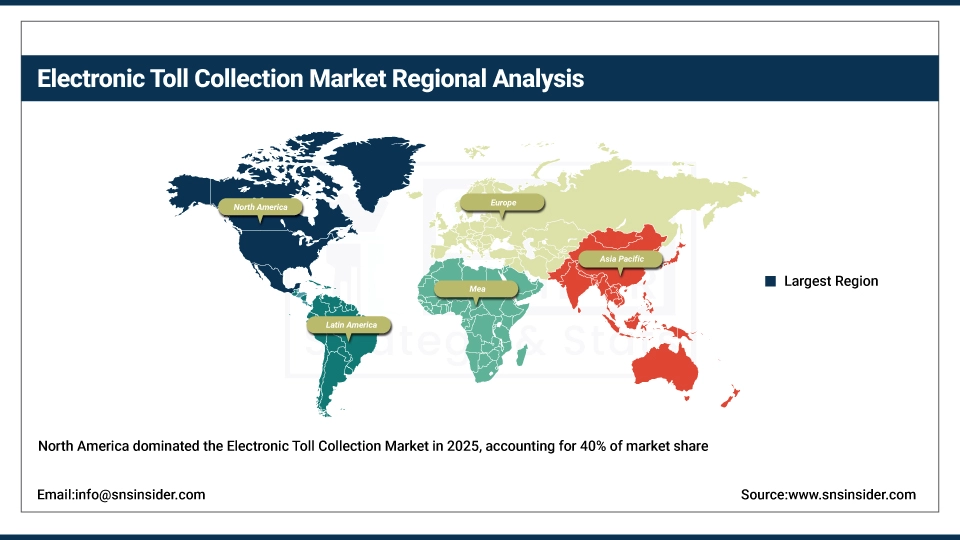
North America accounted for the largest revenue share in Electronic Toll Collection market, with over 40% revenue share in 2025. The growing adoption of advanced tolling technologies, especially in the U.S. and Canada, is a key driver for the region's domination. Infrastructure that increases the efficacy of toll collection over urban and highway areas is already well established in the U.S. The growth of the market increases due to the government initiatives supporting automated toll systems, contactless payments, and expansion of electronic tolling networks. North America's established network of transportation and continuous innovation further strengthened North America Electronic Toll Collection market.
Need any customization research on Electronic Toll Collection Market - Enquiry Now
Asia Pacific Electronic Toll Collection Market Insights
The Asia-pacific region will be the fastest growing region in the Electronic Toll Collection market and will expect to develop rapidly throughout the forecast period of 2026-2035. Leading nations like China, India, Japan, and South Korea are at the spearhead of this drive for market expansion. China’s extensive investments in smart infrastructure and its efforts to promote digital payment systems are playing a big part in the growth of the region. Various countries are already adopting tolling systems to ensure efficient traffic management such as India while companies in Japan and South Korea are even updating with automated toll collection technologies. Factors such as the increasing urbanization, the increasing demand for smart transportation systems, and government initiatives to modernize infrastructure are driving the rapid growth of the region.
Europe Electronic Toll Collection Market Insights
The Europe Electronic Toll Collection (ETC) market is expanding due to increasing government investments in intelligent transportation systems and the growing adoption of automated tolling solutions. Rising vehicle density, urbanization, and demand for seamless traffic management are driving the deployment of RFID, DSRC, and GPS-based tolling technologies. Governments are focusing on reducing congestion, fuel consumption, and emissions, while enhancing road safety and efficiency. Technological advancements, interoperability initiatives, and public-private collaborations further support market growth across highways, bridges, and urban road networks.
Latin America (LATAM) and Middle East & Africa (MEA) Electronic Toll Collection Market Insights
The LATAM and MEA Electronic Toll Collection (ETC) markets are witnessing growth driven by rising infrastructure development, increasing vehicle volumes, and government initiatives to modernize road networks. Adoption of RFID, ANPR, and GPS-based tolling systems is accelerating to reduce traffic congestion, enhance revenue collection, and improve road safety. Investments in smart transportation and public-private partnerships are supporting large-scale ETC deployments across highways, bridges, and urban roads. Growing awareness of efficient traffic management and environmental benefits further propels market expansion in these regions.
Electronic Toll Collection Companies are:
-
Conduent Business Services
-
EFKON GmbH
-
TransCore Holdings, Inc
-
Thales Group
-
Raytheon Technologies Corporation
-
Siemens
-
Neology, Inc.
-
VINCI
-
Feig Electronic GmbH
-
Toshiba Corporation
-
TRMI Systems Integration
-
Magnetic AutoControl
-
International Road Dynamics Inc
-
Honeywell International, Inc
-
Mitsubishi Heavy Industries, Ltd
-
Perceptics
-
Q-Free
Competitive Landscape for Electronic Toll Collection Market:
Neology, Inc. is a U.S.-based technology company specializing in electronic toll collection, RFID, and automated vehicle identification systems. It provides advanced solutions for tolling, border control, and traffic management, enhancing transportation efficiency and security across global smart mobility infrastructures.
-
May 03, 2024 – Neology’s 6C neoTag™ RFID transponders achieved IAG E-ZPass certification following 11,000 vehicle passes with 100% accuracy at Neology’s OmniAir Certified Test Track. That certification makes it interoperable with all agency tag types in the U.S. – an economical, battery-free and green solution to tolling.
Toshiba Corporation leverages its expertise in electronics and information technology to provide electronic toll collection solutions. The company develops advanced systems integrating RFID, imaging, and data processing, supporting efficient toll operations, traffic flow management, and smart transportation infrastructure across global markets.
-
February 21, 2024 – Toshiba introduced high-speed diodes for many types of DTMOSVI(HSD) power MOSFETs to enhance the efficiency of power supplies. The DTMOSVI Series enables 65% better reverse recovery in trr and x88% better in Qrr for 0.4% efficiency gain for data centers, photovoltaic power and electric toll collection.
|
Report Attributes |
Details |
| Market Size in 2025 | USD 10.94 Billion |
| Market Size by 2035 | USD 24.37 Billion |
| CAGR | CAGR of 8.34% From 2026 to 2035 |
| Base Year | 2025 |
| Forecast Period | 2026-2035 |
| Historical Data | 2022-2024 |
|
Report Scope & Coverage |
Market Size, Segments Analysis, Competitive Landscape, Regional Analysis, DROC & SWOT Analysis, Forecast Outlook |
|
Key Segments |
• By Type (Transponder-/Tag-based Tolling Systems, Other Tolling Systems) |
|
Regional Analysis/Coverage |
North America (US, Canada), Europe (Germany, UK, France, Italy, Spain, Russia, Poland, Rest of Europe), Asia Pacific (China, India, Japan, South Korea, Australia, ASEAN Countries, Rest of Asia Pacific), Middle East & Africa (UAE, Saudi Arabia, Qatar, South Africa, Rest of Middle East & Africa), Latin America (Brazil, Argentina, Mexico, Colombia, Rest of Latin America). |
|
Company Profiles |
Kapsch TrafficCom AG (Austria), Conduent Business Services (U.S.), EFKON GmbH (Austria), TransCore Holdings, Inc. (U.S.), Thales Group (U.S.), Raytheon Technologies Corporation (U.S.), Cubic Corporation (U.S.), Siemens (Germany), Neology, Inc. (U.S.), VINCI (France), Feig Electronic GmbH (Germany), Toshiba Corporation (Japan), TRMI Systems Integration (Japan), Magnetic AutoControl (Germany), International Road Dynamics Inc. (IRD) (Canada), Honeywell International, Inc. (U.S.), Mitsubishi Heavy Industries, Ltd. (Japan), Perceptics (U.S.), Q-Free (Norway). |
Frequently Asked Questions
Ans: North America dominated the Electronic Toll Collection Market in 2025.
Ans: Transponder/Tag-based tolling systems segment dominated the Electronic Toll Collection Market.
Ans: The key drivers of the Electronic Toll Collection Market are increasing traffic congestion, government smart transportation initiatives, and the demand for efficient, cashless tolling systems.
Ans: The Electronic Toll Collection Market was valued at USD 10.94 billion in 2025 and is expected to grow at 8.34% CAGR to reach USD 24.37 billion by 2035.
Ans: The Electronic Toll Collection Market is expected to grow at a CAGR of 8.3% from 2026-2035.
Get in Touch
