image

Fiber Optic Connectors Market Report Scope & Overview:

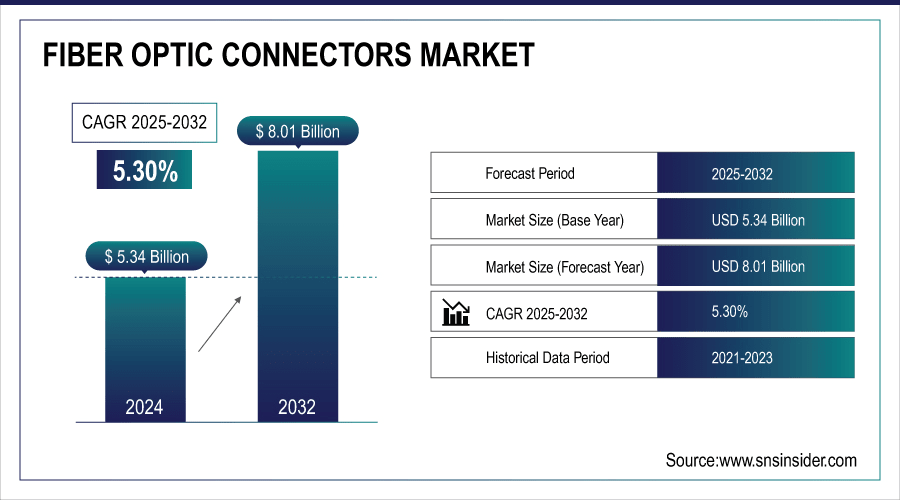
The Fiber Optic Connectors Market Size was valued at USD 5.34 billion in 2024 and is expected to reach USD 8.01 billion by 2032 and grow at a CAGR of 5.30 % over the forecast period 2025-2032.

The world fiber optic connectors market growth is due to the growing demand for high-speed data transfer, the spread of telecommunication networks and the opening of data centers. The market includes different types of connectors as SC, LC, FC, ST, MTP/MPO, and Others that serve the particular demand of various end-user industries including telecommunications, medical and healthcare, aerospace, defense, and others.

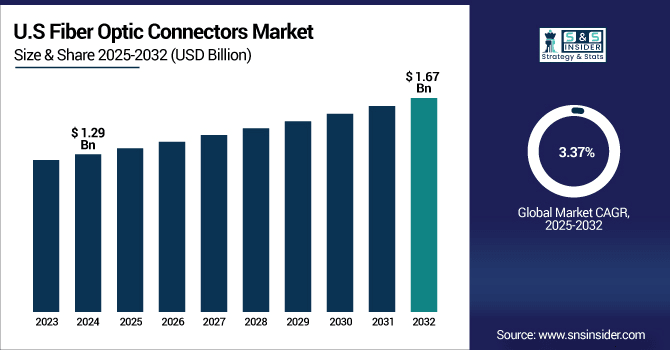
The U.S. Fiber Optic Connectors Market size was USD 1.29 billion in 2024 and is expected to reach USD 1.67 billion by 2032, growing at a CAGR of 3.37 % over the forecast period of 2025–2032.

The US market growth is driven by the rise in adoption of high-speed data services, growth of data centers, and the roll-out of 5G network. Market roads for high speed data transfer in numerous end use industries such as telecommunication, healthcare and military, are expected to drive growth of the market.

According to research, approximately 85% of US households have access to broadband internet, with a growing share subscribing to speeds above 100 Mbps.

Market Dynamics

Key Drivers:

  • Growing demand for high-speed data transmission across various industries necessitates the adoption of fiber optic connectors

There is a lot more of data being consumed exponentially with applications such as streaming services, cloud computing and so on which demand the efficient and reliable ways of data transmission. The high-bandwidth and low-signal-loss properties of fiber optic connectors make them suitable for this purpose. They find use in telecommunications, data centers, health, and militaries where fast and reliable transfer of information is critical. The constantly demand of enhanced networking performance and the growing up of high speed Internet combine to essentially drive up the demand of the fiber optic connector.

According to research, over 60% of households in developed countries have access to gigabit-speed internet, increasing demand for reliable fiber optic infrastructure.

Restrain:

  • Lack of standardization across manufacturers reduces compatibility, creating integration issues and slowing technology adoption in critical multi-vendor networks

There are no industry standard about fiber optic connector; this means some of the connectors are not compatible with other manufactures. The manufacturers frequently apply different designs, thus resulting into compatibility issues in the multi-vendor network systems. With large enterprises looking to grow their fiber infrastructure, it becomes increasingly difficult to implement a variety of fiber solutions, causing time and costs associated to cutting and fitting customized connectors or adapters. These problems are especially challenging in industries such as telecom and aerospace in which system reliability and speed are critical. Besides, without standardization, quality control is difficult. As a result this hindersmassive deployment, hampers supply chain efficiency, and deters to end users from being moved onto fibre networks which in turn affects market growth and technology scalability.

Opportunities:

  • Rising deployment of 5G networks worldwide creates substantial demand for fiber optic connectors in high-speed, low-latency communication infrastructure systems

5G nets are also driving significant needs for high-end fiber-optic connectors that can service higher speeds with lower latency than ever before. Fiber optic Fiber cables are important for managing the high volume of data for 5G backhaul and fronthaul infrastructure. To really get the job done, rapid data transfer is essential between network components and connectors play a vital part in telecom roll out plans. Amphenol Corporation is well-positioned to benefit from the trend with customized solutions for 5G rollout. The rising demand is further accentuated by the emergence of smart city developments, connected cars and the expansion of IoT, giving manufacturers enhanced opportunities of market penetration, additional revenue streams, and future-proof technology integration into digital ecosystems and future infrastructure.            

According to research, Fiber optic technology reduces energy consumption by up to 70% compared to traditional copper cables, supporting greener 5G infrastructure development.

Challenges:

  • Managing signal loss and physical fragility remains a major challenge for fiber optic connectors in harsh environments

Loss of signals from misalignment and the physical weakness of the connector are major problems for the fiber optic connector. Environmental conditions such as moisture, dust, and high/low temperatures may reduce the reliability of the connectors. This degrades signal integrity and network up time, particularly in outdoor and industrial environments. Durable yet optically efficient are difficult to find in one package and demand special materials and manufacturing. The type of companies like Corning Incorporated spends a lot in R&D to solve these problems. Overcoming these challenges is important to further grow the use of FO connectors in demanding industries such as the military and aerospace, and telecommunications, which have stringent demands for the reliability of the connectors.

Segment Analysis:

By Product

The LC segment dominated the highest Fiber Optic Connectors Market Share of about 36.17% in 2024. It is perfect for high-density applications, like data centers and telecommunications equipment. Fiber optic connectors companies like  Amphenol Corporation is a major participant in this market and has invested heavily in the development of LC connectors and its products are used across this industry. Push-pull structure of LC connector helps simplify installation and maintenance. Besides, it supports diverse devices and systems, which also contributes to its dominance in various fields.

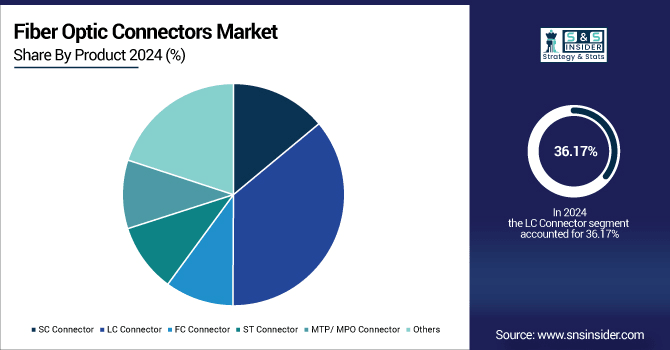
The MTP/MPO Connector segment is expected to grow at the fastest CAGR of about 7.10% from 2025 to 2032.  Such demand is attributed to the need for high-speed data transmission in data centers and enterprise networks. Molex LLC continues to build its MTP/MPO product offering for cloud infrastructure with new DC connectors. Such connectors are capable of receiving a plurality of fibers in a single connector to provide a dense and simple network of the array. Their ability to accommodate applications that require large bandwidth also makes them an indispensable part of future-proof network deployments.

By Application

The Telecom segment dominated the Fiber Optic Connectors Market with the highest revenue share of about 31.90% in 2024. The growth of mobile data, the spread of broadband and the deployment of 5G across the globe are demanding highly resilient networking. The company Corning, a key global supplier, supplies advanced connector products used throughout the telecom network. These companies require the bandwidth and reliability that fiber optic connectors can provide in this fast moving industry. Ongoing fibre-optic telecom backbone investment in the world's fibre-optic market also bolster the segment's market dominance.

The Medical segment is expected to grow at the fastest CAGR of about 11.01% from 2025 to 2032. High-quality data transmission is required with development of new medical devices, such as endoscope, imaging system and laser surgery. However, TE Connectivity provides critical precision connectors for use in medical-grade applications. The increasing use of telemedicine and remote diagnostics is pushing healthcare organizations to deploy more dependable fibre optic interfaces. With an increasing emphasis on obtaining real-time data from the patient, the medical fiber optic connectors market is growing at a fast pace.

Regional Analysis:

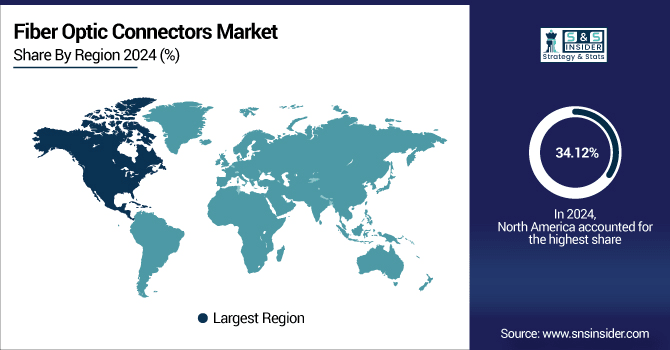
North America dominated the Fiber Optic Connectors Market with the highest revenue share of about 34.12% in 2024. That dominance is provided by the region’s strong telecommunications infrastructure, a track record for early technology adoption, and massive investments being put into 5G and expansion of data centers. The market is also driven by the presence of key industry players and governments support ongoing digital infrastructure improvements. Demand for secure, high-speed connections throughout industries continues to solidify North America as a mark leader in the world.

  • The U.S. market for fiber optic connectors is North America’s largest, noted for a strong and well-developed digital infrastructure, strong government support, high demand for high-speed internet, and widespread deployment of 5G and data centers, stimulating ongoing growth and technological progress in the market.

The Asia Pacific segment is expected to grow at the fastest CAGR of about 6.42% from 2025 to 2032. Fast urbanization, growing telecom networks, and surging data consumption are the key growth attributes. Escalating investments in smart-city, cloud computing, and the deployment of 5G are fuelling the demand for fiber optic connectors. China, India, Japan and other countries are actively building network infrastructure, and the region is now a major hotbed of market expansion and technological innovation for fiber optics.

  • The Asia Pacific fiber optic connectors market is primarily dominated by China on account of huge telecom infrastructure investments, rapid 5G network growth, wide scale urbanization, and government measures for digitization and the country is also the biggest consumer and producer of cutting-edge fiber optic technologies across the Asia Pacific region.

The fiber optic connectors market in Europe is on the rise due to the growing demand for high-speed internet and burgeoning of telecommunications networks and 5G technology in the region. A robust support from the government for digital infrastructure, smart city initiatives, and increasing investments in the construction of data centers drive the market.

  • Germany is leading the Europe fiber optic connectors market on account of its robust industrial sector, developed telecom infrastructure, early adoption of 5G and significant investments in digital and smart city projects which, in turn, is on the high demand and technological advancements across the region.

Middle East & Africa fiber optic connectors industry is led by UAE on account of rapid 5G deployment, rising telecom infrastructure investments and smart city projects. Likewise, Brazil leads the way for Latin America with increasing internet penetration, government policies on digitalization, and demand for high-speed internet are driving huge growth in advanced fiber optics usage.

Key Players:

Major Key Players in Fiber Optic Connectors Market are Corning Incorporated, Amphenol Corporation, TE Connectivity Ltd., Molex LLC, Sumitomo Electric Industries, Ltd., 3M Company, CommScope Holding Company, Inc., Radiall SA, LEMO, Fischer Connectors

Rcent Developments

  • In May 2025, Corning has introduced a new bend-insensitive LC connector designed to withstand harsh environmental conditions, enhancing durability and performance in challenging installations

  • In May 2025, Molex released the External Laser Source Interconnect System (ELSIS), a comprehensive system of cage, optical, and electrical connectors. ELSIS provides engineers with a head start on development and testing, catering to the needs of high-speed data transmission applications.

Fiber Optic Connectors Market Report Scope:

Report Attributes Details
Market Size in 2024 USD 5.34 Billion 
Market Size by 2032 USD 8.01 Billion 
CAGR CAGR of 5.30% From 2025 to 2032
Base Year 2024
Forecast Period 2025-2032
Historical Data 2021-2023
Report Scope & Coverage Market Size, Segments Analysis, Competitive Landscape, Regional Analysis, DROC & SWOT Analysis, Forecast Outlook
Key Segments • By Product (SC Connector, LC Connector, FC Connector, ST Connector, MTP/ MPO Connector, Others)
• By Application (Telecom, Oil & Gas, Military & Aerospace, BFSI, Medical, Railway, Others)
Regional Analysis/Coverage North America (US, Canada, Mexico), Europe (Germany, France, UK, Italy, Spain, Poland, Turkey, Rest of Europe), Asia Pacific (China, India, Japan, South Korea, Singapore, Australia,Taiwan, Rest of Asia Pacific), Middle East & Africa (UAE, Saudi Arabia, Qatar, South Africa, Rest of Middle East & Africa), Latin America (Brazil, Argentina, Rest of Latin America)
Company Profiles Corning Incorporated, Amphenol Corporation, TE Connectivity Ltd., Molex LLC, Sumitomo Electric Industries, Ltd., 3M Company, CommScope Holding Company, Inc., Radiall SA, LEMO, Fischer Connectors

Frequently Asked Questions

Ans: The Fiber Optic Connectors Market is expected to grow at a CAGR of 5.30 % from 2025-2032.

Ans: The Fiber Optic Connectors Market size was USD 5.34 billion in 2024 and is expected to reach USD 8.01 billion by 2032.

Ans: The major growth factor of the Fiber Optic Connectors Market is the increasing demand for high-speed internet and 5G network expansion requiring efficient fiber optic connectors globally.

Ans: LC Connector segment dominated the Fiber Optic Connectors Market.

Ans: North America dominated the Fiber Optic Connectors Market in 2024.

Table of Content

1. Introduction

1.1 Market Definition

1.2 Scope (Inclusion and Exclusions)

1.3 Research Assumptions

2. Executive Summary

2.1 Market Overview

2.2 Regional Synopsis

2.3 Competitive Summary

3. Research Methodology

3.1 Top-Down Approach

3.2 Bottom-up Approach

3.3. Data Validation

3.4 Primary Interviews

4. Market Dynamics Impact Analysis

4.1 Market Driving Factors Analysis

4.1.2 Drivers

4.1.2 Restraints

4.1.3 Opportunities

4.1.4 Challenges

4.2 PESTLE Analysis

4.3 Porter’s Five Forces Model

5. Statistical Insights and Trends Reporting

5.1 AI Connector Design Acceleration Rate

5.2 Connector Impact on Edge Computing Efficiency

5.3 Connector Energy Loss Metrics

5.4 AI-Optimized Network Design Impact

6. Competitive Landscape

6.1 List of Major Companies, By Region

6.2 Market Share Analysis, By Region

6.3 Product Benchmarking

6.3.1 Product specifications and features

6.3.2 Pricing

6.4 Strategic Initiatives

6.4.1 Marketing and promotional activities

6.4.2 Distribution and supply chain strategies

6.4.3 Expansion plans and new product launches

6.4.4 Strategic partnerships and collaborations

6.5 Technological Advancements

6.6 Market Positioning and Branding

7. Fiber Optic Connectors Market Segmentation, By Product

7.1 Chapter Overview

7.2 SC Connector

7.2.1 SC Connector Market Trends Analysis (2021-2032)

7.2.2 SC Connector Market Size Estimates and Forecasts to 2032 (USD Billion)

7.3 LC Connector

7.3.1 LC Connector Market Trends Analysis (2021-2032)

7.3.2 LC Connector Market Size Estimates and Forecasts to 2032 (USD Billion)

7.4 FC Connector

7.4.1 FC Connector Market Trends Analysis (2021-2032)

7.4.2 FC Connector Market Size Estimates and Forecasts to 2032 (USD Billion)

7.5 ST Connector

7.5.1 ST Connector Market Trends Analysis (2021-2032)

7.5.2 ST Connector Market Size Estimates and Forecasts to 2032 (USD Billion)

7.6 MTP/ MPO Connector

7.6.1 MTP/ MPO Connector Market Trends Analysis (2021-2032)

7.6.2 MTP/ MPO Connector Market Size Estimates and Forecasts to 2032 (USD Billion)

7.7 Others

7.7.1 Others Market Trends Analysis (2021-2032)

7.7.2 Others Market Size Estimates and Forecasts to 2032 (USD Billion)

8. Fiber Optic Connectors Market Segmentation, by Application

8.1 Chapter Overview

8.2 Telecom

8.2.1 Telecom Market Trends Analysis (2021-2032)

8.2.2 Telecom Market Size Estimates and Forecasts to 2032 (USD Billion)

8.3 Oil & Gas

8.3.1 Oil & Gas Market Trends Analysis (2021-2032)

8.3.2 Oil & Gas Market Size Estimates and Forecasts to 2032 (USD Billion)

8.4 Military & Aerospace

8.4.1 Military & Aerospace Market Trends Analysis (2021-2032)

8.4.2 Military & Aerospace Market Size Estimates and Forecasts to 2032 (USD Billion)

8.5 BFSI

8.5.1 BFSI Market Trends Analysis (2021-2032)

8.5.2 BFSI Market Size Estimates and Forecasts to 2032 (USD Billion)

8.6 Medical

8.6.1 Medical Market Trends Analysis (2021-2032)

8.6.2 Medical Market Size Estimates and Forecasts to 2032 (USD Billion)

8.7 Railway

8.7.1 Railway Market Trends Analysis (2021-2032)

8.7.2 Railway Market Size Estimates and Forecasts to 2032 (USD Billion)

8.8 Other

8.8.1 Other Market Trends Analysis (2021-2032)

8.8.2 Other Market Size Estimates and Forecasts to 2032 (USD Billion)

9. Regional Analysis

9.1 Chapter Overview

9.2 North America

9.2.1 Trends Analysis

9.2.2 North America Fiber Optic Connectors Market Estimates and Forecasts, by Country (2021-2032) (USD Billion)

9.2.3 North America Fiber Optic Connectors Market Estimates and Forecasts, By Product (2021-2032) (USD Billion) 

9.2.4 North America Fiber Optic Connectors Market Estimates and Forecasts, by Application (2021-2032) (USD Billion)

9.2.5 USA

9.2.5.1 USA Fiber Optic Connectors Market Estimates and Forecasts, By Product (2021-2032) (USD Billion)

9.2.5.2 USA Fiber Optic Connectors Market Estimates and Forecasts, by Application (2021-2032) (USD Billion)

9.2.6 Canada

9.2.6.1 Canada Fiber Optic Connectors Market Estimates and Forecasts, By Product (2021-2032) (USD Billion)

9.2.6.2 Canada Fiber Optic Connectors Market Estimates and Forecasts, by Application (2021-2032) (USD Billion)

9.2.7 Mexico

9.2.7.1 Mexico Fiber Optic Connectors Market Estimates and Forecasts, By Product (2021-2032) (USD Billion)

9.2.7.2 Mexico Fiber Optic Connectors Market Estimates and Forecasts, by Application (2021-2032) (USD Billion)

9.3 Europe

9.3.1 Trends Analysis

9.3.2 Europe Fiber Optic Connectors Market Estimates and Forecasts, by Country (2021-2032) (USD Billion)

9.3.3 Europe Fiber Optic Connectors Market Estimates and Forecasts, By Product (2021-2032) (USD Billion) 

9.3.4 Europe Fiber Optic Connectors Market Estimates and Forecasts, by Application (2021-2032) (USD Billion)

9.3.5 Germany

9.3.5.1 Germany Fiber Optic Connectors Market Estimates and Forecasts, By Product (2021-2032) (USD Billion)

9.3.5.2 Germany Fiber Optic Connectors Market Estimates and Forecasts, by Application (2021-2032) (USD Billion)

9.3.6 France

9.3.6.1 France Fiber Optic Connectors Market Estimates and Forecasts, By Product (2021-2032) (USD Billion)

9.3.6.2 France Fiber Optic Connectors Market Estimates and Forecasts, by Application (2021-2032) (USD Billion)

9.3.7 UK

9.3.7.1 UK Fiber Optic Connectors Market Estimates and Forecasts, By Product (2021-2032) (USD Billion)

9.3.7.2 UK Fiber Optic Connectors Market Estimates and Forecasts, by Application (2021-2032) (USD Billion)

9.3.8 Italy

9.3.8.1 Italy Fiber Optic Connectors Market Estimates and Forecasts, By Product (2021-2032) (USD Billion)

9.3.8.2 Italy Fiber Optic Connectors Market Estimates and Forecasts, by Application (2021-2032) (USD Billion)

9.3.9 Spain

9.3.9.1 Spain Fiber Optic Connectors Market Estimates and Forecasts, By Product (2021-2032) (USD Billion)

9.3.9.2 Spain Fiber Optic Connectors Market Estimates and Forecasts, by Application (2021-2032) (USD Billion)

9.3.10 Poland

9.3.10.1 Poland Fiber Optic Connectors Market Estimates and Forecasts, By Product (2021-2032) (USD Billion)

9.3.10.2 Poland Fiber Optic Connectors Market Estimates and Forecasts, by Application (2021-2032) (USD Billion)

9.3.11 Turkey

9.3.11.1 France Fiber Optic Connectors Market Estimates and Forecasts, By Product (2021-2032) (USD Billion)

9.3.11.2 France Fiber Optic Connectors Market Estimates and Forecasts, by Application (2021-2032) (USD Billion)

9.3.12 Rest of Europe

9.3.12.1 UK Fiber Optic Connectors Market Estimates and Forecasts, By Product (2021-2032) (USD Billion)

9.3.12.2 UK Fiber Optic Connectors Market Estimates and Forecasts, by Application (2021-2032) (USD Billion)

9.4 Asia-Pacific

9.4.1 Trends Analysis

9.4.2 Asia-Pacific Fiber Optic Connectors Market Estimates and Forecasts, by Country (2021-2032) (USD Billion)

9.4.3 Asia-Pacific Fiber Optic Connectors Market Estimates and Forecasts, By Product (2021-2032) (USD Billion) 

9.4.4 Asia-Pacific Fiber Optic Connectors Market Estimates and Forecasts, by Application (2021-2032) (USD Billion)

9.4.5 China

9.4.5.1 China Fiber Optic Connectors Market Estimates and Forecasts, By Product (2021-2032) (USD Billion)

9.4.5.2 China Fiber Optic Connectors Market Estimates and Forecasts, by Application (2021-2032) (USD Billion)

9.4.6 India

9.4.5.1 India Fiber Optic Connectors Market Estimates and Forecasts, By Product (2021-2032) (USD Billion)

9.4.5.2 India Fiber Optic Connectors Market Estimates and Forecasts, by Application (2021-2032) (USD Billion)

9.4.7 Japan

9.4.7.1 Japan Fiber Optic Connectors Market Estimates and Forecasts, By Product (2021-2032) (USD Billion)

9.4.7.2 Japan Fiber Optic Connectors Market Estimates and Forecasts, by Application (2021-2032) (USD Billion)

9.4.8 South Korea

9.4.8.1 South Korea Fiber Optic Connectors Market Estimates and Forecasts, By Product (2021-2032) (USD Billion)

9.4.8.2 South Korea Fiber Optic Connectors Market Estimates and Forecasts, by Application (2021-2032) (USD Billion)

9.4.9 Singapore

9.4.9.1 Singapore Fiber Optic Connectors Market Estimates and Forecasts, By Product (2021-2032) (USD Billion)

9.4.9.2 Singapore Fiber Optic Connectors Market Estimates and Forecasts, by Application (2021-2032) (USD Billion)

9.4.10 Australia

9.4.10.1 Australia Fiber Optic Connectors Market Estimates and Forecasts, By Product (2021-2032) (USD Billion)

9.4.10.2 Australia Fiber Optic Connectors Market Estimates and Forecasts, by Application (2021-2032) (USD Billion)

9.4.11 Taiwan

9.4.11.1 Taiwan Fiber Optic Connectors Market Estimates and Forecasts, By Product (2021-2032) (USD Billion)

9.4.11.2 Taiwan Fiber Optic Connectors Market Estimates and Forecasts, by Application (2021-2032) (USD Billion)

9.4.12 Rest of Asia-Pacific

9.4.12.1 Rest of Asia-Pacific Fiber Optic Connectors Market Estimates and Forecasts, By Product (2021-2032) (USD Billion)

9.4.12.2 Rest of Asia-Pacific Fiber Optic Connectors Market Estimates and Forecasts, by Application (2021-2032) (USD Billion)

9.5 Middle East and Africa

9.5.1 Trends Analysis

9.5.2 Middle East and Africa Fiber Optic Connectors Market Estimates and Forecasts, by Country (2021-2032) (USD Billion)

9.5.3 Middle East and Africa Fiber Optic Connectors Market Estimates and Forecasts, By Product (2021-2032) (USD Billion) 

9.5.4 Middle East and Africa Fiber Optic Connectors Market Estimates and Forecasts, by Application (2021-2032) (USD Billion)

9.5.5 UAE

9.5.5.1 UAE Fiber Optic Connectors Market Estimates and Forecasts, By Product (2021-2032) (USD Billion)

9.5.5.2 UAE Fiber Optic Connectors Market Estimates and Forecasts, by Application (2021-2032) (USD Billion)

9.5.6 Saudi Arabia

9.5.6.1 Saudi Arabia Fiber Optic Connectors Market Estimates and Forecasts, By Product (2021-2032) (USD Billion)

9.5.6.2 Saudi Arabia Fiber Optic Connectors Market Estimates and Forecasts, by Application (2021-2032) (USD Billion)

9.5.7 Qatar

9.5.7.1 Qatar Fiber Optic Connectors Market Estimates and Forecasts, By Product (2021-2032) (USD Billion)

9.5.7.2 Qatar Fiber Optic Connectors Market Estimates and Forecasts, by Application (2021-2032) (USD Billion)

9.5.8 South Africa

9.5.8.1 South Africa Fiber Optic Connectors Market Estimates and Forecasts, By Product (2021-2032) (USD Billion)

9.5.8.2 South Africa Fiber Optic Connectors Market Estimates and Forecasts, by Application (2021-2032) (USD Billion)

9.5.9 Rest of Middle East & Africa

9.5.9.1 Rest of Middle East & Africa Fiber Optic Connectors Market Estimates and Forecasts, By Product (2021-2032) (USD Billion)

9.5.9.2 Rest of Middle East & Africa Fiber Optic Connectors Market Estimates and Forecasts, by Application (2021-2032) (USD Billion)

9.6 Latin America

9.6.1 Trends Analysis

9.6.2 Latin America Fiber Optic Connectors Market Estimates and Forecasts, by Country (2021-2032) (USD Billion)

9.6.3 Latin America Fiber Optic Connectors Market Estimates and Forecasts, By Product (2021-2032) (USD Billion) 

9.6.4 Latin America Fiber Optic Connectors Market Estimates and Forecasts, by Application (2021-2032) (USD Billion)

9.6.5 Brazil

9.6.5.1 Brazil Fiber Optic Connectors Market Estimates and Forecasts, By Product (2021-2032) (USD Billion)

9.6.5.2 Brazil Fiber Optic Connectors Market Estimates and Forecasts, by Application (2021-2032) (USD Billion)

9.6.6 Argentina

9.6.6.1 Argentina Fiber Optic Connectors Market Estimates and Forecasts, By Product (2021-2032) (USD Billion)

9.6.6.2 Argentina Fiber Optic Connectors Market Estimates and Forecasts, by Application (2021-2032) (USD Billion)

9.6.7 Rest of Latin America

9.6.7.1 Rest of Latin America Fiber Optic Connectors Market Estimates and Forecasts, By Product (2021-2032) (USD Billion)

9.6.7.2 Rest of Latin America Fiber Optic Connectors Market Estimates and Forecasts, by Application (2021-2032) (USD Billion)

10. Company Profiles

10.1 Corning Incorporated

              10.1.1 Company Overview

10.1.2 Financial

10.1.3 Products/ Services Offered

10.1.4 SWOT Analysis

10.2 Amphenol Corporation

10.2.1 Company Overview

10.2.2 Financial

10.2.3 Products/ Services Offered

10.2.4 SWOT Analysis

10.3 TE Connectivity Ltd.

              10.3.1 Company Overview

10.3.2 Financial

10.3.3 Products/ Services Offered

10.3.4 SWOT Analysis

10.4 Molex LLC

10.4.1 Company Overview

10.4.2 Financial

10.4.3 Products/ Services Offered

10.4.4 SWOT Analysis

10.5 Sumitomo Electric Industries, Ltd.

              10.5.1 Company Overview

10.5.2 Financial

10.5.3 Products/ Services Offered

10.5.4 SWOT Analysis

10.6 3M Company

10.6.1 Company Overview

10.6.2 Financial

10.6.3 Products/ Services Offered

10.6.4 SWOT Analysis

10.7 CommScope Holding Company, Inc.

              10.7.1 Company Overview

10.7.2 Financial

10.7.3 Products/ Services Offered

10.7.4 SWOT Analysis

10.8 Radiall SA

              10.8.1 Company Overview

10.8.2 Financial

10.8.3 Products/ Services Offered

10.8.4 SWOT Analysis

10.9 LEMO

10.9.1 Company Overview

10.9.2 Financial

10.9.3 Products/ Services Offered

10.9.4 SWOT Analysis

10.10 Fischer Connectors

             10.10.1 Company Overview

10.10.2 Financial

10.10.3 Products/ Services Offered

10.10.4 SWOT Analysis

11. Use Cases and Best Practices

12. Conclusion

An accurate research report requires proper strategizing as well as implementation. There are multiple factors involved in the completion of good and accurate research report and selecting the best methodology to compete the research is the toughest part. Since the research reports we provide play a crucial role in any company’s decision-making process, therefore we at SNS Insider always believe that we should choose the best method which gives us results closer to reality. This allows us to reach at a stage wherein we can provide our clients best and accurate investment to output ratio.

Each report that we prepare takes a timeframe of 350-400 business hours for production. Starting from the selection of titles through a couple of in-depth brain storming session to the final QC process before uploading our titles on our website we dedicate around 350 working hours. The titles are selected based on their current market cap and the foreseen CAGR and growth.


The 5 steps process:

Step 1: Secondary Research:

Secondary Research or Desk Research is as the name suggests is a research process wherein, we collect data through the readily available information. In this process we use various paid and unpaid databases which our team has access to and gather data through the same. This includes examining of listed companies’ annual reports, Journals, SEC filling etc. Apart from this our team has access to various associations across the globe across different industries. Lastly, we have exchange relationships with various university as well as individual libraries.

Secondary Research

Step 2: Primary Research

When we talk about primary research, it is a type of study in which the researchers collect relevant data samples directly, rather than relying on previously collected data.  This type of research is focused on gaining content specific facts that can be sued to solve specific problems. Since the collected data is fresh and first hand therefore it makes the study more accurate and genuine.

We at SNS Insider have divided Primary Research into 2 parts.

Part 1 wherein we interview the KOLs of major players as well as the upcoming ones across various geographic regions. This allows us to have their view over the market scenario and acts as an important tool to come closer to the accurate market numbers. As many as 45 paid and unpaid primary interviews are taken from both the demand and supply side of the industry to make sure we land at an accurate judgement and analysis of the market.

This step involves the triangulation of data wherein our team analyses the interview transcripts, online survey responses and observation of on filed participants. The below mentioned chart should give a better understanding of the part 1 of the primary interview.

Primary Research

Part 2: In this part of primary research the data collected via secondary research and the part 1 of the primary research is validated with the interviews from individual consultants and subject matter experts.

Consultants are those set of people who have at least 12 years of experience and expertise within the industry whereas Subject Matter Experts are those with at least 15 years of experience behind their back within the same space. The data with the help of two main processes i.e., FGDs (Focused Group Discussions) and IDs (Individual Discussions). This gives us a 3rd party nonbiased primary view of the market scenario making it a more dependable one while collation of the data pointers.

Step 3: Data Bank Validation

Once all the information is collected via primary and secondary sources, we run that information for data validation. At our intelligence centre our research heads track a lot of information related to the market which includes the quarterly reports, the daily stock prices, and other relevant information. Our data bank server gets updated every fortnight and that is how the information which we collected using our primary and secondary information is revalidated in real time.

Data Bank Validation

Step 4: QA/QC Process

After all the data collection and validation our team does a final level of quality check and quality assurance to get rid of any unwanted or undesired mistakes. This might include but not limited to getting rid of the any typos, duplication of numbers or missing of any important information. The people involved in this process include technical content writers, research heads and graphics people. Once this process is completed the title gets uploader on our platform for our clients to read it.

Step 5: Final QC/QA Process:

This is the last process and comes when the client has ordered the study. In this process a final QA/QC is done before the study is emailed to the client. Since we believe in giving our clients a good experience of our research studies, therefore, to make sure that we do not lack at our end in any way humanly possible we do a final round of quality check and then dispatch the study to the client.

Key Segments: 

By Product

  • SC Connector

  • LC Connector

  • FC Connector

  • ST Connector

  • MTP/ MPO Connector

  • Others

By Application

  • Telecom

  • Oil & Gas

  • Military & Aerospace

  • BFSI

  • Medical

  • Railway

  • Others

Request for Segment Customization as per your Business Requirement: Segment Customization Request

Regional Coverage: 

North America

  • US

  • Canada

  • Mexico

Europe

  • Germany

  • France

  • UK

  • Italy

  • Spain

  • Poland

  • Turkey

  • Rest of Europe

Asia Pacific

  • China

  • India

  • Japan

  • South Korea

  • Singapore

  • Australia

  • Taiwan

  • Rest of Asia Pacific

Middle East & Africa

  • UAE

  • Saudi Arabia

  • Qatar

  • South Africa

  • Rest of Middle East & Africa

Latin America

  • Brazil

  • Argentina

  • Rest of Latin America

Request for Country Level Research Report: Country Level Customization Request

Available Customization 

With the given market data, SNS Insider offers customization as per the company’s specific needs. The following customization options are available for the report: 

  • Detailed Volume Analysis 

  • Criss-Cross segment analysis (e.g. Product X Application) 

  • Competitive Product Benchmarking 

  • Geographic Analysis 

  • Additional countries in any of the regions 

  • Customized Data Representation 

  • Detailed analysis and profiling of additional market players

Explore Key Insights 


  • Analyzes market trends, forecasts, and regional dynamics
  • Covers core offerings, innovations, and industry use cases
  • Profiles major players, value chains, and strategic developments
  • Highlights innovation trends, regulatory impacts, and growth opportunities
Request an Analyst Call