image

Field Devices Calibration Services Market Size, Share, and Segmentation by Type (Temperature and Humidity Calibration, Electrical Calibration, Pressure Calibration, Mechanical Calibration), Industries (Process Industries, Discrete Industries), End-User (Healthcare, Automotive, Aerospace and Defense, Oil and Gas, Pharmaceuticals and Biotechnology, Semiconductors, and Others), Calibration Method (Manual, and Automated), and Region | Global Forecast 2025-2032

Date: July 2025 Report Code: SNS/ICT/8024 Page 310

Field Devices Calibration Services Market Report Scope & Overview:

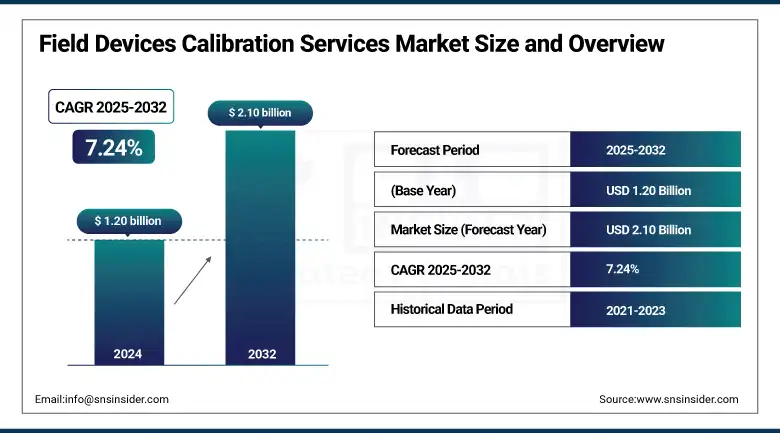
The Field Devices Calibration Services Market Size was valued at USD 1.20 billion in 2024 and is expected to reach USD 2.10 billion by 2032 and grow at a CAGR of 7.24% over the forecast period 2025-2032.

The market is witnessing strong growth due to rising demand for precision, regulatory compliance, and operational efficiency across industries. These services ensure the accuracy of instruments such as flow meters, pressure gauges, and temperature sensors, which are critical for industrial operations. Technological advancements, increasing automation, and stringent quality control regulations are key drivers fueling market expansion. Industries like oil & gas, pharmaceuticals, manufacturing, and energy are major end-users. Service providers offer both in-lab and on-site calibration solutions, enhancing flexibility and minimizing downtime. The market is poised for continued growth as industries prioritize reliability and equipment performance.

According to a study, growing industrial automation and stricter regulatory standards are driving demand for field device calibration services. This demand has surged due to the need for precise measurements in sectors like oil & gas, pharmaceuticals, and manufacturing. As a result, over 60% of industrial facilities now schedule regular calibration to reduce downtime and ensure compliance. Additionally, the rise in smart factories and IoT-enabled devices has led to a 40% increase in remote and on-site calibration service adoption.

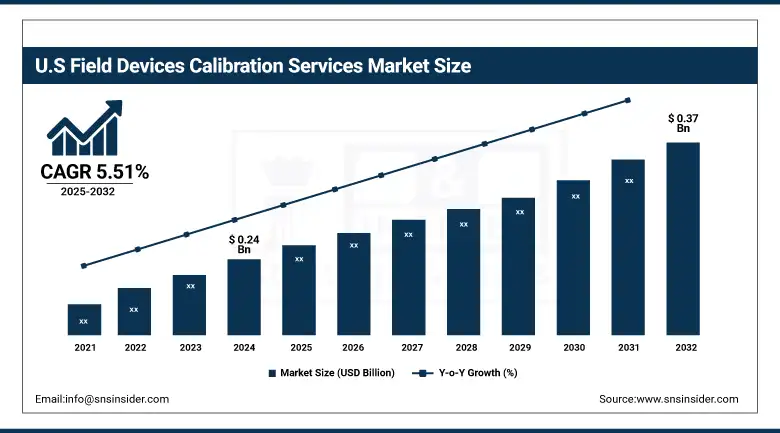
The U.S. field devices calibration services market size was USD 0.24 billion in 2024 and is expected to reach USD 0.37 billion by 2032, growing at a CAGR of 5.51% over the forecast period of 2025–2032. The country’s advanced industrial infrastructure and strict regulatory mandates. The growing reliance on precision in sectors such as oil & gas, pharmaceuticals, and manufacturing leads to an increased demand for calibration services. This results in the U.S. dominating the North American market, driven by early adoption of automation technologies and firm compliance frameworks that enhance operational accuracy and reduce equipment-related discrepancies.

Market Dynamics

Key Drivers:

  • Industrial Automation Growth Across Global Markets Drives Demand for High-Accuracy Field Device Calibration Services Market Growth

The widespread adoption of industrial automation in sectors such as oil & gas, energy, chemicals, food processing, and pharmaceuticals. As manufacturers implement automated systems, they increasingly depend on field devices like pressure gauges, flow meters, and temperature sensors for precise control and compliance. In May 2025, several multinational manufacturing groups launched unified calibration programs to meet cross-border regulatory standards, reflecting the growing global focus on accuracy and traceability. This shift has accelerated service demand for calibration providers that can ensure consistent equipment performance across international operations.

As a direct effect, calibration services are now being integrated into maintenance schedules as mandatory, rather than optional. Global companies are seeking providers with multi-country capabilities to avoid compliance risks, especially in regions with stringent safety protocols. The increased need for device standardization, paired with automation growth, continues to expand the global market, positioning calibration services as an operational necessity in modern industrial environments.

Restraints:

  • High Capital Investment and Lack of Skilled Technicians Restrict Market Entry and Global Service Scalability

One of the major restraints limiting the global Field Devices Calibration Services Market is the high initial investment required to establish certified calibration labs and mobile service units. This includes the cost of sophisticated calibration instruments, controlled environments, and accreditation procedures. In parallel, the shortage of qualified and certified calibration technicians worldwide creates a workforce bottleneck. These two factors combined prevent many smaller or regional service providers from expanding operations, limiting market access in developing and underserved regions.

As a consequence, the market becomes dominated by larger players with strong financial backing, leaving industrial clients in emerging economies with fewer choices and longer service delays. This uneven global coverage increases risk for industries relying on consistent device accuracy for regulatory compliance and production safety. Without adequate investment or workforce expansion, the pace of global market growth slows, even as demand for calibration continues to rise due to automation and regulatory pressure.

Opportunities:

  • Digital Calibration Platforms and IoT Integration Create New Growth Opportunities in Emerging and Developed Markets globally

The global Field Devices Calibration Services Market is seeing a major opportunity emerge through the integration of digital calibration platforms and IoT-enabled field devices. These technologies allow remote monitoring, real-time performance diagnostics, and cloud-based calibration data tracking, transforming how services are delivered and managed. In October 2024, smart calibration software was launched across Asia and Europe, enabling industrial clients to remotely track calibration schedules and receive alerts for deviations in measurement accuracy. This innovation significantly reduces equipment downtime, lowers operational costs, and enhances traceability.

As a result, calibration services are shifting toward subscription-based digital models, appealing to clients in both developed and emerging regions. Providers that adopt this technology gain a competitive edge by offering faster, data-driven calibration solutions across multiple geographic zones. The growing preference for connected systems creates a favorable environment for scalable, remote calibration services, accelerating global market adoption and expanding the reach of providers who embrace digital transformation.

Challenges:

  • Balancing In-Lab Accuracy with Field Flexibility Remains a Core Challenge for Global Calibration Providers

A persistent challenge in the global Field Devices Calibration Services Market is the difficulty of maintaining precision while offering flexible service delivery. In-lab calibration allows for highly controlled conditions and maximum accuracy, but transporting devices to laboratories causes downtime and logistical complications. On the other hand, on-site calibration improves speed and convenience but may compromise precision due to environmental interference or limited toolsets. This trade-off creates an operational dilemma for service providers trying to meet diverse customer demands.

Globally, companies expect fast service with uncompromised accuracy, especially in high-risk sectors like aviation, energy, and pharmaceuticals. Calibration providers must therefore invest in portable, high-precision equipment and continuously train mobile technicians to uphold quality standards. Striking this balance remains a challenge, especially in regions with limited infrastructure or harsh operating conditions. This operational tension hinders the scalability and efficiency of service delivery, making it one of the most critical challenges in the global calibration market landscape.

Segmentation Analysis:

By Type

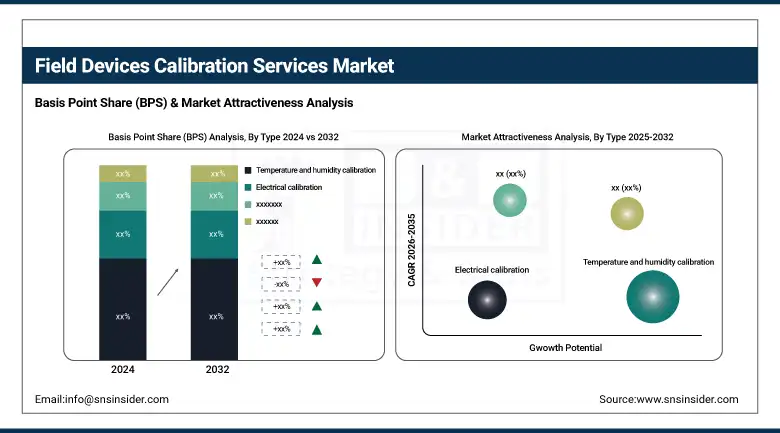
The temperature and humidity calibration segment dominates with 39% revenue share in 2024 due to its essential role in sectors like pharmaceuticals and food processing. Demand for tightly controlled environmental conditions drives the calibration of sensors and devices. This high dependency causes frequent recalibration needs, expanding service demand. The introduction of precision thermal chambers and real-time monitoring tools further boosts segment growth. As industries tighten compliance requirements, this segment significantly influences the overall Field Devices Calibration Services Market by ensuring measurement integrity and regulatory conformity.

Pressure calibration is expanding at a CAGR of 8.97% due to rising demand in the energy, aerospace, and automotive sectors. This growth results from the increasing use of pressure sensors in critical operations where failure can be catastrophic. The development of portable digital pressure calibrators and pressure controller automation enhances calibration speed and accuracy. These innovations drive segment growth by reducing downtime and improving device reliability. Consequently, this fast growth accelerates innovation and competitive offerings in the broader Field Devices Calibration Services Market.

By Industries

Process industries account for 63% of global revenue in 2024 due to continuous production cycles and strict quality controls. Industries like oil & gas, chemical, and power generation require consistent calibration of flow, temperature, and pressure devices to maintain operational integrity. New-generation multi-sensor calibration platforms allow batch verification, enhancing productivity. This reliance drives frequent calibration cycles, reinforcing this segment’s dominant position. Its scale and compliance demand significantly shape the Field Devices Calibration Services Market’s stability and long-term service needs.

Discrete industries are expanding at a CAGR of 8.27% due to increased automation in electronics and automotive manufacturing. These industries demand high-precision calibration for component assembly and robotic systems. As automated lines become standard, device calibration frequency rises to maintain output quality. Product developments like robotic arm sensor calibration kits have simplified service execution, making calibration more scalable. This trend boosts market expansion and creates strong momentum for tailored calibration service models across the Field Devices Calibration Services Market.

By End-User

The oil and gas sector leads with 27% revenue share in 2024 due to its reliance on calibrated instruments for pressure, flow, and level monitoring in high-risk environments. Regular calibration mitigates safety hazards and ensures compliance with international standards. The development of explosion-proof calibration units enhances in-field operations. This end-user segment demands rigorous and repeated calibration, fueling consistent revenue for service providers. Its operational scale and regulatory sensitivity make it a central pillar in the Field Devices Calibration Services Market.

Pharmaceuticals and biotechnology are growing at a CAGR of 10.29% as global regulatory standards tighten. These industries require precise environmental and fluid calibration for drug development and bioprocessing. Innovations like automated cleanroom-compatible calibration tools enable seamless integration into GMP environments. Increased investment in R&D facilities and vaccine production fuels demand. This segment’s fast-paced calibration needs contribute significantly to driving technological upgrades and quality-focused solutions in the Field Devices Calibration Services Market.

By Calibration Method

Manual calibration dominates with 72% market share in 2024 due to its flexibility and technician-led precision across various device types. Many sectors still prefer hands-on calibration for complex or sensitive instruments where automation may fall short. Toolkits and portable devices support diverse field conditions. This method remains vital in emerging markets with limited digital infrastructure. Its continued dominance highlights the enduring value of skilled labor and traditional methods in maintaining quality within the Field Devices Calibration Services Market.

Automated calibration is growing at a CAGR of 8.54% driven by industrial digitization and demand for fast, error-free processes. Automated systems reduce human error and downtime, especially in high-volume environments. Recent product developments like modular automated calibration benches support multi-device testing with data logging. These innovations improve service speed and scalability, especially for large facilities. The segment’s rapid adoption aligns with Industry 4.0, reinforcing digital transformation in the global Field Devices Calibration Services Market.

Regional Analysis:

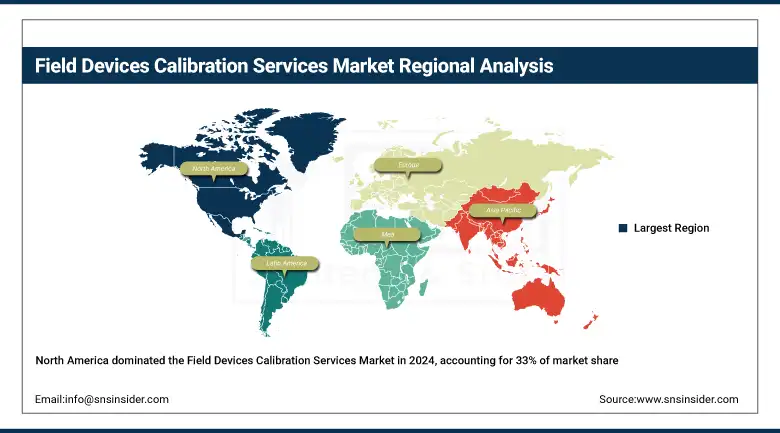
North America held the largest share of the Field Devices Calibration Services Market in 2024, accounting for 33% of global revenue. This dominance is driven by widespread industrial automation, strong enforcement of quality standards, and advanced infrastructure in sectors such as oil & gas, pharmaceuticals, and aerospace. High calibration frequency due to regulatory pressure and safety-critical processes strengthens market penetration. The United States is the dominant country in this region owing to its mature industrial ecosystem, skilled workforce, and continual investment in precision instrumentation and calibration labs across critical manufacturing sectors.

Asia Pacific is the fastest-growing region in the Field Devices Calibration Services Market, with a robust CAGR of 9.02% in 2024. Growth is fueled by rapid industrialization, expanding manufacturing ecosystems, and the increasing need for precision across sectors such as electronics, chemicals, and automotive. The region is also witnessing a rise in government-backed infrastructure and smart factory initiatives. China leads the Asia Pacific market, powered by significant investments in industrial automation, metrology upgrades, and national efforts to enhance quality control across its growing export-oriented industries.

Europe represents a mature and stable share of the market in 2024, supported by strict EU regulatory compliance, strong environmental monitoring frameworks, and demand from the chemical, energy, and automotive sectors. The market is further influenced by rising equipment digitalization and a structured approach to safety protocols. Germany dominates the European market, driven by its leadership in high-end manufacturing, automotive innovation, and strong adherence to international calibration standards, all of which demand consistent, high-accuracy field device calibration services.

The Middle East & Africa and Latin America are witnessing steady growth in the calibration services market, supported by increased activity in oil & gas, power, and infrastructure sectors. In MEA, modernization in petrochemical and energy operations is driving calibration demand, with the UAE emerging as a leader due to its advanced industrial base and push for international compliance. In Latin America, Brazil dominates the region, propelled by growing investment in manufacturing automation and national standards enforcement, which are creating steady demand for professional calibration services.

Key Players:

The Field Devices Calibration Services market companies are Endress+Hauser, Siemens, Yokogawa, ABB, Exova, General Electric (GE), Honeywell, Thermo Fisher Scientific, Rockwell Automation, Fluke Calibration, HiTek, Keysight Technologies, Transcat, Rohde & Schwarz, Branom Instrument Co., Raeco, Pfreundt GmbH, Tektronix, Integrated Service Solutions, Inc., Trescal Group, and Others.

Recent Developments:

  • In 2024, Yokogawa’s European Standards Laboratory launched a new accredited calibration service for AC energy‑measurement devices (up to 40 MWh and 1 kHz), serving industries including automotive, aviation, EV charging, and renewable energy, an extension of its field‑device calibration offerings under ISO 17025 accreditation.

  • In April 2024, at ACHEMA 2024, Endress+Hauser highlighted inline calibration services integrated with digital twins and Ethernet APL, enabling real-time monitoring and calibration of field devices in the chemical and life‑sciences industries.

Field Devices Calibration Services Market Report Scope:

Report Attributes Details
Market Size in 2024 USD 1.20 Billion 
Market Size by 2032 USD 2.10 Billion 
CAGR CAGR of 7.24% From 2025 to 2032
Base Year 2024
Forecast Period 2025-2032
Historical Data 2021-2023
Report Scope & Coverage Market Size, Segments Analysis, Competitive Landscape, Regional Analysis, DROC & SWOT Analysis, Forecast Outlook
Key Segments • By Type (Temperature and Humidity Calibration, Electrical Calibration, Pressure Calibration, Mechanical Calibration)
• By Industries (Process Industries, Discrete Industries)
• By End-User (Healthcare, Automotive, Aerospace and Defense, Oil and Gas, Pharmaceuticals and Biotechnology, Semiconductors, Others)
• By Calibration Method (Manual, Automated)
Regional Analysis/Coverage North America (US, Canada), Europe (Germany, UK, France, Italy, Spain, Russia, Poland, Rest of Europe), Asia Pacific (China, India, Japan, South Korea, Australia, ASEAN Countries, Rest of Asia Pacific), Middle East & Africa (UAE, Saudi Arabia, Qatar, South Africa, Rest of Middle East & Africa), Latin America (Brazil, Argentina, Mexico, Colombia, Rest of Latin America).
Company Profiles Endress+Hauser, Siemens, Yokogawa, ABB, Exova, General Electric (GE), Honeywell, Thermo Fisher Scientific, Rockwell Automation, Fluke Calibration, HiTek, Keysight Technologies, Transcat, Rohde & Schwarz, Branom Instrument Co., Raeco, Pfreundt GmbH, Tektronix, Integrated Service Solutions, Inc., Trescal Group, and Others.

Frequently Asked Questions

Ans: The Field Devices Calibration Services Market is expected to grow at a CAGR of 7.24% during 2025-2032.

Ans: The Field Devices Calibration Services Market size was USD 1.20 billion in 2024 and is expected to reach USD 2.10 billion by 2032.

Ans: The major growth factor of the Field Devices Calibration Services Market is the increasing demand for accurate and reliable measurements in process industries to ensure safety, compliance, and operational efficiency.

Ans: The Temperature and humidity calibration segment dominated the Field Devices Calibration Services Market.

Ans: North America dominated the Field Devices Calibration Services Market in 2024.

Table Of Contents

1. Introduction

1.1 Market Definition & Scope

 1.2 Research Assumptions & Abbreviations

 1.3 Research Methodology

2. Executive Summary

2.1 Market Snapshot

 2.2 Market Absolute $ Opportunity Assessment & Y-o-Y Analysis, 2021–2032

 2.3 Market Size & Forecast, By Segmentation, 2021–2032

  2.3.1 Market Size By End-User

  2.3.2 Market Size By Calibration Method

         2.3.2 Market Size By Industries

         2.3.2 Market Size By Type

 2.4 Market Share & BPS Analysis By Region, 2024

 2.5 Industry Growth Scenarios – Conservative, Likely & Optimistic

 2.6 Industry CxO’s Perspective

3. Market Overview

3.1 Market Dynamics

  3.1.1 Drivers

  3.1.2 Restraints

  3.1.3 Opportunities

  3.1.4 Key Market Trends

 3.2 Industry PESTLE Analysis

 3.3 Key Industry Forces (Porter’s) Impacting Market Growth

 3.4 Industry Supply Chain Analysis

  3.4.1 Raw Material Suppliers

  3.4.2 Manufacturers

  3.4.3 Distributors/Suppliers

  3.4.4 Customers/End-Users

 3.5 Industry Life Cycle Assessment

 3.6 Parent Market Overview

 3.7 Market Risk Assessment

4. Statistical Insights & Trends Reporting

     4.1 Calibration Performance Metrics

4.1.1 Average calibration interval by device type (pressure, temperature, flow, etc.)

4.1.2 Device accuracy deviation (%) before and after calibration

4.1.3 Time taken per calibration cycle (minutes/device) across key industries

4.1.4 Annual calibration volume handled by third-party service providers

4.1.5 Percentage of field devices operating out of tolerance at time of service

    4.2 Cost & Efficiency Indicators

4.2.1 Average calibration service cost per device by category

4.2.2 Labor cost split: In-house vs. outsourced calibration services (%)

4.2.3 Downtime reduction attributed to scheduled calibration (in hours/month)

4.2.4 Cost savings from automated vs. manual calibration processes (%)

4.2.5 ROI period for in-house calibration equipment investments (months)

    4.3 Compliance & Accreditation Metrics

4.3.1 Share of ISO/IEC 17025-accredited calibration labs globally

4.3.2 Audit pass rate (%) linked to regular calibration programs

4.3.3 Percentage of end-users using traceable calibration services

4.3.4 Regional variance in calibration compliance rates (%)

4.3.5 Penalty cost avoidance due to proactive calibration (% savings/year)

5. Field Devices Calibration Services Market Segmental Analysis & Forecast, By End-User, 2021 – 2032, Value (USD Billion)

5.1 Introduction

 5.2 Healthcare

  5.2.1 Key Trends

  5.2.2 Market Size & Forecast, 2021 – 2032

 5.3 Automotive

  5.3.1 Key Trends

  5.3.2 Market Size & Forecast, 2021 – 2032

 5.4 Aerospace and Defense

  5.4.1 Key Trends

  5.4.2 Market Size & Forecast, 2021 – 2032

     5.5 Oil and Gas

  5.5.1 Key Trends

  5.5.2 Market Size & Forecast, 2021 – 2032

     5.6 Pharmaceuticals and Biotechnology

  5.6.1 Key Trends

  5.6.2 Market Size & Forecast, 2021 – 2032

     5.7 Semiconductors

  5.7.1 Key Trends

  5.7.2 Market Size & Forecast, 2021 – 2032

     5.8 Others

  5.8.1 Key Trends

  5.8.2 Market Size & Forecast, 2021 – 2032

6. Field Devices Calibration Services Market Segmental Analysis & Forecast, By Calibration Method, 2021 – 2032, Value (USD Billion)

    6.1 Introduction

 6.2 Manual

  6.2.1 Key Trends

  6.2.2 Market Size & Forecast, 2021 – 2032

 6.3 Automated

  6.3.1 Key Trends

  6.3.2 Market Size & Forecast, 2021 – 2032

7. Field Devices Calibration Services Market Segmental Analysis & Forecast, By Type, 2021 – 2032, Value (USD Billion)

    7.1 Introduction

 7.2 Temperature and humidity calibration

  7.2.1 Key Trends

  7.2.2 Market Size & Forecast, 2021 – 2032

 7.3 Electrical calibration

  7.3.1 Key Trends

  7.3.2 Market Size & Forecast, 2021 – 2032

 7.4 Pressure calibration

  7.4.1 Key Trends

  7.4.2 Market Size & Forecast, 2021 – 2032

 7.5 Mechanical calibration

  7.5.1 Key Trends

  7.5.2 Market Size & Forecast, 2021 – 2032

8. Field Devices Calibration Services Market Segmental Analysis & Forecast, By Industries, 2021 – 2032, Value (USD Billion)

    8.1 Introduction

 8.2 Process industries

  8.2.1 Key Trends

  8.2.2 Market Size & Forecast, 2021 – 2032

 8.3 Discrete industries

  8.3.1 Key Trends

  8.3.2 Market Size & Forecast, 2021 – 2032

9. Field Devices Calibration Services Market Segmental Analysis & Forecast By Region, 2021 – 2025, Value (USD Billion)

9.1 Introduction

9.2 North America

 9.2.1 Key Trends

 9.2.2 Field Devices Calibration Services Market Size & Forecast, By End-User, 2021 – 2032

 9.2.3 Field Devices Calibration Services Market Size & Forecast, By Calibration Method, 2021 – 2032

 9.2.4 Field Devices Calibration Services Market Size & Forecast, By Type, 2021 – 2032

 9.2.5 Field Devices Calibration Services Market Size & Forecast, By Industries, 2021 – 2032

 9.2.6 Field Devices Calibration Services Market Size & Forecast, By Country, 2021 – 2032

  9.2.6.1 USA

   9.2.6.1.1 Field Devices Calibration Services Market Size & Forecast, By End-User, 2021 – 2032

   9.2.6.1.2 Field Devices Calibration Services Market Size & Forecast, By Calibration Method, 2021 – 2032

   9.2.6.1.3 Field Devices Calibration Services Market Size & Forecast, By Type, 2021 – 2032

   9.2.6.1.4 Field Devices Calibration Services Market Size & Forecast, By Industries, 2021 – 2032

  9.2.6.2 Canada

   9.2.6.2.1 Field Devices Calibration Services Market Size & Forecast, By End-User, 2021 – 2032

   9.2.6.2.2 Field Devices Calibration Services Market Size & Forecast, By Calibration Method, 2021 – 2032

   9.2.6.2.3 Field Devices Calibration Services Market Size & Forecast, By Type, 2021 – 2032

   9.2.6.2.4 Field Devices Calibration Services Market Size & Forecast, By Industries, 2021 – 2032

9.3 Europe

 9.3.1 Key Trends

 9.3.2 Field Devices Calibration Services Market Size & Forecast, By End-User, 2021 – 2032

 9.3.3 Field Devices Calibration Services Market Size & Forecast, By Calibration Method, 2021 – 2032

 9.3.4 Field Devices Calibration Services Market Size & Forecast, By Type, 2021 – 2032

 9.3.5 Field Devices Calibration Services Market Size & Forecast, By Industries, 2021 – 2032

 9.3.6 Field Devices Calibration Services Market Size & Forecast, By Country, 2021 – 2032

  9.3.6.1 Germany

   9.3.6.1.1 Field Devices Calibration Services Market Size & Forecast, By End-User, 2021 – 2032

   9.3.6.1.2 Field Devices Calibration Services Market Size & Forecast, By Calibration Method, 2021 – 2032

   9.3.6.1.3 Field Devices Calibration Services Market Size & Forecast, By Type, 2021 – 2032

   9.3.6.1.4 Field Devices Calibration Services Market Size & Forecast, By Industries, 2021 – 2032

  9.3.6.2 UK

   9.3.6.2.1 Field Devices Calibration Services Market Size & Forecast, By End-User, 2021 – 2032

   9.3.6.2.2 Field Devices Calibration Services Market Size & Forecast, By Calibration Method, 2021 – 2032

   9.3.6.2.3 Field Devices Calibration Services Market Size & Forecast, By Type, 2021 – 2032

   9.3.6.2.4 Field Devices Calibration Services Market Size & Forecast, By Industries, 2021 – 2032

  9.3.6.3 France

   9.3.6.3.1 Field Devices Calibration Services Market Size & Forecast, By End-User, 2021 – 2032

   9.3.6.3.2 Field Devices Calibration Services Market Size & Forecast, By Calibration Method, 2021 – 2032

   9.3.6.3.3 Field Devices Calibration Services Market Size & Forecast, By Type, 2021 – 2032

   9.3.6.3.4 Field Devices Calibration Services Market Size & Forecast, By Industries, 2021 – 2032

  9.3.6.4 Italy

   9.3.6.4.1 Field Devices Calibration Services Market Size & Forecast, By End-User, 2021 – 2032

   9.3.6.4.2 Field Devices Calibration Services Market Size & Forecast, By Calibration Method, 2021 – 2032

   9.3.6.4.3 Field Devices Calibration Services Market Size & Forecast, By Type, 2021 – 2032

   9.3.6.4.4 Field Devices Calibration Services Market Size & Forecast, By Industries, 2021 – 2032

  9.3.6.5 Spain

   9.3.6.5.1 Field Devices Calibration Services Market Size & Forecast, By End-User, 2021 – 2032

   9.3.6.5.2 Field Devices Calibration Services Market Size & Forecast, By Calibration Method, 2021 – 2032

   9.3.6.5.3 Field Devices Calibration Services Market Size & Forecast, By Type, 2021 – 2032

   9.3.6.5.4 Field Devices Calibration Services Market Size & Forecast, By Industries, 2021 – 2032

  9.3.6.6 Russia

   9.3.6.6.1 Field Devices Calibration Services Market Size & Forecast, By End-User, 2021 – 2032

   9.3.6.6.2 Field Devices Calibration Services Market Size & Forecast, By Calibration Method, 2021 – 2032

   9.3.6.6.3 Field Devices Calibration Services Market Size & Forecast, By Type, 2021 – 2032

   9.3.6.6.4 Field Devices Calibration Services Market Size & Forecast, By Industries, 2021 – 2032

  9.3.6.7 Poland

   9.3.6.7.1 Field Devices Calibration Services Market Size & Forecast, By End-User, 2021 – 2032

   9.3.6.7.2 Field Devices Calibration Services Market Size & Forecast, By Calibration Method, 2021 – 2032

   9.3.6.7.3 Field Devices Calibration Services Market Size & Forecast, By Type, 2021 – 2032

   9.3.6.7.4 Field Devices Calibration Services Market Size & Forecast, By Industries, 2021 – 2032

  9.3.6.8 Rest of Europe

   9.3.6.8.1 Field Devices Calibration Services Market Size & Forecast, By End-User, 2021 – 2032

   9.3.6.8.2 Field Devices Calibration Services Market Size & Forecast, By Calibration Method, 2021 – 2032

   9.3.6.8.3 Field Devices Calibration Services Market Size & Forecast, By Type, 2021 – 2032

   9.3.6.8.4 Field Devices Calibration Services Market Size & Forecast, By Industries, 2021 – 2032   

9.4 Asia-Pacific

 9.4.1 Key Trends

 9.4.2 Field Devices Calibration Services Market Size & Forecast, By End-User, 2021 – 2032

 9.4.3 Field Devices Calibration Services Market Size & Forecast, By Calibration Method, 2021 – 2032

 9.4.4 Field Devices Calibration Services Market Size & Forecast, By Type, 2021 – 2032

 9.4.5 Field Devices Calibration Services Market Size & Forecast, By Industries, 2021 – 2032

 9.4.6 Field Devices Calibration Services Market Size & Forecast, By Country, 2021 – 2032

  9.4.6.1 China

   9.4.6.1.1 Field Devices Calibration Services Market Size & Forecast, By End-User, 2021 – 2032

   9.4.6.1.2 Field Devices Calibration Services Market Size & Forecast, By Calibration Method, 2021 – 2032

   9.4.6.1.3 Field Devices Calibration Services Market Size & Forecast, By Type, 2021 – 2032

   9.4.6.1.4 Field Devices Calibration Services Market Size & Forecast, By Industries, 2021 – 2032

  9.4.6.2 India

   9.4.6.2.1 Field Devices Calibration Services Market Size & Forecast, By End-User, 2021 – 2032

   9.4.6.2.2 Field Devices Calibration Services Market Size & Forecast, By Calibration Method, 2021 – 2032

   9.4.6.2.3 Field Devices Calibration Services Market Size & Forecast, By Type, 2021 – 2032

   9.4.6.2.4 Field Devices Calibration Services Market Size & Forecast, By Industries, 2021 – 2032

  9.4.6.3 Japan

   9.4.6.3.1 Field Devices Calibration Services Market Size & Forecast, By End-User, 2021 – 2032

   9.4.6.3.2 Field Devices Calibration Services Market Size & Forecast, By Calibration Method, 2021 – 2032

   9.4.6.3.3 Field Devices Calibration Services Market Size & Forecast, By Type, 2021 – 2032

   9.4.6.3.4 Field Devices Calibration Services Market Size & Forecast, By Industries, 2021 – 2032

  9.4.6.4 South Korea

   9.4.6.4.1 Field Devices Calibration Services Market Size & Forecast, By End-User, 2021 – 2032

   9.4.6.4.2 Field Devices Calibration Services Market Size & Forecast, By Calibration Method, 2021 – 2032

   9.4.6.4.3 Field Devices Calibration Services Market Size & Forecast, By Type, 2021 – 2032

   9.4.6.4.4 Field Devices Calibration Services Market Size & Forecast, By Industries, 2021 – 2032

  9.4.6.5 Australia

   9.4.6.5.1 Field Devices Calibration Services Market Size & Forecast, By End-User, 2021 – 2032

   9.4.6.5.2 Field Devices Calibration Services Market Size & Forecast, By Calibration Method, 2021 – 2032

   9.4.6.5.3 Field Devices Calibration Services Market Size & Forecast, By Type, 2021 – 2032

   9.4.6.5.4 Field Devices Calibration Services Market Size & Forecast, By Industries, 2021 – 2032

  9.4.6.6 ASEAN Countries

   9.4.6.6.1 Field Devices Calibration Services Market Size & Forecast, By End-User, 2021 – 2032

   9.4.6.6.2 Field Devices Calibration Services Market Size & Forecast, By Calibration Method, 2021 – 2032

   9.4.6.6.3 Field Devices Calibration Services Market Size & Forecast, By Type, 2021 – 2032

   9.4.6.6.4 Field Devices Calibration Services Market Size & Forecast, By Industries, 2021 – 2032

  9.4.6.7 Rest of Asia-Pacific

   9.4.6.7.1 Field Devices Calibration Services Market Size & Forecast, By End-User, 2021 – 2032

   9.4.6.7.2 Field Devices Calibration Services Market Size & Forecast, By Calibration Method, 2021 – 2032

   9.4.6.7.3 Field Devices Calibration Services Market Size & Forecast, By Type, 2021 – 2032

   9.4.6.7.4 Field Devices Calibration Services Market Size & Forecast, By Industries, 2021 – 2032

9.5 Latin America

 9.5.1 Key Trends

 9.5.2 Field Devices Calibration Services Market Size & Forecast, By End-User, 2021 – 2032

 9.5.3 Field Devices Calibration Services Market Size & Forecast, By Calibration Method, 2021 – 2032

 9.5.4 Field Devices Calibration Services Market Size & Forecast, By Type, 2021 – 2032

 9.5.5 Field Devices Calibration Services Market Size & Forecast, By Industries, 2021 – 2032

 9.5.6 Field Devices Calibration Services Market Size & Forecast, By Country, 2021 – 2032

  9.5.6.1 Brazil

   9.5.6.1.1 Field Devices Calibration Services Market Size & Forecast, By End-User, 2021 – 2032

   9.5.6.1.2 Field Devices Calibration Services Market Size & Forecast, By Calibration Method, 2021 – 2032

   9.5.6.1.3 Field Devices Calibration Services Market Size & Forecast, By Type, 2021 – 2032

   9.5.6.1.4 Field Devices Calibration Services Market Size & Forecast, By Industries, 2021 – 2032

  9.5.6.2 Argentina

   9.5.6.2.1 Field Devices Calibration Services Market Size & Forecast, By End-User, 2021 – 2032

   9.5.6.2.2 Field Devices Calibration Services Market Size & Forecast, By Calibration Method, 2021 – 2032

   9.5.6.2.3 Field Devices Calibration Services Market Size & Forecast, By Type, 2021 – 2032

   9.5.6.2.4 Field Devices Calibration Services Market Size & Forecast, By Industries, 2021 – 2032

  9.5.6.3 Mexico

   9.5.6.3.1 Field Devices Calibration Services Market Size & Forecast, By End-User, 2021 – 2032

   9.5.6.3.2 Field Devices Calibration Services Market Size & Forecast, By Calibration Method, 2021 – 2032

   9.5.6.3.3 Field Devices Calibration Services Market Size & Forecast, By Type, 2021 – 2032

   9.5.6.3.4 Field Devices Calibration Services Market Size & Forecast, By Industries, 2021 – 2032

  9.5.6.4 Colombia

   9.5.6.4.1 Field Devices Calibration Services Market Size & Forecast, By End-User, 2021 – 2032

   9.5.6.4.2 Field Devices Calibration Services Market Size & Forecast, By Calibration Method, 2021 – 2032

   9.5.6.4.3 Field Devices Calibration Services Market Size & Forecast, By Type, 2021 – 2032

   9.5.6.4.4 Field Devices Calibration Services Market Size & Forecast, By Industries, 2021 – 2032

  9.5.6.5 Rest of Latin America

   9.5.6.5.1 Field Devices Calibration Services Market Size & Forecast, By End-User, 2021 – 2032

   9.5.6.5.2 Field Devices Calibration Services Market Size & Forecast, By Calibration Method, 2021 – 2032

   9.5.6.5.3 Field Devices Calibration Services Market Size & Forecast, By Type, 2021 – 2032

   9.5.6.5.4 Field Devices Calibration Services Market Size & Forecast, By Industries, 2021 – 2032

9.6 Middle East & Africa

 9.6.1 Key Trends

 9.6.2 Field Devices Calibration Services Market Size & Forecast, By End-User, 2021 – 2032

 9.6.3 Field Devices Calibration Services Market Size & Forecast, By Calibration Method, 2021 – 2032

 9.6.4 Field Devices Calibration Services Market Size & Forecast, By Type, 2021 – 2032

 9.6.5 Field Devices Calibration Services Market Size & Forecast, By Industries, 2021 – 2032

 9.6.6 Field Devices Calibration Services Market Size & Forecast, By Country, 2021 – 2032

  9.6.6.1 UAE

   9.6.6.1.1 Field Devices Calibration Services Market Size & Forecast, By End-User, 2021 – 2032

   9.6.6.1.2 Field Devices Calibration Services Market Size & Forecast, By Calibration Method, 2021 – 2032

   9.6.6.1.3 Field Devices Calibration Services Market Size & Forecast, By Type, 2021 – 2032

   9.6.6.1.4 Field Devices Calibration Services Market Size & Forecast, By Industries, 2021 – 2032

  9.6.6.2 Saudi Arabia

   9.6.6.2.1 Field Devices Calibration Services Market Size & Forecast, By End-User, 2021 – 2032

   9.6.6.2.2 Field Devices Calibration Services Market Size & Forecast, By Calibration Method, 2021 – 2032

   9.6.6.2.3 Field Devices Calibration Services Market Size & Forecast, By Type, 2021 – 2032

   9.6.6.2.4 Field Devices Calibration Services Market Size & Forecast, By Industries, 2021 – 2032

  9.6.6.3 Qatar

   9.6.6.3.1 Field Devices Calibration Services Market Size & Forecast, By End-User, 2021 – 2032

   9.6.6.3.2 Field Devices Calibration Services Market Size & Forecast, By Calibration Method, 2021 – 2032

   9.6.6.3.3 Field Devices Calibration Services Market Size & Forecast, By Type, 2021 – 2032

   9.6.6.3.4 Field Devices Calibration Services Market Size & Forecast, By Industries, 2021 – 2032

  9.6.6.4 Egypt

   9.6.6.4.1 Field Devices Calibration Services Market Size & Forecast, By End-User, 2021 – 2032

   9.6.6.4.2 Field Devices Calibration Services Market Size & Forecast, By Calibration Method, 2021 – 2032

   9.6.6.4.3 Field Devices Calibration Services Market Size & Forecast, By Type, 2021 – 2032

   9.6.6.4.4 Field Devices Calibration Services Market Size & Forecast, By Industries, 2021 – 2032

  9.6.6.5 South Africa

   9.6.6.5.1 Field Devices Calibration Services Market Size & Forecast, By End-User, 2021 – 2032

   9.6.6.5.2 Field Devices Calibration Services Market Size & Forecast, By Calibration Method, 2021 – 2032

   9.6.6.5.3 Field Devices Calibration Services Market Size & Forecast, By Type, 2021 – 2032

   9.6.6.5.4 Field Devices Calibration Services Market Size & Forecast, By Industries, 2021 – 2032

  9.6.6.6 Rest of Middle East & Africa

   9.6.6.6.1 Field Devices Calibration Services Market Size & Forecast, By End-User, 2021 – 2032

   9.6.6.6.2 Field Devices Calibration Services Market Size & Forecast, By Calibration Method, 2021 – 2032

   9.6.6.6.3 Field Devices Calibration Services Market Size & Forecast, By Type, 2021 – 2032

   9.6.6.6.4 Field Devices Calibration Services Market Size & Forecast, By Industries, 2021 – 2032

10. Competitive Landscape

 10.1 Key Players' Positioning

 10.2 Competitive Developments

  10.2.1 Key Strategies Adopted (%), By Key Players, 2024

  10.2.2 Year-Wise Strategies & Development, 2021 – 2025

  10.2.3 Number Of Strategies Adopted By Key Players, 2024

 10.3 Market Share Analysis, 2024

 10.4 Product/Service & Application Benchmarking

  10.4.1 Product/Service Specifications & Features By Key Players

  10.4.2 Product/Service Heatmap By Key Players

  10.4.3 Application Heatmap By Key Players

 10.5 Industry Start-Up & Innovation Landscape

 10.6 Key Company Profiles

10.6 Key Company Profiles

 10.6.1 Endress+Hauser

  10.6.1.1 Company Overview & Snapshot

  10.6.1.2 Product/Service Portfolio

  10.6.1.3 Key Company Financials

  10.6.1.4 SWOT Analysis

 10.6.2 Siemens

  10.6.2.1 Company Overview & Snapshot

  10.6.2.2 Product/Service Portfolio

  10.6.2.3 Key Company Financials

  10.6.2.4 SWOT Analysis

 10.6.3 Yokogawa

  10.6.3.1 Company Overview & Snapshot

  10.6.3.2 Product/Service Portfolio

  10.6.3.3 Key Company Financials

  10.6.3.4 SWOT Analysis

 10.6.4 ABB

  10.6.4.1 Company Overview & Snapshot

  10.6.4.2 Product/Service Portfolio

  10.6.4.3 Key Company Financials

  10.6.4.4 SWOT Analysis

 10.6.5 Exova

  10.6.5.1 Company Overview & Snapshot

  10.6.5.2 Product/Service Portfolio

  10.6.5.3 Key Company Financials

  10.6.5.4 SWOT Analysis

 10.6.6 General Electric (GE)

  10.6.6.1 Company Overview & Snapshot

  10.6.6.2 Product/Service Portfolio

  10.6.6.3 Key Company Financials

  10.6.6.4 SWOT Analysis

 10.6.7 Honeywell

  10.6.7.1 Company Overview & Snapshot

  10.6.7.2 Product/Service Portfolio

  10.6.7.3 Key Company Financials

  10.6.7.4 SWOT Analysis

 10.6.8 Thermo Fisher Scientific

  10.6.8.1 Company Overview & Snapshot

  10.6.8.2 Product/Service Portfolio

  10.6.8.3 Key Company Financials

  10.6.8.4 SWOT Analysis

 10.6.9 Rockwell Automation

  10.6.9.1 Company Overview & Snapshot

  10.6.9.2 Product/Service Portfolio

  10.6.9.3 Key Company Financials

  10.6.9.4 SWOT Analysis

 10.6.10 Fluke Calibration

  10.6.10.1 Company Overview & Snapshot

  10.6.10.2 Product/Service Portfolio

  10.6.10.3 Key Company Financials

  10.6.10.4 SWOT Analysis

 10.6.11 HiTek

  10.6.11.1 Company Overview & Snapshot

  10.6.11.2 Product/Service Portfolio

  10.6.11.3 Key Company Financials

  10.6.11.4 SWOT Analysis

 10.6.12 Transcat

  10.6.12.1 Company Overview & Snapshot

  10.6.12.2 Product/Service Portfolio

  10.6.12.3 Key Company Financials

  10.6.12.4 SWOT Analysis

 10.6.13 Keysight Technologies

  10.6.13.1 Company Overview & Snapshot

  10.6.13.2 Product/Service Portfolio

  10.6.13.3 Key Company Financials

  10.6.13.4 SWOT Analysis

 10.6.14 Rohde & Schwarz

  10.6.14.1 Company Overview & Snapshot

  10.6.14.2 Product/Service Portfolio

  10.6.14.3 Key Company Financials

  10.6.14.4 SWOT Analysis

 10.6.15 Branom Instrument Co.

  10.6.15.1 Company Overview & Snapshot

  10.6.15.2 Product/Service Portfolio

  10.6.15.3 Key Company Financials

  10.6.15.4 SWOT Analysis

 10.6.16 Raeco

  10.6.16.1 Company Overview & Snapshot

  10.6.16.2 Product/Service Portfolio

  10.6.16.3 Key Company Financials

  10.6.16.4 SWOT Analysis

 10.6.17 Pfreundt GmbH

  10.6.17.1 Company Overview & Snapshot

  10.6.17.2 Product/Service Portfolio

  10.6.17.3 Key Company Financials

  10.6.17.4 SWOT Analysis

 10.6.18 Tektronix

  10.6.18.1 Company Overview & Snapshot

  10.6.18.2 Product/Service Portfolio

  10.6.18.3 Key Company Financials

  10.6.18.4 SWOT Analysis

 10.6.19 Integrated Service Solutions, Inc.

  10.6.19.1 Company Overview & Snapshot

  10.6.19.2 Product/Service Portfolio

  10.6.19.3 Key Company Financials

  10.6.19.4 SWOT Analysis

 10.6.20 Trescal Group

  10.6.20.1 Company Overview & Snapshot

  10.6.20.2 Product/Service Portfolio

  10.6.20.3 Key Company Financials

  10.6.20.4 SWOT Analysis

11. Analyst Recommendations

 11.1 SNS Insider Opportunity Map

 11.2 Industry Low-Hanging Fruit Assessment

 11.3 Market Entry & Growth Strategy

 11.4 Analyst Viewpoint & Suggestions On Market Growth

12. Assumptions

13. Disclaimer

14. Appendix

 14.1 List Of Tables

 14.2 List Of Figures

An accurate research report requires proper strategizing as well as implementation. There are multiple factors involved in the completion of good and accurate research report and selecting the best methodology to compete the research is the toughest part. Since the research reports we provide play a crucial role in any company’s decision-making process, therefore we at SNS Insider always believe that we should choose the best method which gives us results closer to reality. This allows us to reach at a stage wherein we can provide our clients best and accurate investment to output ratio.

Each report that we prepare takes a timeframe of 350-400 business hours for production. Starting from the selection of titles through a couple of in-depth brain storming session to the final QC process before uploading our titles on our website we dedicate around 350 working hours. The titles are selected based on their current market cap and the foreseen CAGR and growth.


The 5 steps process:

Step 1: Secondary Research:

Secondary Research or Desk Research is as the name suggests is a research process wherein, we collect data through the readily available information. In this process we use various paid and unpaid databases which our team has access to and gather data through the same. This includes examining of listed companies’ annual reports, Journals, SEC filling etc. Apart from this our team has access to various associations across the globe across different industries. Lastly, we have exchange relationships with various university as well as individual libraries.

Secondary Research

Step 2: Primary Research

When we talk about primary research, it is a type of study in which the researchers collect relevant data samples directly, rather than relying on previously collected data.  This type of research is focused on gaining content specific facts that can be sued to solve specific problems. Since the collected data is fresh and first hand therefore it makes the study more accurate and genuine.

We at SNS Insider have divided Primary Research into 2 parts.

Part 1 wherein we interview the KOLs of major players as well as the upcoming ones across various geographic regions. This allows us to have their view over the market scenario and acts as an important tool to come closer to the accurate market numbers. As many as 45 paid and unpaid primary interviews are taken from both the demand and supply side of the industry to make sure we land at an accurate judgement and analysis of the market.

This step involves the triangulation of data wherein our team analyses the interview transcripts, online survey responses and observation of on filed participants. The below mentioned chart should give a better understanding of the part 1 of the primary interview.

Primary Research

Part 2: In this part of primary research the data collected via secondary research and the part 1 of the primary research is validated with the interviews from individual consultants and subject matter experts.

Consultants are those set of people who have at least 12 years of experience and expertise within the industry whereas Subject Matter Experts are those with at least 15 years of experience behind their back within the same space. The data with the help of two main processes i.e., FGDs (Focused Group Discussions) and IDs (Individual Discussions). This gives us a 3rd party nonbiased primary view of the market scenario making it a more dependable one while collation of the data pointers.

Step 3: Data Bank Validation

Once all the information is collected via primary and secondary sources, we run that information for data validation. At our intelligence centre our research heads track a lot of information related to the market which includes the quarterly reports, the daily stock prices, and other relevant information. Our data bank server gets updated every fortnight and that is how the information which we collected using our primary and secondary information is revalidated in real time.

Data Bank Validation

Step 4: QA/QC Process

After all the data collection and validation our team does a final level of quality check and quality assurance to get rid of any unwanted or undesired mistakes. This might include but not limited to getting rid of the any typos, duplication of numbers or missing of any important information. The people involved in this process include technical content writers, research heads and graphics people. Once this process is completed the title gets uploader on our platform for our clients to read it.

Step 5: Final QC/QA Process:

This is the last process and comes when the client has ordered the study. In this process a final QA/QC is done before the study is emailed to the client. Since we believe in giving our clients a good experience of our research studies, therefore, to make sure that we do not lack at our end in any way humanly possible we do a final round of quality check and then dispatch the study to the client.

Key Segments: 

By Type

  • Temperature and humidity calibration

  • Electrical calibration

  • Pressure calibration

  • Mechanical calibration

By Industries

  • Process industries

  • Discrete industries

By End-User

  • Healthcare

  • Automotive

  • Aerospace and Defense

  • Oil and Gas

  • Pharmaceuticals and Biotechnology

  • Semiconductors

  • Others

By Calibration Method

  • Manual

  • Automated

Request for Segment Customization as per your Business Requirement: Segment Customization Request

Regional Coverage: 

North America

  • US

  • Canada

Europe

  • Germany

  • France

  • UK

  • Italy

  • Spain

  • Poland

  • Russia

  • Rest of Europe

Asia Pacific

  • China

  • India

  • Japan

  • South Korea

  • Australia

  • ASEAN Countries

  • Rest of Asia Pacific

Middle East & Africa

  • UAE

  • Saudi Arabia

  • Qatar

  • South Africa

  • Rest of Middle East & Africa

Latin America

  • Brazil

  • Argentina

  • Mexico

  • Colombia

  • Rest of Latin America

Request for Country Level Research Report: Country Level Customization Request

Available Customization 

With the given market data, SNS Insider offers customization as per the company’s specific needs. The following customization options are available for the report: 

  • Detailed Volume Analysis 

  • Criss-Cross segment analysis (e.g. Product X Application) 

  • Competitive Product Benchmarking 

  • Geographic Analysis 

  • Additional countries in any of the regions 

  • Customized Data Representation 

  • Detailed analysis and profiling of additional market players

Explore Key Insights.


  • Analyzes market trends, forecasts, and regional dynamics
  • Covers core offerings, innovations, and industry use cases
  • Profiles major players, value chains, and strategic developments
  • Highlights innovation trends, regulatory impacts, and growth opportunities
Request an Analyst Call