Flotation Reagents Market Report Scope & Overview:
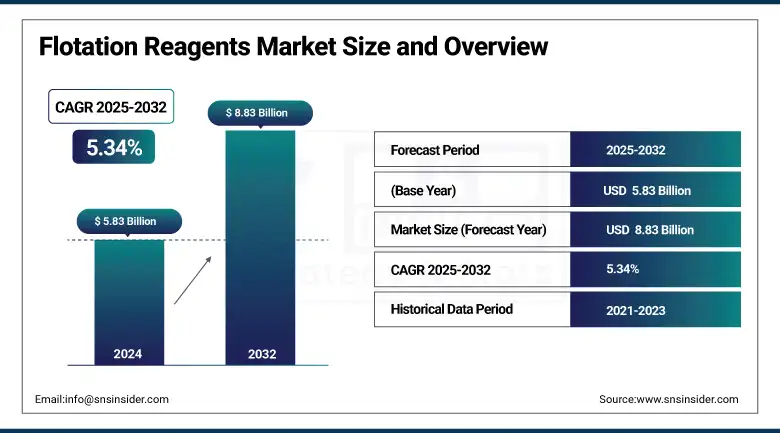
The Flotation Reagents Market size was valued at USD 5.83 billion in 2024 and is expected to reach USD 8.83 billion by 2032, growing at a CAGR of 5.34% over the forecast period of 2025-2032.
The flotation reagents market is rapidly expanding because of the sustainable transformation of froth flotation chemicals, hybrid reagents, and digital optimizations of minerals. One of the largest flotation reagent suppliers, SNF FloMin, partnered with Mitsubishi Chemical to create polymer-based mineral processing reagents. Orica's use of the Integrated Extraction Simulator is limited to the transformative sample purchases, demonstrating digital progress within the flotation reagent market trends. The regulation of flotation reagent types is delicately evolving with the regulations for water treatment processes.
To Get more information On Flotation Reagents Market - Request Free Sample Report
In the U.S., approximately 34 billion gallons of contaminated water are treated every day, contributing to the increase in flotation reagents market share within the environmental sector.
In Australia, the Water Services Association's phase-out of PFAS contributes to downstream flotation trends towards less toxic, generally safer chemistry. These developments and regulations support market players growing their flotation reagents market share. We can expect the market size to continue to demonstrate higher distribution from sophisticated applications due to the higher investments across mining and water treatment, real-time monitoring, and sustainability performance indicators across flow sheets.
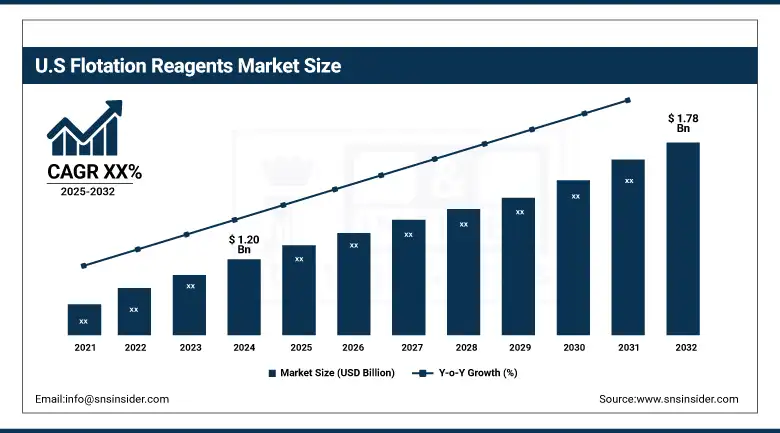
The U.S. has a 68% market share as the dominant country. Large-scale mining operations as well as stringent EPA regulations do promote the adoption of sustainable froth flotation chemicals, and the market size is anticipated to reach USD 1.78 billion by 2032 from USD 1.20 billion in 2024. Per the U.S. Geological Survey, domestic copper and molybdenum mines used over 400,000 tons of flotation reagents. Investment from major flotation reagents companies such as Orica and SNF FloMin has been attracted by digital reagent management systems.
Flotation Reagents Market Drivers:
-
Increasing demand for eco-friendly froth flotation chemicals in sustainable mining practices
The increasing focus on sustainable mining on a worldwide basis has driven demand for environmentally friendly froth flotation chemicals, thus leading to innovation in biodegradable and low-toxic flotation reagent types. As per regulations from the U.S. Environmental Protection Agency (EPA), regulations related to chemical discharge from mining effluents have tightened, resulting in flotation reagents companies working to develop greener mineral processing reagents. This trend is contributing substantially to the flotation reagents market growth as mining companies want to lessen their environmental impacts while maintaining operational effectiveness, globally increasing the flotation reagents market size.
-
Rising water & wastewater treatment requirements drive flotation reagents market trends globally
As water treatment regulations become more stringent across the world, the demand for flotation reagents in wastewater applications is increasing. According to the U.S. Geological Survey, over 34 billion gallons of industrial wastewater are treated every day, which relies on specialty froth flotation products. The increasing demand for effective mineral processing reagents for use in water treatment practices is driving flotation reagents market trends in developed countries, as they spend considerable amounts of money implementing sustainable water management practices.
Flotation Reagents Market Restraints:
-
Complex regulatory frameworks across regions delay new flotation reagents market entries
In major markets such as North America and Europe, the variety and strength of environmental regulations can lead to delays in the approval process for new types of flotation reagents. The United States Environmental Protection Agency (EPA) and the European Chemicals Agency (ECHA) have extensive testing and compliance obligations, which extend the flotation reagents market assessment and commercial timelines. It is the regulatory burden of lengthy assessment periods that restricts potential flotation reagent markets from expanding rapidly because of the extensive resources required to comply with regulations.
Flotation Reagents Market Segmentation Analysis:
By Type
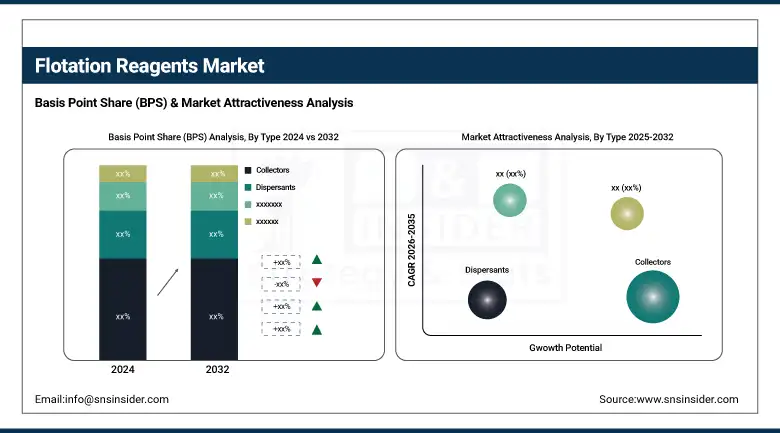
The collectors type segment dominated the flotation reagents market in 2024, holding a 36.0% share owing to collectors’ critical role in recovering hydrophobic particles, including their use in sulfide ore flotation. According to the U.S. Geological Survey, collectors like xanthates are still widely in use for gold, copper, and zinc processing. Companies like Solvay and Clariant continue to run collector expansions, supporting more than 950 mining operations around the world, supporting our claim that collectors are the main flotation reagent type due to their efficacy and reliability as mineral processing reagents.
Moreover, frothers are the fastest-growing segment with the highest CAGR of 6.13% during the forecast period of 2025 to 2032, as a result of increased demand in rare earth and lithium extraction. Polyglycols, as well as alcohol-based frothers, are froth flotation chemicals that have further improved bubble stability, showing encouraging results for ultra-fine coal flotation. Frother use has grown steadily in advanced mineral flotation circuits, as reported by Australia's Department of Industry, Mines and Resources. Frother manufacturers are investing effort to develop biodegradable applications for their products, which will continue to support flotation reagents market trends and growth internationally.
By Application
Mineral processing dominated and held the largest flotation reagents market share in 2024 at 57.2%, supported by the continuous increase in global demand for metals like copper, zinc, and rare earths. The US Department of Energy detailed the growing reliance on flotation reagent types for ore beneficiation to increase recovery rates. SNF FloMin and Orica, flotation reagent companies, advertise their customized mineral processing reagents by ore, so, to maximize their ultra-beneficial applications in both high-capacity plants, and this has confirmed this application as the leading candidate in flotation reagents market analysis.
Water & wastewater treatment is the fastest-growing application segment with the highest CAGR of 6.01% during the forecast period of 2025 to 2032. The growth is driven by global environmental regulations. As noted by the U.S. Geological Survey, the United States has over 34 billion gallons of wastewater that is treated every day, which is creating demand for unique flotation reagent types. As government regulations are made to limit the amount of per- and polyfluoroalkyl substances (PFAS) in industrial effluent, there will be a shift in the froth flotation chemicals toward greener alternatives. This will create an opportunity for new products in a growing flotation reagents market as companies seize opportunities to gain a foothold in the future industrial water treatment landscape.
Flotation Reagents Market Regional Outlook:
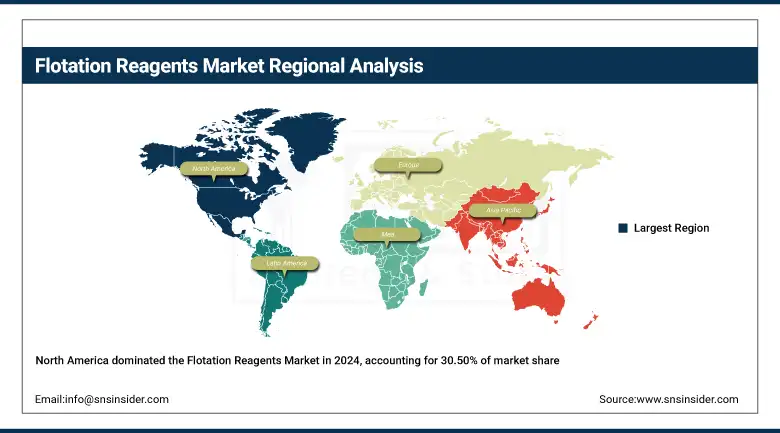
North America in 2024 dominated the flotation reagents market because high ore throughput, plus advanced mineral processing technologies, drove a 30.50% market share. In 2024,
Get Customized Report as per Your Business Requirement - Enquiry Now
Europe ranked third within the flotation reagents market in 2024 with a stable 21.0% share expected through 2032. Strict EU chemical safety rules cause expansion. So, does demand exist for types of green flotation reagents in industrial mineral processing? Because of its mining sector's technological advancement, Germany dominates the region. The European Chemicals Agency (ECHA) supports low-toxicity mineral processing reagents as it encourages innovations from companies like Solvay and Clariant, which respond with biodegradable froth flotation chemicals that allow sustainable operations.
Asia Pacific held a 25.30% share in the flotation reagents market in 2024 and is the fastest-growing region due to surging mineral extraction and battery metal demand. Because of extensive coal and rare earth mining, China leads in volume. The Australian Department of Industry reports that in 2023, the use of flotation reagents based on lithium rose by 18%. To support the growth of the flotation reagents market and regional trends, flotation reagent companies are investing heavily in the region and expanding their manufacturing and research and development facilities.
The market for flotation reagents is expanding in Latin America due to increased gold and copper mining in Chile and Peru. Due to the widespread use of collectors and frothers in sulfide ore flotation, Chile is the dominant nation. According to the Chilean Copper Commission, new mine developments were the primary cause of a 12% increase in reagent consumption in 2023. In order to supply customized mineral processing reagents and take advantage of advantageous mining regulations and growing project pipelines, multinational flotation reagent companies are establishing local partnerships.
The growing phosphate and copper mining in Morocco, South Africa, and Zambia is driving the flotation reagents market expansion in the Middle East and Africa region. Morocco rules the region thanks to the significant phosphate production of the OCP Group. Morocco's Ministry of Energy reports that the demand for reagents increased by 10% in 2023. Eco-friendly froth flotation chemicals are being pushed for by environmental reforms in mining jurisdictions throughout Africa. In order to create sustainable flotation reagent types for compliant mineral processing operations, regional flotation reagent companies are collaborating with global players.
Flotation Reagents Market Companies are:
The major flotation reagents market competitors include SNF FloMin, Orica Limited – Mining Chemicals Division, Chengdu Kexin Mining Chemicals Co., Ltd., Boda Mining Chemicals Co., Ltd., Linhai Tianhe Chemicals Co., Ltd., Niraj Chemicals Pvt. Ltd., Qingdao Haitongda Chemical Co., Ltd., Kairong Chemical Co., Ltd., Wanpeng Mining Chemicals Co., Ltd., and Xiamen Humei Chemical Co., Ltd.
Recent Developments:
-
In July 2024, BASF sold its mining flocculants business to Solenis, transferring assets in Australia, South Africa, and the U.S. to focus on core flotation reagents and streamline mining operations.
-
In October 2023, BASF launched Luproset and Luprofroth as new flotation reagent brands to simplify product selection and strengthen its innovation focus in sustainable mineral processing chemicals.
| Report Attributes | Details |
|---|---|
| Market Size in 2024 | USD 5.83 billion |
| Market Size by 2032 | USD 8.83 billion |
| CAGR | CAGR of 5.34% From 2025 to 2032 |
| Base Year | 2024 |
| Forecast Period | 2025-2032 |
| Historical Data | 2021-2023 |
| Report Scope & Coverage | Market Size, Segments Analysis, Competitive Landscape, Regional Analysis, DROC & SWOT Analysis, Forecast Outlook |
| Key Segments | •By Type (Flocculants, Frothers, Collectors, Dispersants, Others) •By Application (Water & Wastewater Treatment, Explosives & Drilling, Mineral Processing, Others) |
| Regional Analysis/Coverage | North America (US, Canada, Mexico), Europe (Germany, France, UK, Italy, Spain, Poland, Turkey, Rest of Europe), Asia Pacific (China, India, Japan, South Korea, Singapore, Australia, Rest of Asia Pacific), Middle East & Africa (UAE, Saudi Arabia, Qatar, South Africa, Rest of Middle East & Africa), Latin America (Brazil, Argentina, Rest of Latin America) |
| Company Profiles | SNF FloMin, Orica Limited – Mining Chemicals Division, Chengdu Kexin Mining Chemicals Co., Ltd., Boda Mining Chemicals Co., Ltd., Linhai Tianhe Chemicals Co., Ltd., Niraj Chemicals Pvt. Ltd., Qingdao Haitongda Chemical Co., Ltd., Kairong Chemical Co., Ltd., Wanpeng Mining Chemicals Co., Ltd., and Xiamen Humei Chemical Co., Ltd. |
Frequently Asked Questions
SNF FloMin and Orica lead the flotation reagents market by investing in sustainable polymer reagents and digital simulation technologies.
North America held a 30.50% flotation reagents market share in 2024 due to EPA regulations and extensive mining operations in the U.S.
Frothers are the fastest-growing flotation reagent type with a 6.13% CAGR, supported by rising rare earth and fine-particle recovery needs.
Collectors dominated the flotation reagents market in 2024 with a 36.0% share due to their high efficiency in sulfide ore flotation processes.
The flotation reagents market size in 2024 was valued at USD 5.83 billion, driven by strong demand in the mining and water treatment industries.
Get in Touch
