Composites Market Report Scope & Overview:

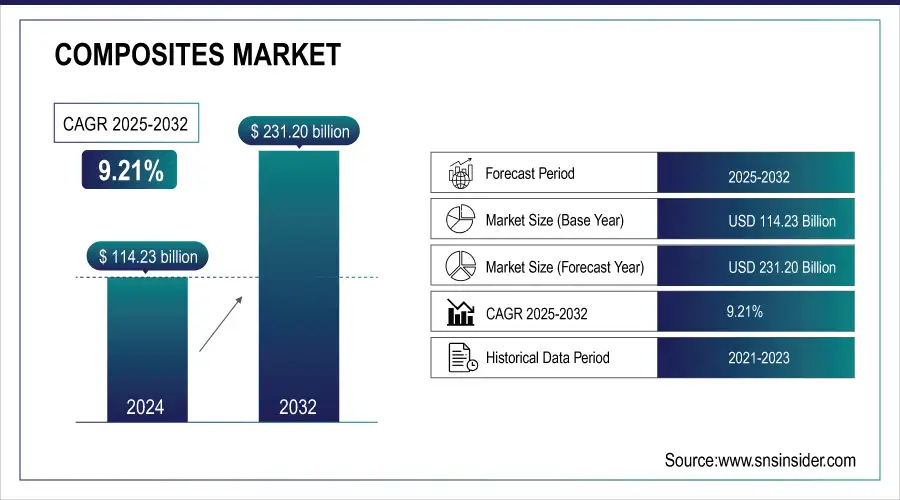
The Composites Market Size was valued at USD 114.23 Billion in 2024 and is expected to reach USD 231.20 Billion by 2032, growing at a CAGR of 9.21% over 2025-2032. The composites market is emerging across numerous sectors, like in the automotive industry, composites pave the way for lighter vehicles. This translates to significant benefits to improved fuel efficiency and reduced emissions, at the top for consumers and environmental regulations. As manufacturers raise the operating cost driven by the fuel economy, demand for composites is expected to soar. 

Composites-Market Revenue Analysis

Get more information on Composites Market - Request Sample Report

The U.S. Department of Energy highlights that reducing vehicle weight by 10% can improve fuel efficiency by 6-8%. Composite materials help automakers meet stringent emission standards, such as the EU's 2030 CO2 targets for passenger cars, which require a 37.5% reduction compared to 2021.

Glass fiber materials and the industries related to construction, and infrastructure are progressively gaining attention for their longevity power of fragility as well as optimization in terms of price because environmental degradation is economically attractive for composite production. Glass fiber composites, which are of high strength-to-weight ratio and corrosion-resistant, are becoming an important component in constructing durable infrastructure.

For instance, Owens Corning initiated a strategic review of its Glass Reinforcements (GR) business in February 2024. This move aims to strengthen the company's focus on sustainable building materials. Owens Corning’s GR business, which generates significant revenue, supplies advanced glass fiber products for applications in infrastructure and other markets, showcasing the growing emphasis on durable and cost-efficient composites for construction projects.

Composites-Market-US

Composites Market Size and Forecast:

  • Market Size in 2024 – USD 114.23 Billion

  • Market Size by 2032 – USD 231.20 Billion

  • CAGR – 9.2% from 2025 to 2032

  • Base Year – 2024

  • Forecast Period – 2025 to 2032

  • Historical Data – 2021 to 2023

Key Composites Market Trends

  • Rising adoption of lightweight composites in automotive and aerospace sectors

  • Increasing demand for sustainable and recyclable composite materials

  • Advancements in high-performance thermoplastic composites

  • Growing use of composites in renewable energy, especially wind turbine blades

  • Expansion of 3D printing and additive manufacturing of composite materials

  • Integration of smart composites with sensors for structural health monitoring

  • Shift towards cost-efficient manufacturing techniques like automated fiber placement (AFP) and resin transfer molding (RTM)

Composites Market Drivers:

  • Growing demand for lightweight materials in the composites market drives the market growth.

One of the most important triggers for growth in end-user industries is the increased need for lightweight materials, which is among the major driving forces of the composites market. Composites (carbon fiber, glass fiber reinforced polymers) are stronger by weight than steel or aluminum. As a result, they are very attractive for automotive and aerospace applications since reduced vehicle and aircraft mass convert directly to fuel economy gain and emission reductions. Factors such as strict emission regulations in markets like Europe or North America have imposed additional incentives for the use of lightweight composites.

In construction, such materials allow for strong but lightweight structures so that logistical concerns and installation costs remain manageable. The decreased weight of composite blades improves energy efficiency in renewable energy applications, particularly wind turbine production. Consumer demand for sustainable products has also played a role in stimulating the innovation of bio-based lightweight composites. Such innovations are in line with global sustainability objectives, like carbon neutrality targets from governments around the world. Driven by the need for well-positioned lightweight materials through a lucrative composites market as industries focus on efficiency, sustainability, and regulations change the demand is sure to grow leading to expected innovation and expansion in various applications.

Composites Market Restraints:

  • Lack of standardization and manufacturing processes for the composites market hamper the market growth.

Developing and manufacturing composite products often involve significant non-recurring expenses. Unlike established materials, composites require investments in specialized techniques and tooling, which can be a barrier for some industries. The lack of standardized processes and material properties for composites creates uncertainty for manufacturers. This can lead to difficulties in maintaining consistent quality and hinders the development of efficient mass production methods in critical sectors like automotive and aerospace.  Furthermore, the absence of established standards discourages the exploration of composites for new applications, pushing manufacturers to stick with familiar, traditional materials.

Composites Market Opportunities:

  • Carbon fiber is becoming increasingly popular for CNG and hydrogen storage due to its superior properties and it raises the opportunity.

The overuse of the term CNG (Compressed Natural Gas) and hydrogen storage systems is attributable to carbon fiber's superior properties including high strength-to-weight ratio, corrosion resistance, and capability for sustaining high pressures. Therefore, it is the perfect material for gas storage (as CNG or hydrogen) that requires that sort of container. The weight of traditional metal tanks is considerably more than that of composite ones, which minimizes the overall weight burden on the system and makes it more economical and energy-efficient. Such a lightweight property is particularly crucial in transportation because the weight of fuel storage systems affects both vehicle performance and fuel economy. The corrosion-resistance property of carbon fiber will also increase the service life of the tanks, significantly decreasing maintenance needs and increasing storage system safety.

Composites Market Segment Analysis:
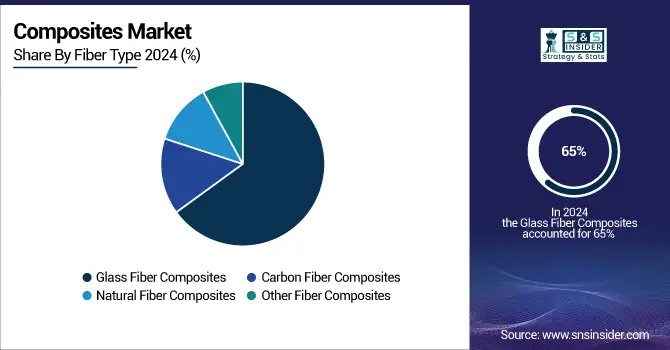
By Fiber Type

In 2024, the Composites Market is dominated by the Glass fiber composites sub-segment with a market share of more than 65%. Its wide appeal can be attributed to the unique combination of strength, stiffness, and lightness. Another point that makes glass fiber equally ideal for use in composites is its high impact resistance. combination of carbon fiber and plastic resin gives us a polymer called carbon fiber reinforced polymer. It is widely used in the making of aircraft, inside and outside the plane. CFRP composites have high strength while at the same time, they are very lightweight especially when produced as sandwich structures. That means more fuel-efficient, less maintenance-intensive engines that meet stringent environmental regulations in Europe and North America, a win-win for aircraft OEMs.

Composites-Market-By-Fiber-Type

By Manufacturing Process

The Lay-up sub-segment dominated the composites market in 2024, It is projected to capture a revenue share of 40%. This dominance is expected to continue due to its growing use in manufacturing boats, wind turbine blades, and architectural moldings. This method allows for creating a wide range of shapes and sizes for composite products at a lower cost. From marine prototypes to storage tanks, wet layup finds application in diverse end-uses.  This technique utilizes prepregs, which are per-impregnated fibers containing cured resin. These fibers are then molded under high heat and pressure within a cavity.

By End-Use

The s Automotive &Transportation has dominated the composites market having the highest revenue share accounting for 25.0% in 2024 among end-use industry-wise segmentation. Composites are entering a variety of transport modes, from cars to trucks, trailers, buses, trains, subways, and motorcycles. Because they represent a unique ratio between value and esotericism, providing strong lightness (and boasting quite the compromise to metals), this makes it such an attractive alternative. While this reduction in weight does not equate to the same stiffness, composites can match and even exceed metals in strength by volume, which allows manufacturers to build lighter parts. As a result, the transportation industry can expect several benefits.

Composites Market Regional Analysis:

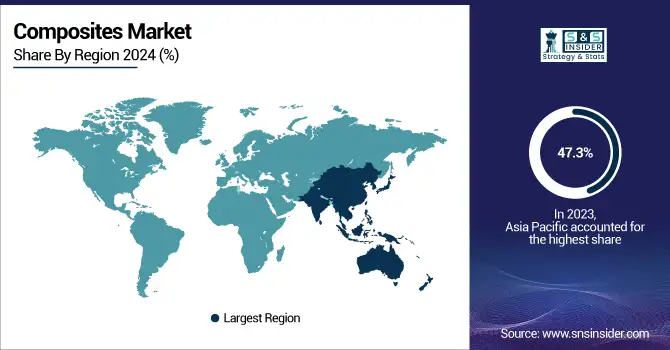
Asia Pacific Composites Market Insights

The Asia Pacific region dominated the composites market which held over 47.3% share of global demand in 2024. This dominance is poised to continue with significant projected growth in the coming years.  Several factors contribute to Asia Pacific's attractiveness for manufacturers across industries like automotive, construction, aerospace, and electronics. Major economies like China, India, and Japan boast a strong presence of key composite manufacturers, The US market focuses on the automotive industry's growing appetite for lightweight materials. Additionally, factors like rising electrical & electronics production capacity and steady growth in automotive and aerospace sectors are expected to propel further industry expansion in the forecast period.

North America Composites Market Insights

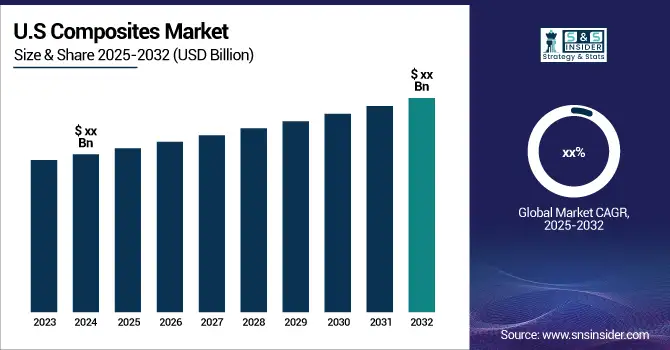
North America composites market is strong in 2024 and high in aerospace, automotive and wind energy applications. The United States is the leading investor; large auto-manufacturers are investing heavily in lightweight and high-performance materials to enhance fuel economy and sustainability. While rising use of electric vehicles and renewables further solidifies the composites market position in the region.

Europe Composites Market Insights

Composites market in Europe remains a significant region through 2024 due to the stringent environmental regulations and the rising focus on lightweight materials in automotive and aerospace sectors. The demand is led by the German, French, and U.K. markets, and use of composites for the region’s renewable energy applications, especially wind installations, accounts for a major use of composites. In European markets a key driver of growth is sustainability centric innovation.

Latin America Composites Market Insights

In 2024, the LAM composites market is growing at a steady pace with increasing demand by the construction, transportation and energy markets. Brazil and Mexico are leading growth amid infrastructure development and rising use of composites in car making. Rising emphasis of the region in applications demanding cost-effective and long-lasting materials, such as in industrial applications, is also contributing in the demand growth of the market.

Middle East & Africa Composites Market Insights

MEA composites industry size in 2024, is mainly driven by developing commercial as well as residential structures and growing application in oil & gas industry. Meanwhile, Gulf countries like Saudi Arabia and the United Arab Emirates are adopting advanced materials for their construction projects for urban development and for building their renewable energy (wind especially) projects. Increasing industrialization and demand for high strength and corrosion-resistant materials are among the major drivers of market growth in the region.

Composites-Market-By-Regions.

Get Customized Report as per your Business Requirement - Request For Customized Report

Competitive Landscape for Composites Market

Owens Corning, established in 1938 and headquartered in the United States, is a global leader in building and industrial materials. The company specializes in insulation, roofing, and fiberglass composites, serving construction, transportation, and renewable energy sectors. Owens Corning focuses on sustainable, innovative solutions to improve energy efficiency, durability, and performance worldwide.

  • In February 2024, Owens Corning solidified its position in the building and construction materials industry through a USD 3.9 billion acquisition of Masonite, a strategic move that also strengthens its glass reinforcement business within the Composites segment.

Solvay – Founded in 1863 in Belgium, Solvay is a global chemical and materials company specializing in advanced polymers, composites, and specialty chemicals. Serving industries such as aerospace, automotive, electronics, and energy, Solvay emphasizes sustainability and innovation, delivering high-performance solutions that enhance efficiency, safety, and environmental responsibility worldwide.

Spirit AeroSystems – Established in 2005 and headquartered in the United States, Spirit AeroSystems is one of the world’s largest manufacturers of aerostructures. The company designs and produces fuselages, wings, propulsion components, and other advanced aerospace systems. It serves major commercial, defense, and business aviation markets with a focus on quality and innovation.

  • In February 2023, Solvay and Spirit AeroSystems joined forces to advance sustainable aircraft technologies and processes. The collaboration focuses on joint research with industry, academic, and supply chain partners, accelerating innovation in lightweight and eco-friendly aerospace composites.

Composites Market Key Players:

  • Teijin Ltd. (Tenax, Teijin Carbon)

  • Toray Industries, Inc. (Torayca, T300)

  • Owens Corning (Corning Advantex, Corning Thor)

  • PPG Industries, Inc. (PPG Fiber Glass, PPG 1250)

  • Huntsman Corporation LLC (Araldite, Rigidex)

  • SGL Group (SIGRAFIL, SGL Automotive Composites)

  • Hexcel Corporation (HexPly, HexWeb)

  • DuPont (Kevlar, Tyvek)

  • Compagnie de Saint-Gobain S.A. (Bostic, Lamicote)

  • Weyerhaeuser Company (TruWood, FiberBond)

  • Momentive Performance Materials, Inc. (Momentive TufRok, Momentive Silicones)

  • Cytec Industries (Solvay, S.A.) (Cycom, MTM)

  • China Jushi Co., Ltd. (Jushi Glass Fiber, Jushi E-glass)

  • Kineco Limited (Kineco Composite Materials, Kineco Pultrusion)

  • Veplas Group (Veplas Bending Composites, Veplas Resin Systems)

  • BASF (MALON, Malepox)

  • Dow (MA/MAI Resin, DURABAK)

  • Lanxess (Araldit, Laromin)

  • Mitsubishi Chemical Corporation (Durable Carbon Fiber, MCT Resin)

  • Formosa Plastics Corporation (Formosa Composites, PVC Resin)

Composites Market Report Scope:

Report Attributes Details
Market Size in 2024 USD 114.23 Billion
Market Size by 2032 USD 231.20 Billion
CAGR CAGR of 9.2% From 2025 to 2032
Base Year 2024
Forecast Period 2025-2032
Historical Data 2021-2023
Report Scope & Coverage Market Size, Segments Analysis, Competitive  Landscape, Regional Analysis, DROC & SWOT Analysis, Forecast Outlook
Key Segments •By Fiber Type (Glass Fiber Composites, Carbon Fiber Composites, Natural Fiber Composites, Other Fiber Composites)
•By Resin Type (Thermoset Composites, Thermoplastic  Composites)
•By end-use industry (Aerospace & defense,Wind Energy, Automotive & Transportation, Constr, ction & Infrastructure, Marine, Pipe & Tan, Electrical & Electronics, Others)
Regional Analysis/Coverage North America (US, Canada), Europe (Germany, France, UK, Italy, Spain, Poland, Russsia, Rest of Europe), Asia Pacific (China, India, Japan, South Korea, Australia,ASEAN Countries, Rest of Asia Pacific), Middle East & Africa (UAE, Saudi Arabia, Qatar, Egypt, South Africa, Rest of Middle East & Africa), Latin America (Brazil, Argentina,    Mexico,     Colombia Rest of Latin America)
Company Profiles Solvay (Belgium), Hexion (US), Toray Industries Inc. (Japan), Jushi Group Co., Ltd (China), Hexcel Corporation (US), Owens Corning (US), Teijin Limited (Japan), PPG Industries, Inc. (US), SGL Carbon (Germany), Mitsubishi Chemicals Corporation (Japan), Huntsman International LLC (US).Weyerhaeuser Company

Table Of Contents

1. Introduction

1.1 Market Definition & Scope

 1.2 Research Assumptions & Abbreviations

 1.3 Research Methodology

2. Executive Summary

2.1 Market Snapshot

 2.2 Market Absolute $ Opportunity Assessment & Y-o-Y Analysis, 2021–2032

 2.3 Market Size & Forecast, By Segmentation, 2021–2032

  2.3.1 Market Size By Fiber Type

  2.3.2 Market Size By Manufacturing Process

  2.3.3 Market Size By End-Use Industry

 2.4 Market Share & Bps Analysis By Region, 2024

 2.5 Industry Growth Scenarios – Conservative, Likely & Optimistic

 2.6 Industry CxO’s Perspective

3. Market Overview

3.1 Market Dynamics

  3.1.1 Drivers

  3.1.2 Restraints

  3.1.3 Opportunities

  3.1.4 Key Market Trends

 3.2 Industry PESTLE Analysis

 3.3 Key Industry Forces (Porter’s) Impacting Market Growth

 3.4 Industry Supply Chain Analysis

  3.4.1 Raw Material Suppliers

  3.4.2 Manufacturers

  3.4.3 Distributors/Suppliers

  3.4.4 Customers/End-Users

 3.5 Industry Life Cycle Assessment

 3.6 Parent Market Overview

 3.7 Market Risk Assessment

4. Statistical Insights & Trends Reporting

4.1 Market Volume & Production Metrics

 4.1.1 Global Composite Production Volume by Material Type (Carbon Fiber, Glass Fiber, Natural Fiber, Others).

 4.1.2 Regional Production Capacity and Utilization Rates.

 4.1.3 Average Fiber-to-Resin Ratio in Composite Manufacturing.

 4.1.4 Export–Import Statistics of Composite Materials by Key Countries.

4.2 Material & Performance Metrics

 4.2.1 Market Share by Matrix Type (Polymer Matrix, Metal Matrix, Ceramic Matrix).

 4.2.2 Strength-to-Weight Ratio Benchmarks across Composite Types.

 4.2.3 Thermal Resistance & Durability Metrics for High-performance Applications.

 4.2.4 Lifecycle and Replacement Frequency of Composite Products in End-use Industries.

4.3 Cost & Economic Indicators

 4.3.1 Average Selling Price (ASP) of Composites by Fiber Type.

 4.3.2 Cost Breakdown – Raw Materials, Processing, and Tooling.

 4.3.3 Total Cost of Ownership (TCO) for Composite-based Components.

 4.3.4 Price Sensitivity to Resin and Fiber Raw Material Fluctuations.

4.4 Supply Chain & Manufacturing Metrics

 4.4.1 Supplier Concentration Ratio for Key Raw Materials (Fibers, Resins, Additives).

 4.4.2 Lead Times for Composite Processing Equipment.

 4.4.3 Manufacturing Yield Rates and Scrap Ratios.

 4.4.4 Geographic Distribution of Key Composite Production Facilities.

5. Composites Market Segmental Analysis & Forecast, By Fiber Type, 2021 – 2032, Value (USD Billion)

5.1 Introduction

 5.2 Glass Fiber Composites

  5.2.1 Key Trends

  5.2.2 Market Size & Forecast, 2021 – 2032

 5.3 Carbon Fiber Composites

  5.3.1 Key Trends

  5.3.2 Market Size & Forecast, 2021 – 2032

 5.4 Natural Fiber Composites

  5.4.1 Key Trends

  5.4.2 Market Size & Forecast, 2021 – 2032

 5.5 Other Fiber Composites

  5.5.1 Key Trends

  5.5.2 Market Size & Forecast, 2021 – 2032

6. Composites Market Segmental Analysis & Forecast, By Manufacturing Process, 2021 – 2032, Value (USD Billion)

    6.1 Introduction

 6.2 Lay-up

  6.2.1 Key Trends

  6.2.2 Market Size & Forecast, 2021 – 2032

 6.3 Filament Winding

  6.3.1 Key Trends

  6.3.2 Market Size & Forecast, 2021 – 2032

 6.4 Filament Winding

  6.4.1 Key Trends

  6.4.2 Market Size & Forecast, 2021 – 2032

 6.5 Pultrusion

  6.5.1 Key Trends

  6.5.2 Market Size & Forecast, 2021 – 2032

 6.6 Compression Molding

  6.6.1 Key Trends

  6.6.2 Market Size & Forecast, 2021 – 2032

 6.7 RTM

  6.7.1 Key Trends

  6.7.2 Market Size & Forecast, 2021 – 2032

 6.8 Others

  6.8.1 Key Trends

  6.8.2 Market Size & Forecast, 2021 – 2032

7. Composites Market Segmental Analysis & Forecast, By End-Use Industry, 2021 – 2032, Value (USD Billion)

    7.1 Introduction

 7.2 Aerospace & defense

  7.2.1 Key Trends

  7.2.2 Market Size & Forecast, 2021 – 2032

 7.3 Wind Energy

  7.3.1 Key Trends

  7.3.2 Market Size & Forecast, 2021 – 2032

 7.4 Automotive & Transportation

  7.4.1 Key Trends

  7.4.2 Market Size & Forecast, 2021 – 2032

 7.5 Construction & Infrastructure

  7.5.1 Key Trends

  7.5.2 Market Size & Forecast, 2021 – 2032

 7.6 Marine

  7.6.1 Key Trends

  7.6.2 Market Size & Forecast, 2021 – 2032

 7.7 Pipe

  7.7.1 Key Trends

  7.7.2 Market Size & Forecast, 2021 – 2032

 7.8 Tanks & Pressure Vessels

  7.8.1 Key Trends

  7.8.2 Market Size & Forecast, 2021 – 2032

 7.9 Electrical & Electronics

  7.9.1 Key Trends

  7.9.2 Market Size & Forecast, 2021 – 2032

 7.10 Others

  7.10.1 Key Trends

  7.10.2 Market Size & Forecast, 2021 – 2032

8. Composites Market Segmental Analysis & Forecast By Region, 2021 – 2025, Value (USD Billion)

8.1 Introduction

8.2 North America

 8.2.1 Key Trends

 8.2.2 Composites Market Size & Forecast, By Fiber Type, 2021 – 2032

 8.2.3 Composites Market Size & Forecast, By Manufacturing Process, 2021 – 2032

 8.2.4 Composites Market Size & Forecast, By End-Use Industry, 2021 – 2032

 8.2.5 Composites Market Size & Forecast, By Country, 2021 – 2032

  8.2.5.1 USA

   8.2.5.1.1 Composites Market Size & Forecast, By Fiber Type, 2021 – 2032

   8.2.5.1.2 Composites Market Size & Forecast, By Manufacturing Process, 2021 – 2032

   8.2.5.1.3 Composites Market Size & Forecast, By End-Use Industry, 2021 – 2032

  8.2.5.2 Canada

   8.2.5.2.1 Composites Market Size & Forecast, By Fiber Type, 2021 – 2032

   8.2.5.2.2 Composites Market Size & Forecast, By Manufacturing Process, 2021 – 2032

   8.2.5.2.3 Composites Market Size & Forecast, By End-Use Industry, 2021 – 2032

8.3 Europe

 8.3.1 Key Trends

 8.3.2 Composites Market Size & Forecast, By Fiber Type, 2021 – 2032

 8.3.3 Composites Market Size & Forecast, By Manufacturing Process, 2021 – 2032

 8.3.4 Composites Market Size & Forecast, By End-Use Industry, 2021 – 2032

 8.3.5 Composites Market Size & Forecast, By Country, 2021 – 2032

  8.3.5.1 Germany

   8.3.5.1.1 Composites Market Size & Forecast, By Fiber Type, 2021 – 2032

   8.3.5.1.2 Composites Market Size & Forecast, By Manufacturing Process, 2021 – 2032

   8.3.5.1.3 Composites Market Size & Forecast, By End-Use Industry, 2021 – 2032

  8.3.5.2 UK

   8.3.5.2.1 Composites Market Size & Forecast, By Fiber Type, 2021 – 2032

   8.3.5.2.2 Composites Market Size & Forecast, By Manufacturing Process, 2021 – 2032

   8.3.5.2.3 Composites Market Size & Forecast, By End-Use Industry, 2021 – 2032

  8.3.5.3 France

   8.3.5.3.1 Composites Market Size & Forecast, By Fiber Type, 2021 – 2032

   8.3.5.3.2 Composites Market Size & Forecast, By Manufacturing Process, 2021 – 2032

   8.3.5.3.3 Composites Market Size & Forecast, By End-Use Industry, 2021 – 2032

  8.3.5.4 Italy

   8.3.5.4.1 Composites Market Size & Forecast, By Fiber Type, 2021 – 2032

   8.3.5.4.2 Composites Market Size & Forecast, By Manufacturing Process, 2021 – 2032

   8.3.5.4.3 Composites Market Size & Forecast, By End-Use Industry, 2021 – 2032

  8.3.5.5 Spain

   8.3.5.5.1 Composites Market Size & Forecast, By Fiber Type, 2021 – 2032

   8.3.5.5.2 Composites Market Size & Forecast, By Manufacturing Process, 2021 – 2032

   8.3.5.5.3 Composites Market Size & Forecast, By End-Use Industry, 2021 – 2032

  8.3.5.6 Russia

   8.3.5.6.1 Composites Market Size & Forecast, By Fiber Type, 2021 – 2032

   8.3.5.6.2 Composites Market Size & Forecast, By Manufacturing Process, 2021 – 2032

   8.3.5.6.3 Composites Market Size & Forecast, By End-Use Industry, 2021 – 2032

  8.3.5.7 Poland

   8.3.5.7.1 Composites Market Size & Forecast, By Fiber Type, 2021 – 2032

   8.3.5.7.2 Composites Market Size & Forecast, By Manufacturing Process, 2021 – 2032

   8.3.5.7.3 Composites Market Size & Forecast, By End-Use Industry, 2021 – 2032

  8.3.5.8 Rest of Europe

   8.3.5.8.1 Composites Market Size & Forecast, By Fiber Type, 2021 – 2032

   8.3.5.8.2 Composites Market Size & Forecast, By Manufacturing Process, 2021 – 2032

   8.3.5.8.3 Composites Market Size & Forecast, By End-Use Industry, 2021 – 2032

8.4 Asia-Pacific

 8.4.1 Key Trends

 8.4.2 Composites Market Size & Forecast, By Fiber Type, 2021 – 2032

 8.4.3 Composites Market Size & Forecast, By Manufacturing Process, 2021 – 2032

 8.4.4 Composites Market Size & Forecast, By End-Use Industry, 2021 – 2032

 8.4.5 Composites Market Size & Forecast, By Country, 2021 – 2032

  8.4.5.1 China

   8.4.5.1.1 Composites Market Size & Forecast, By Fiber Type, 2021 – 2032

   8.4.5.1.2 Composites Market Size & Forecast, By Manufacturing Process, 2021 – 2032

   8.4.5.1.3 Composites Market Size & Forecast, By End-Use Industry, 2021 – 2032

  8.4.5.2 India

   8.4.5.2.1 Composites Market Size & Forecast, By Fiber Type, 2021 – 2032

   8.4.5.2.2 Composites Market Size & Forecast, By Manufacturing Process, 2021 – 2032

   8.4.5.2.3 Composites Market Size & Forecast, By End-Use Industry, 2021 – 2032

  8.4.5.3 Japan

   8.4.5.3.1 Composites Market Size & Forecast, By Fiber Type, 2021 – 2032

   8.4.5.3.2 Composites Market Size & Forecast, By Manufacturing Process, 2021 – 2032

   8.4.5.3.3 Composites Market Size & Forecast, By End-Use Industry, 2021 – 2032

  8.4.5.4 South Korea

   8.4.5.4.1 Composites Market Size & Forecast, By Fiber Type, 2021 – 2032

   8.4.5.4.2 Composites Market Size & Forecast, By Manufacturing Process, 2021 – 2032

   8.4.5.4.3 Composites Market Size & Forecast, By End-Use Industry, 2021 – 2032

  8.4.5.5 Australia

   8.4.5.5.1 Composites Market Size & Forecast, By Fiber Type, 2021 – 2032

   8.4.5.5.2 Composites Market Size & Forecast, By Manufacturing Process, 2021 – 2032

   8.4.5.5.3 Composites Market Size & Forecast, By End-Use Industry, 2021 – 2032

  8.4.5.6 ASEAN Countries

   8.4.5.6.1 Composites Market Size & Forecast, By Fiber Type, 2021 – 2032

   8.4.5.6.2 Composites Market Size & Forecast, By Manufacturing Process, 2021 – 2032

   8.4.5.6.3 Composites Market Size & Forecast, By End-Use Industry, 2021 – 2032

  8.4.5.7 Rest of Asia-Pacific

   8.4.5.7.1 Composites Market Size & Forecast, By Fiber Type, 2021 – 2032

   8.4.5.7.2 Composites Market Size & Forecast, By Manufacturing Process, 2021 – 2032

   8.4.5.7.3 Composites Market Size & Forecast, By End-Use Industry, 2021 – 2032

8.5 Latin America

 8.5.1 Key Trends

 8.5.2 Composites Market Size & Forecast, By Fiber Type, 2021 – 2032

 8.5.3 Composites Market Size & Forecast, By Manufacturing Process, 2021 – 2032

 8.5.4 Composites Market Size & Forecast, By End-Use Industry, 2021 – 2032

 8.5.5 Composites Market Size & Forecast, By Country, 2021 – 2032

  8.5.5.1 Brazil

   8.5.5.1.1 Composites Market Size & Forecast, By Fiber Type, 2021 – 2032

   8.5.5.1.2 Composites Market Size & Forecast, By Manufacturing Process, 2021 – 2032

   8.5.5.1.3 Composites Market Size & Forecast, By End-Use Industry, 2021 – 2032

  8.5.5.2 Argentina

   8.5.5.2.1 Composites Market Size & Forecast, By Fiber Type, 2021 – 2032

   8.5.5.2.2 Composites Market Size & Forecast, By Manufacturing Process, 2021 – 2032

   8.5.5.2.3 Composites Market Size & Forecast, By End-Use Industry, 2021 – 2032

  8.5.5.3 Mexico

   8.5.5.3.1 Composites Market Size & Forecast, By Fiber Type, 2021 – 2032

   8.5.5.3.2 Composites Market Size & Forecast, By Manufacturing Process, 2021 – 2032

   8.5.5.3.3 Composites Market Size & Forecast, By End-Use Industry, 2021 – 2032

  8.5.5.4 Colombia

   8.5.5.4.1 Composites Market Size & Forecast, By Fiber Type, 2021 – 2032

   8.5.5.4.2 Composites Market Size & Forecast, By Manufacturing Process, 2021 – 2032

   8.5.5.4.3 Composites Market Size & Forecast, By End-Use Industry, 2021 – 2032

  8.5.5.5 Rest of Latin America

   8.5.5.5.1 Composites Market Size & Forecast, By Fiber Type, 2021 – 2032

   8.5.5.5.2 Composites Market Size & Forecast, By Manufacturing Process, 2021 – 2032

   8.5.5.5.3 Composites Market Size & Forecast, By End-Use Industry, 2021 – 2032

8.6 Middle East & Africa

 8.6.1 Key Trends

 8.6.2 Composites Market Size & Forecast, By Fiber Type, 2021 – 2032

 8.6.3 Composites Market Size & Forecast, By Manufacturing Process, 2021 – 2032

 8.6.4 Composites Market Size & Forecast, By End-Use Industry, 2021 – 2032

 8.6.5 Composites Market Size & Forecast, By Country, 2021 – 2032

  8.6.5.1 UAE

   8.6.5.1.1 Composites Market Size & Forecast, By Fiber Type, 2021 – 2032

   8.6.5.1.2 Composites Market Size & Forecast, By Manufacturing Process, 2021 – 2032

   8.6.5.1.3 Composites Market Size & Forecast, By End-Use Industry, 2021 – 2032

  8.6.5.2 Saudi Arabia

   8.6.5.2.1 Composites Market Size & Forecast, By Fiber Type, 2021 – 2032

   8.6.5.2.2 Composites Market Size & Forecast, By Manufacturing Process, 2021 – 2032

   8.6.5.2.3 Composites Market Size & Forecast, By End-Use Industry, 2021 – 2032

  8.6.5.3 Qatar

   8.6.5.3.1 Composites Market Size & Forecast, By Fiber Type, 2021 – 2032

   8.6.5.3.2 Composites Market Size & Forecast, By Manufacturing Process, 2021 – 2032

   8.6.5.3.3 Composites Market Size & Forecast, By End-Use Industry, 2021 – 2032

  8.6.5.4 Egypt

   8.6.5.4.1 Composites Market Size & Forecast, By Fiber Type, 2021 – 2032

   8.6.5.4.2 Composites Market Size & Forecast, By Manufacturing Process, 2021 – 2032

   8.6.5.4.3 Composites Market Size & Forecast, By End-Use Industry, 2021 – 2032

  8.6.5.5 South Africa

   8.6.5.5.1 Composites Market Size & Forecast, By Fiber Type, 2021 – 2032

   8.6.5.5.2 Composites Market Size & Forecast, By Manufacturing Process, 2021 – 2032

   8.6.5.5.3 Composites Market Size & Forecast, By End-Use Industry, 2021 – 2032

  8.6.5.6 Rest of Middle East & Africa

   8.6.5.6.1 Composites Market Size & Forecast, By Fiber Type, 2021 – 2032

   8.6.5.6.2 Composites Market Size & Forecast, By Manufacturing Process, 2021 – 2032

   8.6.5.6.3 Composites Market Size & Forecast, By End-Use Industry, 2021 – 2032

9. Competitive Landscape

 9.1 Key Players' Positioning

 9.2 Competitive Developments

  9.2.1 Key Strategies Adopted (%), By Key Players, 2024

  9.2.2 Year-Wise Strategies & Development, 2021 – 2025

  9.2.3 Number Of Strategies Adopted By Key Players, 2024

 9.3 Market Share Analysis, 2024

 9.4 Product/Service & Application Benchmarking

  9.4.1 Product/Service Specifications & Features By Key Players

  9.4.2 Product/Service Heatmap By Key Players

  9.4.3 Application Heatmap By Key Players

 9.5 Industry Start-Up & Innovation Landscape

9.6 Key Company Profiles

 9.6.1 Teijin Ltd.

  9.6.1.1 Company Overview & Snapshot

  9.6.1.2 Product/Service Portfolio

  9.6.1.3 Key Company Financials

  9.6.1.4 SWOT Analysis

 9.6.2 Toray Industries, Inc.

 9.6.3 Owens Corning

 9.6.4 PPG Industries, Inc.

 9.6.5 Huntsman Corporation LLC

 9.6.6 SGL Group

 9.6.7 Hexcel Corporation

 9.6.8 DuPont

 9.6.9 Compagnie de Saint-Gobain S.A.

 9.6.10 Weyerhaeuser Company

 9.6.11 Momentive Performance Materials, Inc.

 9.6.12 Cytec Industries (Solvay S.A.)

 9.6.13 China Jushi Co., Ltd.

 9.6.14 Kineco Limited

 9.6.15 Veplas Group

 9.6.16 BASF

 9.6.17 Dow

 9.6.18 Lanxess

 9.6.19 Mitsubishi Chemical Corporation

 9.6.20 Formosa Plastics Corporation

10. Analyst Recommendations

 10.1 SNS Insider Opportunity Map

 10.2 Industry Low-Hanging Fruit Assessment

 10.3 Market Entry & Growth Strategy

 10.4 Analyst Viewpoint & Suggestions On Market Growth

11. Assumptions

12. Disclaimer

13. Appendix

 13.1 List Of Tables

 13.2 List Of Figures

Key Segments:

By Fiber Type

  • Glass Fiber Composites

  • Carbon Fiber Composites

  • Natural Fiber Composites

  • Other Fiber Composites

By Manufacturing Process

  • Lay-up

  • Filament Winding

  • Injection Molding

  • Pultrusion

  • Compression Molding

  • RTM

  • Others

By End-Use Industry

  • Aerospace & defense

  • Wind Energy

  • Automotive & Transportation

  • Construction & Infrastructure

  • Marine

  • Pipe

  • Tanks & Pressure Vessels

  • Electrical & Electronics

  • Others 

Request for Segment Customization as per your Business Requirement: Segment Customization Request

Regional Coverage: 

North America

  • US

  • Canada

Europe

  • Germany

  • UK

  • France

  • Italy

  • Spain

  • Russia

  • Poland

  • Rest of Europe

Asia Pacific

  • China

  • India

  • Japan

  • South Korea

  • ASEAN Countries

  • Australia

  • Rest of Asia Pacific

Latin America

  • Brazil

  • Argentina

  • Mexico

  • Colombia

  • Rest of Latin America

Middle East & Africa

  • UAE

  • Saudi Arabia

  • Qatar

  • Egypt

  • South Africa

  • Rest of Middle East & Africa

Request for Country Level Research Report: Country Level Customization Request

Available Customization 

With the given market data, SNS Insider offers customization as per the company’s specific needs. The following customization options are available for the report: 

  • Detailed Volume Analysis 

  • Criss-Cross segment analysis (e.g. Product X Application) 

  • Competitive Product Benchmarking 

  • Geographic Analysis 

  • Additional countries in any of the regions 

  • Customized Data Representation 

  • Detailed analysis and profiling of additional market players

An accurate research report requires proper strategizing as well as implementation. There are multiple factors involved in the completion of good and accurate research report and selecting the best methodology to compete the research is the toughest part. Since the research reports we provide play a crucial role in any company’s decision-making process, therefore we at SNS Insider always believe that we should choose the best method which gives us results closer to reality. This allows us to reach at a stage wherein we can provide our clients best and accurate investment to output ratio.

Each report that we prepare takes a timeframe of 350-400 business hours for production. Starting from the selection of titles through a couple of in-depth brain storming session to the final QC process before uploading our titles on our website we dedicate around 350 working hours. The titles are selected based on their current market cap and the foreseen CAGR and growth.


The 5 steps process:

Step 1: Secondary Research:

Secondary Research or Desk Research is as the name suggests is a research process wherein, we collect data through the readily available information. In this process we use various paid and unpaid databases which our team has access to and gather data through the same. This includes examining of listed companies’ annual reports, Journals, SEC filling etc. Apart from this our team has access to various associations across the globe across different industries. Lastly, we have exchange relationships with various university as well as individual libraries.

Secondary Research

Step 2: Primary Research

When we talk about primary research, it is a type of study in which the researchers collect relevant data samples directly, rather than relying on previously collected data.  This type of research is focused on gaining content specific facts that can be sued to solve specific problems. Since the collected data is fresh and first hand therefore it makes the study more accurate and genuine.

We at SNS Insider have divided Primary Research into 2 parts.

Part 1 wherein we interview the KOLs of major players as well as the upcoming ones across various geographic regions. This allows us to have their view over the market scenario and acts as an important tool to come closer to the accurate market numbers. As many as 45 paid and unpaid primary interviews are taken from both the demand and supply side of the industry to make sure we land at an accurate judgement and analysis of the market.

This step involves the triangulation of data wherein our team analyses the interview transcripts, online survey responses and observation of on filed participants. The below mentioned chart should give a better understanding of the part 1 of the primary interview.

Primary Research

Part 2: In this part of primary research the data collected via secondary research and the part 1 of the primary research is validated with the interviews from individual consultants and subject matter experts.

Consultants are those set of people who have at least 12 years of experience and expertise within the industry whereas Subject Matter Experts are those with at least 15 years of experience behind their back within the same space. The data with the help of two main processes i.e., FGDs (Focused Group Discussions) and IDs (Individual Discussions). This gives us a 3rd party nonbiased primary view of the market scenario making it a more dependable one while collation of the data pointers.

Step 3: Data Bank Validation

Once all the information is collected via primary and secondary sources, we run that information for data validation. At our intelligence centre our research heads track a lot of information related to the market which includes the quarterly reports, the daily stock prices, and other relevant information. Our data bank server gets updated every fortnight and that is how the information which we collected using our primary and secondary information is revalidated in real time.

Data Bank Validation

Step 4: QA/QC Process

After all the data collection and validation our team does a final level of quality check and quality assurance to get rid of any unwanted or undesired mistakes. This might include but not limited to getting rid of the any typos, duplication of numbers or missing of any important information. The people involved in this process include technical content writers, research heads and graphics people. Once this process is completed the title gets uploader on our platform for our clients to read it.

Step 5: Final QC/QA Process:

This is the last process and comes when the client has ordered the study. In this process a final QA/QC is done before the study is emailed to the client. Since we believe in giving our clients a good experience of our research studies, therefore, to make sure that we do not lack at our end in any way humanly possible we do a final round of quality check and then dispatch the study to the client.