Flow Battery Market Size
Get More Information on Flow Battery Market - Request Sample Report
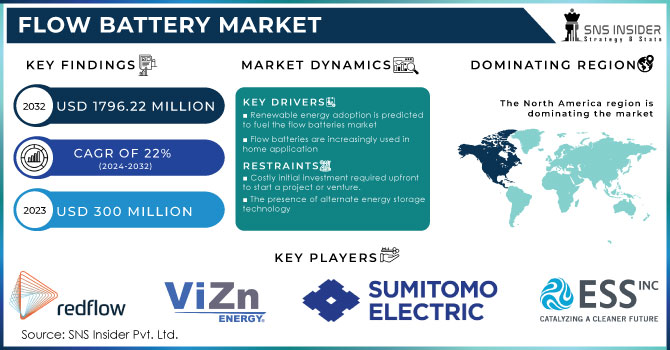
The Flow Battery Market size was valued at USD 300 million in 2023 and is expected to reach USD 1796.22 million by 2032 and grow at a CAGR of 22% over the forecast period 2024-2032.
Flow battery market is on the rise due to the growing need of renewable energy storage solutions and advanced battery technological changes. The growing need for grid stability and reliability and government incentives for renewable energy projects is driving the flow battery market. For example, the U.S. Department of Agriculture stated that USD 149 million has been invested in helping renewable energy storage projects. As a result, USDA is investing USD 124 million in renewable energy and fertilizer production projects. Overall, USD 149 million will be used in different projects regarding energy production, and water use.
With the increasing use of electric vehicles, efficient energy storage systems are required. Around 1.2 million U.S. vehicle buyers decided to go electric in 2023. More specifically, 1,189,051 new electric vehicles were put into service as the slow shift to an electrified future. In the total U.S. vehicle market, EVs accounted for 7.6% in 2023. Flow batteries’ market opportunities have been expanding since many industries are looking for sustainable and cost-effective energy. Innovations in flow battery technologies minimize cell stacks and peripheral components, which contributes to the mitigation of construction and operation costs and enhances flow battery systems’ efficiency, reliability, and lifespan.
Market Dynamics
Drivers
- Renewable energy adoption is predicted to fuel the flow batteries market
The increased utilization of solar and wind power in power generation has increased the demand for effective energy storage. Such sources of energy are sometimes unreliable, and they require sustainable energy storage solutions. The flow battery technology is an effective energy storage medium that decouples power and energy capacity. Unlike other types of batteries, flow batteries have high energy storage capacities. This includes targeting the batteries for large grid or utility-scale applications. Flow batteries have long lives and are capable of deep discharge thus compatible with renewable energy precipitation technologies. Due to the gradual shift to a low-carbon lifestyle, the demand for a more sustainable, efficient, and scalable form of energy is set to increase which in turn increases the demand for flow battery market.
- Flow batteries are increasingly used in home application
Flow batteries are widely used for large-scale energy storage for the grid. However, their suitability for home appliances is becoming increasingly recognized as well. They differ from standard batteries because energy is stored in liquid electrolytes rather than solid materials. These are durable and long-lasting and can be used for decades without any loss of capacity. Since capacities are determined by the volumes of electrolyte, it can be easily increased with sheer amounts of liquid, making this type of battery suitable for tasks of any scale. A distinct advantage of flow batteries is the separation of the energy storage and power generation units, which makes the latter safer. In particular, with flow batteries, the risk of the development of thermal runaway is minimized.
Restraints
- Costly initial investment required upfront to start a project or venture.
The flow battery has developed in terms of implications as a substitute to standard batteries such as lithium-ion, lead acid, and sodium-based batteries. Cost can be a considerable constraint to the market’s progress, even though the prices of the flow battery are still high. The entire cost of the flow battery involves costs for the flow battery’s parts, materials, installation, maintenance, and repair. In this regard, the cost of exposing small and medium-sized enterprises to these costs is substantial. Furthermore, the costs of the majority of common chemicals and other materials are fairly expensive than other batteries.
- The presence of alternate energy storage technology
The stored alternative energy technologies serve as a significant threat to the flow batteries as they limit their application in several alternatives. Consequently, the two possible alternatives lead-acid batteries and lithium-ion batteries may be considered as practically possible. There is no doubt that the latter has several advantages as compared to the flow batteries. It has higher energy density, is cheaper, and is quicker in charging and discharging. Additionally, lead-acid batteries are the cheapest and easiest to maintenance. Hence, the potential buyers might be more inclined to these alternatives that cannot be beneficial for the flow of batteries. Finally, these widely used traditional batteries, including lithium-ion, lead-acid, and sodium-based technologies of the batteries are cross-matched by the supplier rivalry of these technologies and the flow batteries.
Market Segmentation
By Battery Type
The redox segment held a major market share of over 53% in 2023. Redox flow batteries are a cost-effective and easy way to store electric energy on a grid scale and for purposes, which increase the demand for the market. These batteries store energy in liquid electrolytes located in separate external tanks. The electrolytes carry programmed active species and are circulated through a membrane that is placed in between two electrodes while charging or discharging the device. When the electrolytes circulate, certain chemical reactions happen, converting the chemical energy into electric energy and vice versa. For instance, Sumitomo Electric Industries recently introduced its innovative redox flow battery system, designed for large-scale energy storage projects.
The hybrid segment has a faster-growing CAGR during the forecast period 2024-2032, for storing ample energy on a massive scale. Their ability to store big amounts of energy and then effectively deliver it makes hybrid flow batteries perfect for storing energy for a long time on a grid-scale, in renewable energy plants, and for backup power sources. Additionally, the construction of hybrid flow batteries allows easy and convenient servicing and repairs, and the discussed type of technology is the only one that has the potential to be used until the end of its life without any repairs.
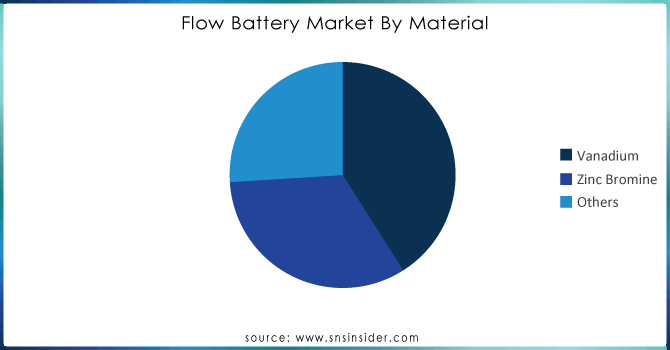
By Material
The vanadium segment led the market in 2023 with a market share of over 41%. This technology is well-suited wherever large-scale grid energy storage is needed, allowing for high scalability and a long lifespan. Flow batteries also offer the unique capability of decoupling power from energy capacity. However, they are currently more costly to produce and have lower energy density, making the technology less feasible for smaller, portable applications.
The zinc bromine segment has a significantly fast CAGR during the forecast period 2024-2032. These features circulate electrolytes, allowing for uniform reactant supply and easy thermal management. It can store and convert energy with good specific energy and energy efficiency. Like the vanadium flow battery, the zinc bromide battery is designed using low-cost and readily available materials, and its components are fully recyclable using standard manufacturing methods. The battery is highly flexible in terms of system design and can operate at ambient temperatures.
Need any customization research on Flow Battery Market - Enquiry Now
By Storage
The large-scale segment held a market share of over 58% in 2023. Large-scale flow batteries are increasingly used for grid-scale energy storage such as renewable energy integration, peak shaving, and load leveling. The growing need for reliable and efficient energy storage is likely to propel the growth of the market for large-scale flow batteries in the upcoming years.
The small-scale segment is exhibiting a high CAGR for the 2024-2032 forecast period. These flow batteries are compact which is used in-built hybrid flow batteries. These new types of flow batteries can be fitted in EV charging stations, telecommunication, residential, and commercial applications. Many of the vendors are concentrating on developing small or compact flow batteries that can be used for residential purposes.
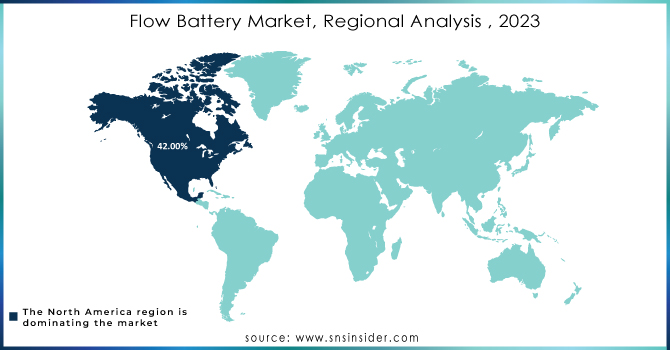
Regional Analysis
North America dominates the flow battery market with a market share of over 42% in 2023, primarily because of the increasing usage of advanced ticketing technology, and the increasing focus on improving the overall passenger experience. The region’s strong economy and focus on adopting renewable energy sources have been a significant driver of the market. The increasing adoption of intermittent renewable sources like solar and wind power requires reliable and large-scale energy storage solutions, which increases the demand for flow batteries. The region’s position has also been backed by a vast number of energy storage projects along with an increasing number of research projects in countries like the United States as well as Canada.
The Asia-Pacific is expected to gain the fastest CAGR during 2024-2032. This has primarily been because of the increasing adoption of energy storage solutions for several industrial and utility applications. Additionally, an increase in the number of operational projects with flow battery installations is likely to drive the market for this regional market over the forecast period. China’s Flow Battery Market holds the largest market share, and the Indian market is the fastest-growing market in the Asia-Pacific region.
KEY PLAYERS
Some of key players of Flow Battery Market are Ess Inc. (Us), Gildemeister Energy Solutions (Austrial), Redflow Limited. (Australia), Primus Power (Us), Redt Energy Ple. (Uk), Sumitomo Electric Industries, Ltd. (Japan), Vizn Energy Systems. (Us), Ensync Energy Systems (Us), Schmid (Germany), Elestor (Europe), VRB Energy, Gen3, and other players are listed in a final report.
RECENT DEVELOPMENT
- July 2024: Scientists at the Department of Energy’s Oak Ridge National Laboratory won funding to reach higher power densities and longer life cycles with flow batteries through the IGNIITE program. This program is designed to develop novel solutions in the energy field by supporting early-carrier researchers.
- April 2024: A USD 15 million grant from the U.S. Energy Department was split between the developers of long-duration energy storage solutions, flow battery technology also being on the list. The grand was intended to support the development of advanced materials and innovative system designs.
| Report Attributes | Details |
|---|---|
| Market Size in 2023 | USD 300 million |
| Market Size by 2032 | USD 1796.22 million |
| CAGR | CAGR of 22% From 2024 to 2032 |
| Base Year | 2023 |
| Forecast Period | 2024-2032 |
| Historical Data | 2020-2022 |
| Report Scope & Coverage | Market Size, Segments Analysis, Competitive Landscape, Regional Analysis, DROC & SWOT Analysis, Forecast Outlook |
| Key Segments | • By Battery Type (Redox, Hybrid) • By Material (Vanadium, Zinc Bromine, Others) • By Ownership (Customer Owned, Third-Party Owned, Utility Owned) • By Storage (Small-Scale, Large-Scale) • By Application (Utilities, Commercial & Industrial, EV Charging Stations, Other Applications) |
| Regional Analysis/Coverage | North America (US, Canada, Mexico), Europe (Eastern Europe [Poland, Romania, Hungary, Turkey, Rest of Eastern Europe] Western Europe] Germany, France, UK, Italy, Spain, Netherlands, Switzerland, Austria, Rest of Western Europe]), Asia Pacific (China, India, Japan, South Korea, Vietnam, Singapore, Australia, Rest of Asia Pacific), Middle East & Africa (Middle East [UAE, Egypt, Saudi Arabia, Qatar, Rest of Middle East], Africa [Nigeria, South Africa, Rest of Africa], Latin America (Brazil, Argentina, Colombia, Rest of Latin America) |
| Company Profiles | Ess Inc., Gildemeister Energy Solutions, Redflow Limited., Primus Power, Redt Energy Ple., Sumitomo Electric Industries, Vizn Energy Systems., Ensync Energy Systems, Schmid, Elestor, VRB Energy, Gen3 |
| Key Drivers | • Renewable energy adoption is predicted to fuel the flow batteries market • Flow batteries are increasingly used in home application |
| RESTRAINTS | • Costly initial investment required upfront to start a project or venture. • The presence of alternate energy storage technology |
Get in Touch
