Freight Trucking Market Report Scope & Overview:
Get More Information on Freight Trucking Market - Request Sample Report
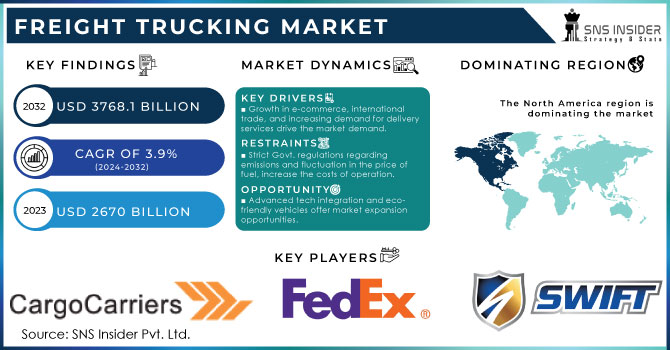
The Freight Trucking Market size was recorded at USD 2670 Billion in 2023 and is expected to reach USD 3768.1 Billion in 2032, growing at a CAGR of 3.9 % over the forecast period of 2024-2032.
The freight trucking market is growing significantly due to the rising global e-commerce industry, as freight trucks are supported for transporting packaged goods and products between distribution centers, and warehouses and further to go down to retailers. The increasingly fast and last-mile door-to-door delivery of packages from warehouse or fulfillment center hub positively affects the market. Besides, rapid industrialization has widely adopted the product for moving heavy machinery, complicated equipment, and raw materials to transport tools, and construction materials throughout factories and manufacturing units, also boosting the market growth. For Instance, According to the American Trucking Association's U.S. Freight Transportation Forecast, freight tonnage in the United States had increased by 24% by the end of 2022, leading to a projected 66% increase in revenue. The increase in no. of commercial Trucks was estimated at 12.5 Million in 2023-24. The transportation statistics show that truck transportation for the delivery of goods is 73% consisting of total freight value and 65% of total freight by weight. These all factors marked the surge in the market with 24-26% in 2023 as compared to the previous year.
In line with that, various government initiatives and policies regarding the electric mobility solution and adoption of advanced delivery systems are other factors that boost the market. For instance, US Govt. is investing heavily in infrastructure development and sustainability. According to the Bipartisan Infrastructure Law, $ 1.2 Trillion of funds are invested in infrastructure development. In Addition In April 2024, Norway introduced new funding program for electric Commercial vehicles.
Market Dynamics:
Driver
Growth in e-commerce, international trade, and increasing demand for delivery services drive the market demand.
The main factors for emerging demand for freight services (majorly, freight trucking): the growth in international trade, e-commerce, and globalization are driving forces behind. According to recorded data, the e-commerce platform had increased approx. 39% globally in 2023 as compared to 2022. Global trade and cross-border commerce boost the demand to ship goods across international borders, while the expansion of e-commerce resulted in damage in parcel volumes that are delivered via last-mile delivery services typically operated by freight trucks. For Instance, Chinese retail giant Alibaba is the largest e-commerce retailer in the world with a 23 percent market share, tops among international superpowers. However, projections estimate in 2027, Seattle-based Amazon will have explosive growth up to around $1.2 trillion U.S. dollars of online sales, more than the estimated value of Alibaba.
Restrain
Strict Govt. regulations regarding emissions and fluctuation in the price of fuel, increase the costs of operation.
Opportunity
Integration of advanced technology such as Telematics, real-time optimization and route-tracker, and adoption of eco-friendly vehicles, give the market an expansion opportunity.
Challenge
The lack of sufficient infrastructure qualified drivers and technological advancement hampers market efficiency.
By Truck Type
- Refrigerated trucks
- Tankers
- Dry vans
- Flatbeds
The dry van segment accounted for the largest share of around 40% of the total. Dry vans can carry a variety of goods, consumer products, electronics, and furniture to textiles or groceries. These characteristics, which make it a hot choice among shippers and freight forwarders are fuelling market growth in that direction. The tanker segment remains the fastest growing during the forecast period. Tanker-type vehicles are required due to the growth of industries in industrial sectors like chemicals, petroleum, pharmaceuticals, and food products like milk products and others. The tanker is a vital and most sought-after segment in the freight trucking market, it allows the transportation of liquid as well as bulk cargo.
By Vehicle Type
- Light Commercial Vehicles
- Medium Commercial Vehicles
- Heavy Commercial Vehicles
The heavy commercial vehicles segment is projected to lead the market with more than 40% of the market share during the forecast period, due to a rise in import and export operations among regions. The global trucking market is driven by heavy commercial vehicles such as heavy-duty trucks and tractor-trailers; over 30% of which is reserved for them, due to the growth of e-commerce, globalization, and industrial sectors. Increased investment by the government for public infrastructure and the development of engines with increased efficiency, safety, telematics, etc has also played an important role in the expansion of this section. Prominent manufacturers have pivoted their product offerings through strategic mergers and acquisitions that have brought heavy commercial vehicles into the picture for widespread goods transportation across the globe.
By End Use
- Automobiles
- Machinery, Apparel & Footwear
- Pharmaceutical products
- Retail
- Electronics
- Petrochemicals
- Agriculture
- Building materials
- Others
The largest share was held by the agriculture sector with more than 30% of revenue share in 2023, and it is forecasted to continue on this trajectory throughout the period. The quick perishable fruit in a particular nursing period calls for large cargo requirements and just-in-time requirements which makes these loads the same as agricultural loads. Different types of trucks are used in most food product industries, as it is vital for some that the raw materials reach their manufacturing units when fresh and need temperature control during transportation to not spoil them on long-distance transport without reaching from manufacturer until the consumer finally gets his hands on a quality finished goods. It is one of the many reasons that have improved the growth of such agricultural produce segments in this market.
Regional Coverage
North America
- US
- Canada
- Mexico
Europe
- Eastern Europe
- Poland
- Romania
- Hungary
- Turkey
- Rest of Eastern Europe
- Western Europe
- Germany
- France
- UK
- Italy
- Spain
- Netherlands
- Switzerland
- Austria
- Rest of Western Europe
Asia Pacific
- China
- India
- Japan
- South Korea
- Vietnam
- Singapore
- Australia
- Rest of Asia Pacific
Middle East & Africa
- Middle East
- UAE
- Egypt
- Saudi Arabia
- Qatar
- Rest of Middle East
- Africa
- Nigeria
- South Africa
- Rest of Africa
Latin America
- Brazil
- Argentina
- Colombia
- Rest of Latin America
Regional Analysis
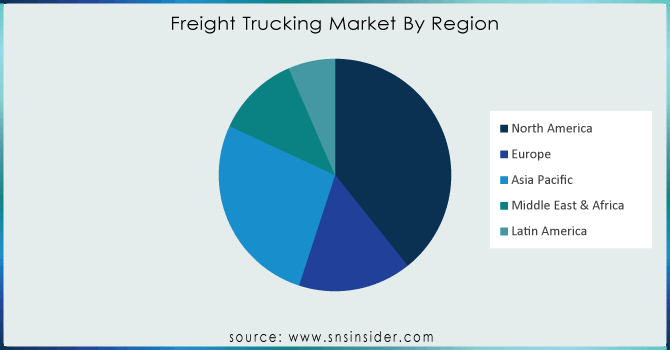
North America leads the freight trucking market, during the forecast period as the U.S. is the major key player in truck logistics, with a strong supply chain and demand. It supports a large and varied economy, with a sizable number of commodities being moved via long-distance and local trucks. For Instance, In May 2022, Maersk completed the acquisition of Pilot Freight Services: a U.S.-based global franchise serving as an international and domestic provider providing cross-border solutions in Canada and Mexico. Of course, adjusting to the digital pace of freight brokerage and the growth of e-commerce are also notable trends.
The adoption of digital freight brokerage and the expansion of e-commerce are important trends. Trade across its border with the United States has a significant impact on the country's trucking sector. Long distances, harsh weather, and various provincial rules present it with special difficulties. Mexico's trucking industry is distinguished by its involvement in the supply networks of North American producers. A significant factor is cross-border trade with the United States, with trucking businesses playing a crucial part in the movement of commodities between the two nations.
APAC is expected to grow at the significant CAGR from 2024-2032 because the huge and varied freight trucking industry in China is fuelled by the country's manufacturing and export-focused economy. With an emphasis on modernizing truck fleets for efficiency and sustainability, the sector has transformed. Given its vast geographic area and populace, India's trucking business is crucial to the logistics of the nation. It has issues with operational inefficiency, regulatory complexity, and infrastructure development. As the region's economies and trade expand, nations like Thailand and Vietnam are seeing expansion in their freight trucking sectors.
Need any customization research on freight trucking market - Enquiry Now
.
Key Players
The major key players are Cargo Carriers, UPS, FedEx, Ceva Holdings, Tuma Transport, Swift Transport, Interlogix, Transtech Logistics Procet, Concargo and others.
Recent Developments
- In January 2024, RXO launched AI-Powered Truck Check-In Technology for Warehouses and Distribution Centers As a new AI-powered check-in system for trucks arriving at warehouses and distribution centers, it uses video to identify the trucks that are on-site using image & video data from cameras in place of people asking drivers towing semi-trailers what they have brought with them.
- In October 2023, A.P. Moller Maersk and Kodiak Robotics, Inc. created the first commercial autonomous trucking lane from Houston to Oklahoma City. The collaboration with Kodiak in this regard would also allow Maersk to execute its strategy of developing digital supply chain digitization solutions, including autonomous trucks.
| Report Attributes | Details |
| Market Size in 2023 | US$ 2670 Bn |
| Market Size by 2032 | US$ 3768.1 Bn |
| CAGR | CAGR of 3.9 % From 2024 to 2032 |
| Base Year | 2023 |
| Forecast Period | 2024-2032 |
| Historical Data | 2020-2022 |
| Report Scope & Coverage | Market Size, Segments Analysis, Competitive Landscape, Regional Analysis, DROC & SWOT Analysis, Forecast Outlook |
| Key Segments | • By Propulsion Type (Electric, ICE) • By Vehicle Type (Light Commercial Vehicles, Medium Commercial Vehicles, Heavy Commercial Vehicles) • By End Use (Industrial & Manufacturing, Construction & Mining, FMCG, Others) |
| Regional Analysis/Coverage | North America (US, Canada, Mexico), Europe (Eastern Europe [Poland, Romania, Hungary, Turkey, Rest of Eastern Europe] Western Europe] Germany, France, UK, Italy, Spain, Netherlands, Switzerland, Austria, Rest of Western Europe]), Asia Pacific (China, India, Japan, South Korea, Vietnam, Singapore, Australia, Rest of Asia Pacific), Middle East & Africa (Middle East [UAE, Egypt, Saudi Arabia, Qatar, Rest of Middle East], Africa [Nigeria, South Africa, Rest of Africa], Latin America (Brazil, Argentina, Colombia Rest of Latin America) |
| Company Profiles | Cargo Carriers, UPS, FedEx, Ceva Holdings, Tuma Transport, Swift Transport, Interlogix, Transtech Logistics Procet, Concargo and others. |
| Key Drivers | • The rising shared mobility in automotive industry. |
| Market Restraints | • gasoline prices can have an impact on operating costs |
Get in Touch
