Flying Car Market Size & Overview
Get E-PDF Sample Report on Flying Car Market - Request Sample Report
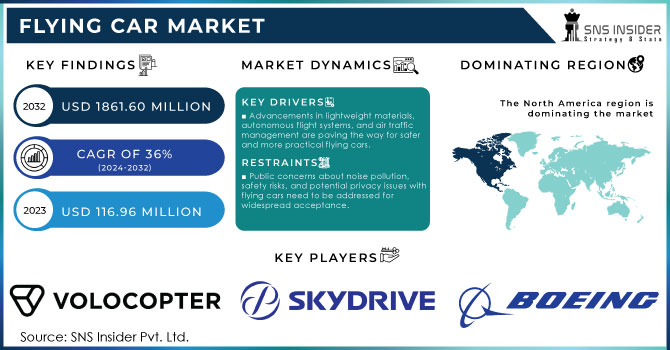
The Flying Car Market Size was valued at USD 116.9 million in 2023 and will reach USD 1861.6 Million by 2032 and growing at a CAGR of 36% by 2024-2032
Constant technological development, growing investments, and the possibility to speed up road traffic make the flying car market finally begin to grow. After all, traffic congestion wastes not only time and fuel but is also one of the contributors to air pollution. At least technologically, flying cars do have the potential to save people from traffic congestion by giving a quicker and more direct way of traveling, avoiding busy roads and crossing traffic above. All the technological advances have reached the proper juncture where viable flying car designs can go on. Development of electric VTOLs is making flying vehicles quieter, cleaner, and more efficient. Such eVTOL crafts have utilized electric motors and multi-rotor configurations for vertical lift and forward propulsion.
While increasing investments by large firms and venture capitalists accelerate the development and commercialization of flying car technologies, there is a large barrier in regulation. Concerns about safety and competent air traffic management systems of flying cars demand the formulation of clearly designed regulatory policies. Therefore, in the initial stage, flying cars will be expensive, whose price will be unaffordable for general consumers.
MARKET DYNAMICS:
KEY DRIVERS:
-
Advancements in lightweight materials, autonomous flight systems, and air traffic management are paving the way for safer and more practical flying cars.
Manufacturing lightweight materials such as carbon fibre and graphene is crucial in making flying vehicles functional and efficient. Traditional materials used in the construction of aircraft are very heavy, which can compromise range and payload. Light materials are a solution to reduce the weight of the vehicle by a very high percentage but at no cost of strength. This would enable the flying car to carry more passengers or cargo and have a greater flight distance. Safety and practicality of the flying car require installing it with autonomous flying systems. Systems include a suite of sensors, cameras, and complicated software that enable the vehicle to sense its surroundings, avoid obstacles, and maintain a safe flight path. The role of autonomous technology in substantially reducing the risk of human error would make flying cars far more accessible to a greater number of users, even those without piloting experience.
-
Growing investments from major corporations and venture capitalists are accelerating the development and commercialization of flying car technology.
RESTRAINTS:
-
Public concerns about noise pollution, safety risks, and potential privacy issues with flying cars need to be addressed for widespread acceptance.
Whirring of rotors and a number of flying cars taking off and landing may disturb the peace in urban areas. Quieter eVTOL technologies need to be developed; zones for taking off and landing have to be allotted away from highly populated areas. Regarding flying cars, the prospect of accidents and falling objects does arise. It is in mitigating these anxieties that rigorous testing procedures, robust safety features, and well-trained operators will be needed. Hence, the establishment of clear regulations with air traffic control protocols will be pivotal to ascertaining that flying cars operate safely. The potential for flying cars to go anywhere brings up anxieties over surveillance. Rules over data privacy and airspace usage will be needed to handle those anxieties.
-
The limited range and payload capacity of current flying car prototypes may restrict their practicality for long-distance travel.
OPPORTUNITIES:
-
Flying cars can revolutionize emergency response times, allowing for faster medical care and disaster relief efforts.
-
Advancements in flying car technology can lead to the development of new industries, such as air cargo delivery and aerial tourism services.
KEY MARKET SEGMENTS:
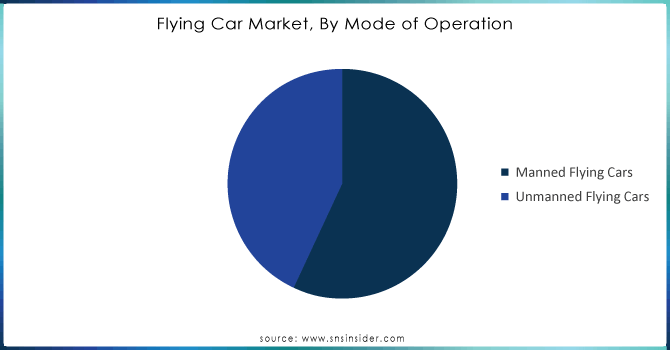
By Mode of Operation:
Manned Flying Cars is the dominating sub-segment in the Flying Car Market by mode of operation holding around 65-70% of market share. Conventionally, the concept of flying cars evokes the images of personal transportation by each individual piloting their vehicles. But unmanned flying cars or drones hold enormous potential for applications, whereas manned flying cars attract greater interest currently for personal usages. This focus on manned operation is also driving emphasis on control systems, safety features, and user interfaces toward human pilots. Thus, there is a reasonable expectation that manned flying cars will continue to hold more central interest when it comes to the setup of regulatory frameworks, providing a more tangible route to commercialization within the segment.
Get Customized Report as Per Your Business Requirement - Request For Customized Report
By Capacity:
2-Seater is the dominating sub-segment in the Flying Car Market by capacity. First flying cars that are going to hit the commercial market are those targeting the transportation of just a single person or a couple. Currently, technological limitations regarding range, payload capacity, and battery life favor smaller and lighter vehicles. Initial high cost for the technology of flying cars makes 2-seat models much more approachable for early adopters. With increasing development in technology and infrastructure, even larger segments like 3-4 seaters or even more could be possible over time.
By Vehicle Type:
Flying Cars (eVTOL) is the dominating sub-segment in the Flying Car Market by vehicle type. These crafts combine the functions of a car with VTOL capabilities and, therefore, prove more feasible for use in cities. On the other hand, passenger drones are usually conceptualized for specific applications, such as the delivery of packages or transportation over short distances within specified zones. While the passenger drones do hold promise for certain more niche applications, their regulatory and infrastructural challenges are likely to be even more complex than those of eVTOL flying cars. The focus is on the eVTOL technology because of its probable better integration with the existing transport systems and urban environments.
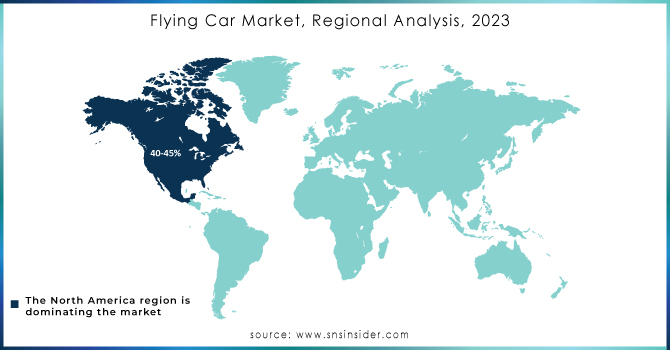
REGIONAL ANALYSES
North America leads the region in the Flying Car Market, holding around 40-45% of the market share due to its strong foundation. Established companies in the region provide expertise for research, development, and manufacturing of flying car technology. The culture of innovation is burning supported by considerable public and private venture investments in R&D, which keeps North America at the forefront.
While Europe is a close second in this market, it leverages rich engineering heritage and a talented workforce for development. Government initiatives and a concentration on urban mobility solutions in the European cities facing congestion make flying cars an attractive option.
The fastest-increasing region in this market is the Asia Pacific. The increasing economies of countries like China are raising a demand surge for the development of new transport means, which is backed by governments and realization of the potential of flying cars to contribute to economic growth and infrastructure building.
KEY PLAYERS
The major key players are Volocopter GmbH (Germany), Skydrive, A³ by Airbus (US), AeroMobil (Slovakia), Boeing (US), Cartivator (Japan), EHANG (China), Hyundai Motor Company, Klein Vision s. r. o., Samson Motors, Inc., Lilium, PAL-V N.V, TERRAFUGIA (US), Lilium (Germany), Joby Aviation (US), Uber Technologies, Inc. (US) and other key players., PAL-V International B.V. (Netherlands), Samson Motorworks (Oregon, United States), Urban Aeronautics (Yavne, Israel), Moller International (California, United States) and other key players.
RECENT DEVELOPMENT
-
In March 2022: AeroMobil launched AM NEXT, the world's first 4-seater flying car. Building on their 2-seater AM4.0 design, AM NEXT is designed for a fleet aerial ride-hailing service launching in 2027. With a range of 100-150 miles, it offers a new option for regional travel.
-
In Oct. 2022: Volocopter achieved a major milestone in Rome's flying taxi ambitions. Their electric vehicle (eVTOL) successfully completed the first passenger test flights in Italian airspace. This paves the way for launching air taxi services in Rome by 2024.
| Report Attributes | Details |
|---|---|
| Market Size in 2023 | US$ 116.9 Million |
| Market Size by 2032 | US$ 1861.6 Million |
| CAGR | CAGR of 36% From 2024 to 2032 |
| Base Year | 2023 |
| Forecast Period | 2024-2032 |
| Historical Data | 2020-2022 |
| Report Scope & Coverage | Market Size, Segments Analysis, Competitive Landscape, Regional Analysis, DROC & SWOT Analysis, Forecast Outlook |
| Key Segments | • by Product (Flying cars, Passenger drones) • by Capacity (Two-person sitters, Three and Four-person sitters, Five-person sitters) • by Operations (Piloted, Autonomous) |
| Regional Analysis/Coverage | North America (US, Canada, Mexico), Europe (Eastern Europe [Poland, Romania, Hungary, Turkey, Rest of Eastern Europe] Western Europe] Germany, France, UK, Italy, Spain, Netherlands, Switzerland, Austria, Rest of Western Europe]), Asia Pacific (China, India, Japan, South Korea, Vietnam, Singapore, Australia, Rest of Asia Pacific), Middle East & Africa (Middle East [UAE, Egypt, Saudi Arabia, Qatar, Rest of Middle East], Africa [Nigeria, South Africa, Rest of Africa], Latin America (Brazil, Argentina, Colombia, Rest of Latin America) |
| Company Profiles | Volocopter GmbH (Germany) , Skydrive, A³ by Airbus (US), AeroMobil (Slovakia), Boeing (US), Cartivator (Japan), EHANG (China), Hyundai Motor Company, Klein Vision s. r. o., Samson Motors, Inc., Lilium, PAL-V N.V , TERRAFUGIA (US), Lilium (Germany), Joby Aviation (US), and Uber Technologies, Inc. (US) |
| Key Drivers |
• Perspectives on urban transportation are shifting. |
| RESTRAINTS |
• The installation of strict aviation license rules is projected to slow the growth of the flying car sector. |
Frequently Asked Questions
- The installation of strict aviation license rules is projected to slow the growth of the flying car sector.
- The cost of developing flying cars is significant.
The forecast period of Flying Car Market is 2024-2032.
Major players in the market are Volocopter GmbH (Germny) , Skydrive, A³ by Airbus (US), AeroMobil (Slovakia), Boeing (US), Cartivator (Japan), EHANG (China), Hyundai Motor Company, Klein Vision s. r. o., Samson Motors, Inc., Lilium, PALN.V.V, TERRAFUGIA (US), Lilium (Germany), Joby Aviation (US) d Uber Technologies, Inc. (US), and others in fthe inal report.
The USD 1861.60 Million is the expected market size in 2032.
The Flying Car Market Size was valued at USD 116.96 million in 2023.
Get in Touch
