Froth Flotation Chemicals Market Report Scope & Overview:
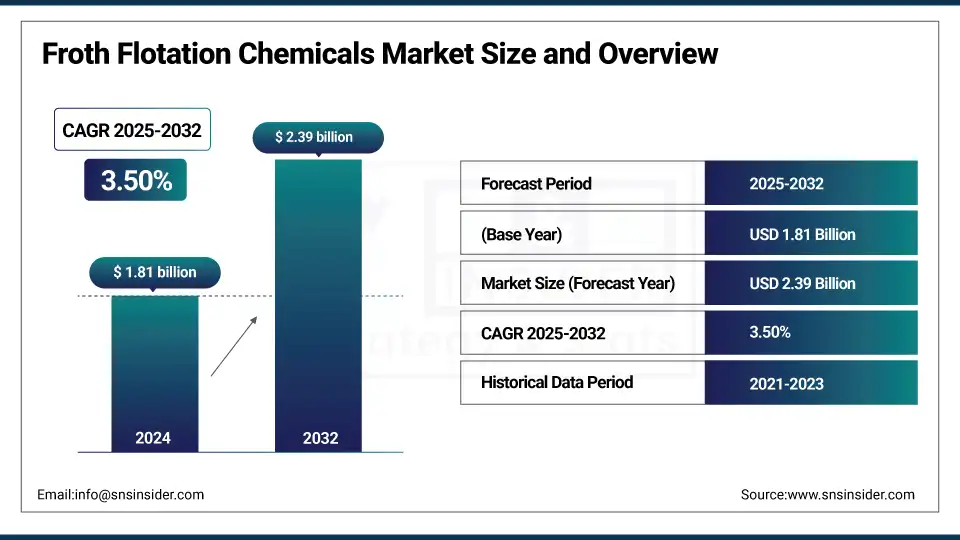
The Froth Flotation Chemicals market size was valued at USD 1.81 billion in 2024 and is expected to reach USD 2.39 billion by 2032, growing at a CAGR of 3.50% over the forecast period of 2025-2032.
The growing demand for critical metals in electric vehicles is creating new opportunities for flotation chemicals in mineral processing. Sustainability in mining, artificial machining, and tailored reagent blends are some of the trends in the froth flotation chemicals market. Froth flotation chemicals firms such as BASF continued to strengthen their game through the purchase of DOMO Chemicals’ 49% shareholding in Alsachimie JV, in May 2025. Froth flotation is acknowledged as an effective method for concentrating sulfide ores; however, depending upon the mineral and the feed particle size of the ore, the chemicals that make this process possible vary.
To Get more information On Froth Flotation Chemicals Market - Request Free Sample Report
Meanwhile, the froth flotation chemicals industry report indicates momentum towards circular economy models, recyclable reagents, and biodegradable depressants. The U.S. and Canada, with robust demand for mining chemicals, are among the prominent shareholders in the froth flotation chemicals market. These trends are influencing the growth of the froth flotation chemicals market size over key applications.
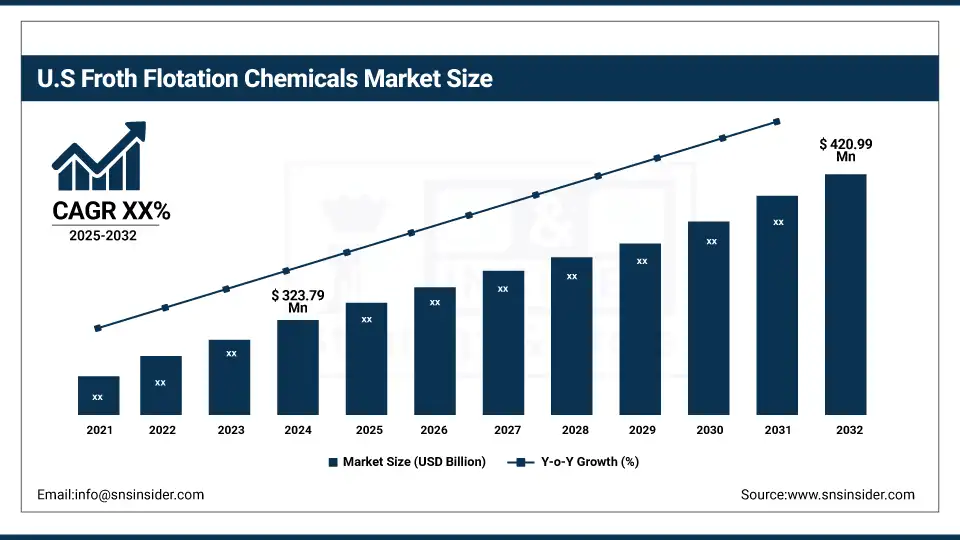
The region is dominated by the U.S. with a market size of USD 323.79 million in 2024 and is expected to reach USD 420.99 million by 2032, holding 68.4% of market share. The growth is due to its large-scale mining operations in copper, lithium, and gold. States such as Arizona and Nevada are major producers, and demand for good collectors and frothers is increasing. The country is prioritizing the supply of critical minerals domestically, and there is a push for more flotation-based mineral extraction. Major chemical producers are working on low-hazard, high-yield reagents designed for U.S. ore chemistries that could improve recovery in line with national sustainability initiatives.
Market Dynamics:
Drivers:
-
Digital Mining Advancements Increase Reagent Efficiency and Operational Optimization
The adoption of AI, IOT, and data analytics in mineral processing aids in improving reagent management, enhancing performance, and selectivity. The likes of BASF and Solvay, major companies in the supply of froth flotation chemicals, have designed digital solutions that would help ensure proper dosing and minimize wastage. This development not only increases productivity but is also in the interest of the environment in terms of compliance, causing a huge impact on the froth flotation chemicals industry outlook. Digitalization in mining is also among the contributing factors that enable miners to control the variability in feed quality, thereby fostering the overall froth flotation chemicals industry landscape.
-
Circular Economy and Sustainability Efforts Encourage Recyclable Flotation Reagents
Growing environmental norms and companies’ sustainability objectives are prompting the froth flotation chemicals market to innovate recyclable and biodegradable reagents. Companies like SNF Group and Nouryon are leading the way in water-soluble polymers and green chemistry as part of this transition process in support of circular economy thinking. These options also minimise chemical release into tailings and water systems, facilitating compliance with increasingly stringent regulatory requirements. As regulations become stricter in the mining industry, there is also an increasing requirement for safer chemicals, increasing the development and production of specialty chemicals for mineral processing.
Restraints:
-
Ore Variability and Declining Grades Complicate Reagent Standardization, Restricting the Froth Flotation Chemicals Market Growth
Decreasing ore grades and changes in mineralogy necessitate modifications to the reagents used and the operation of the flotation plant. This inconsistency questions the reliability of conventional froth flotation chemicals and increases the complexity and consumption of the chemicals used. Consequently, efficiency and/or recovery often suffer for operators adopting such generalized solutions. This variation serves to retard growth of the froth flotation chemicals market, as it requires customization for a site and decreases the economies of scale for the producers. USGS Data corroborates that global ore grades are going down over a period of time, especially Copper and Rare earth mines.
Segmentation Analysis:
By Product
Collectors dominated the froth flotation chemicals market in 2024 with a 41.2% market share, owing to their key role in rendering valuable minerals hydrophobic, aiding in their floatability, and improving their recovery. Xanthate salts used in the processing of sulfide ores dominated this subsegment. USGS reports that demand for copper and zinc is increasing worldwide, demanding effective collectors. Froth flotation chemicals specialist companies such as Clariant and Solvay have introduced new xanthate and dithiophosphate lines for mines in Africa and Latin America, strengthening the lead of this segment also in the global mineral processing chemicals space.
However, frothers are projected to be the fastest-growing segment with a CAGR of 3.85% in the forecast period of 2025 to 2032. The increase is due to increased usage in fine particle flotation and recycled pulp processing. Alcohol based frothers are becoming more popular as they offer better froth stability and have less impact on the environment. Other manufacturers, such as Nouryon and BASF, are creating low-VOC solutions in order to comply with eco-regulations. The European Chemicals Agency (ECHA) reports that new safety requirements for VOC emissions are driving the need for biodegradable frothers for the mining and industrial wastewater treatment industries.
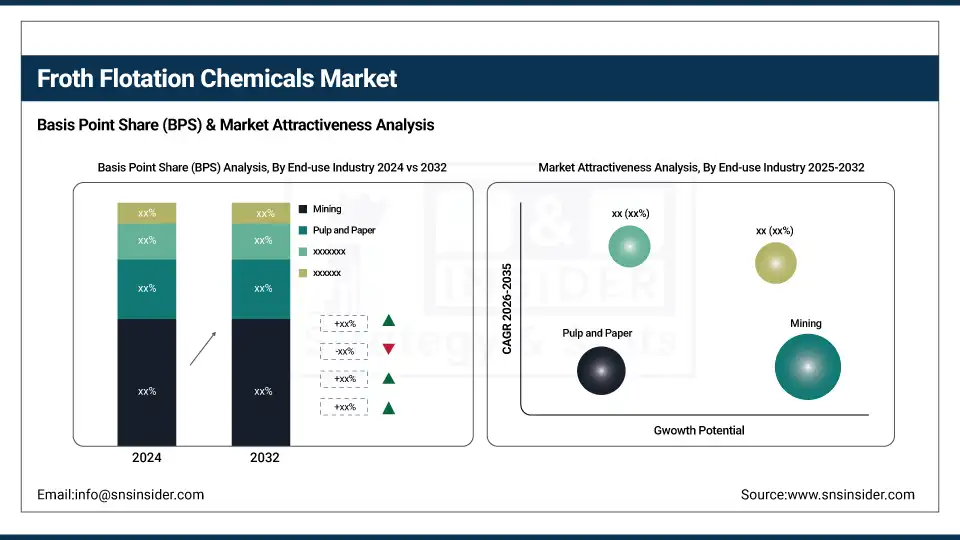
By End-use Industry
The mining sector dominated the froth flotation chemicals market in 2024 with a 65.1% market share, owing to its dependence on froth flotation for the base as well as precious metal recovery. Metal sulfide ores continue to be the largest application, with Chile and the U.S. increasing their production capacity. The US Department of Energy and Natural Resources Canada have stressed the importance of froth flotation to secure critical mineral supply domestically, and consequently, many companies engaged in the froth flotation chemicals market are investing in collector and depressant innovations.
Owing to the rising demand for recycled paper and the adoption of environment-friendly deinking technologies. In 2023, 68% of the paper used in the United States was recycled, according to the United States Environmental Protection Agency. The development of frothers for low-impact applications such as polyglycol ethers is gaining ground in the froth flotation chemicals market in the industrial deinking segment.
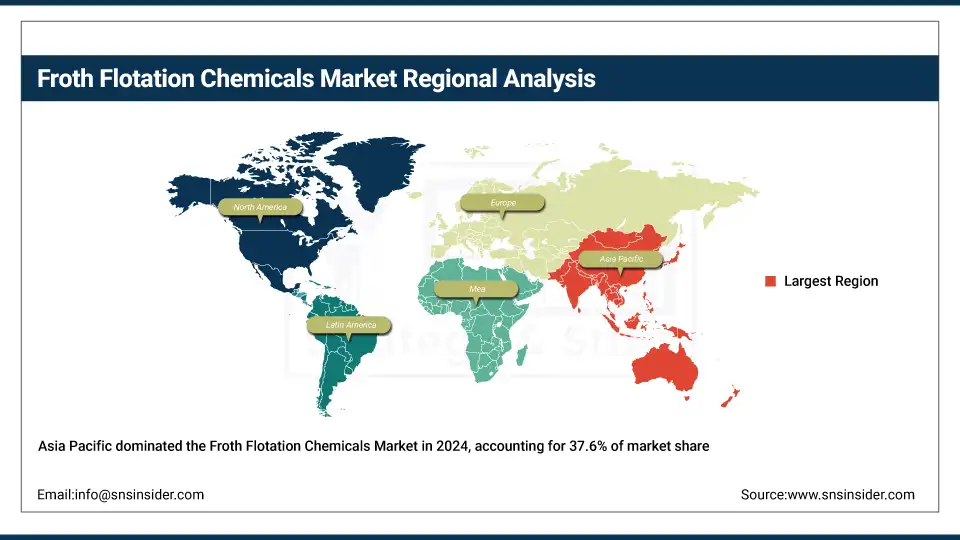
Regional Analysis:
Asia Pacific dominated and accounted for the largest market share of 37.6% in the froth flotation chemicals market, owing to large volume copper, gold, lithium, and rare earth elements mining activities. Rapid industrialization and infrastructural development have created a demand for custom green reagents in the market. China is at the forefront of production due to its robust rare earth and copper output in the region. As stricter environmental regulations come into place and investments in flotation-grade innovations are witnessing notable growth, Chinese manufacturers are developing novel collector and frother solutions to improve mineral recovery while catering to more sustainable mining practices.
Get Customized Report as per Your Business Requirement - Enquiry Now
North America's market share for froth flotation chemicals is about 26% due to the presence of a robust mining industry equipped with advanced mineral processing solutions. Reagent consumption is still being driven by the region’s long-standing emphasis on copper, gold, and lithium mining. The product offerings have a positive correlation directly to the stringent environmental grade and flotation efficiency. Ongoing investments in the development of mining innovation and automation have also spurred the froth flotation chemicals market development in the region.
The froth flotation chemicals market in Europe occupies 18.3% of the total share due to increasing demand for critical minerals in the region and a stringent regulatory landscape regarding mining processes. The region supports innovations in flotation reagents, which are biodegradable and non-toxic. Thanks to the development of mineral processing technologies and the expansion of lithium and potash mining, Germany remains at the top. The chemical industry in Europe fosters sustainable solutions, which reinforces the competitive edge of Europe in offering global solutions in froth flotation chemicals.
Latin America is an emerging market in the froth flotation chemicals market as it is predominantly a mineral- and mining-based economy with mineral resources including copper, gold, lead, zinc, and silver. Strong copper output, growing mining capacity, and new flotation methods have led Chile to dominate the region. Specialty reagents work to maximize profits and make production easier, while also ensuring the sustainability of mines.
The froth flotation chemicals market in the Middle East and Africa is anticipated to grow at a rapid pace during the forecast period. Increasing investments in mining exploration and production of precious and base metals are driving the demand. Water-efficient and environmentally friendly reagents are being increasingly favored thanks to local beneficiation policies and sustainable mining initiatives. The market is driven by rising technological innovations and the rising mineral recovery industry throughout this emerging region.
Key Players:
The major froth flotation chemicals market competitors include BASF SE, Clariant, Dow (The Dow Chemical Company), Solvay, Nouryon, Kemira, Huntsman Corporation, SNF Group, Arkema, and Chevron Phillips Chemical Company LLC.
Recent Developments:
-
In May 2025, BASF centralizes its global leaching R&D by relocating copper hydrometallurgy and flotation research from Tucson to Houston, accelerating next-generation surfactant and reagent development.
-
In November 2023, Clariant debuts its Competence Center for Decarbonization Minerals and showcases sustainable collectors and frothers for lithium, nickel, cobalt, and rare earth flotation at Flotation 2023 in Cape Town.
| Report Attributes | Details |
|---|---|
| Market Size in 2024 | USD 1.81 billion |
| Market Size by 2032 | USD 2.39 billion |
| CAGR | CAGR of 3.50% From 2025 to 2032 |
| Base Year | 2024 |
| Forecast Period | 2025-2032 |
| Historical Data | 2021-2023 |
| Report Scope & Coverage | Market Size, Segments Analysis, Competitive Landscape, Regional Analysis, DROC & SWOT Analysis, Forecast Outlook |
| Key Segments | •By Product (Collectors [Xanthanate Salts, Fatty Acids, and Others], Frothers [Alcohols, Polyglycol Ethers, and Methyl Isobutyl Carbinol], and Modifiers [pH Modifiers, Depressants, Activators, and Deactivators] and Others) •By End-use Industry (Mining, Pulp and Paper, and Industrial Waste and Sewage Treatment, Others) |
| Regional Analysis/Coverage | North America (US, Canada, Mexico), Europe (Germany, France, UK, Italy, Spain, Poland, Turkey, Rest of Europe), Asia Pacific (China, India, Japan, South Korea, Singapore, Australia, Rest of Asia Pacific), Middle East & Africa (UAE, Saudi Arabia, Qatar, South Africa, Rest of Middle East & Africa), Latin America (Brazil, Argentina, Rest of Latin America) |
| Company Profiles | BASF SE, Clariant, Dow (The Dow Chemical Company), Solvay, Nouryon, Kemira, Huntsman Corporation, SNF Group, Arkema, and Chevron Phillips Chemical Company LLC. |
Frequently Asked Questions
Top manufacturers include BASF, Clariant, Dow, Solvay, Nouryon, Huntsman, Kemira, Arkema, SNF Group, and Chevron Phillips.
Asia Pacific leads the market, followed by North America and Europe, driven by mining intensity and industrial expansion.
Ore variability and declining grades challenge standard reagent use, increasing process complexity and reducing recovery efficiency.
Metal sulfide ore processing and recycled pulp deinking are the major application areas in the froth flotation chemicals market.
Base and precious metal mining segments, especially copper, gold, and rare earths, are the key users of flotation chemicals.
Get in Touch
