Kids Tablet Market Report Scope & Overview:
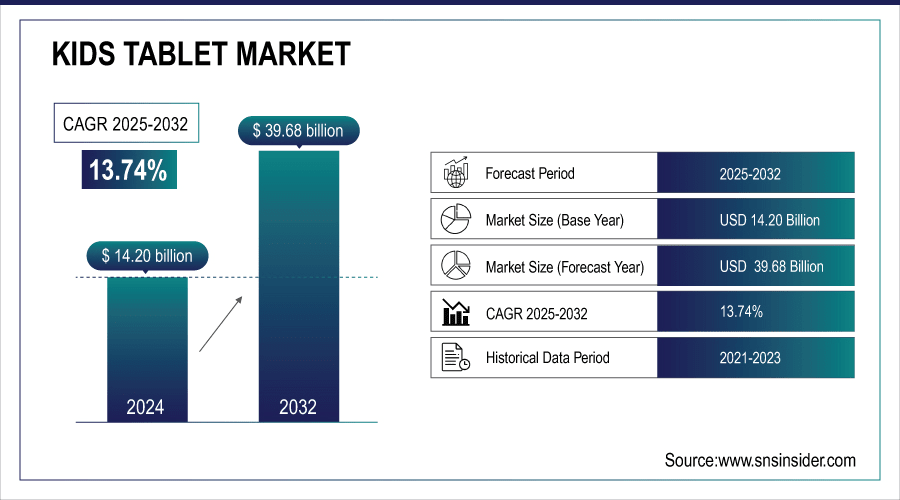
The Kids Tablet Market size was valued at USD 14.20 billion in 2024 and is expected to reach USD 39.68 billion by 2032 and grow at a CAGR of 13.74% over the forecast period of 2025-2032.
The global market is projected to grow significantly driven by surge in emphasis on early learning, increase in tech-savviness among children, and rising investments in kid-friendly digital content. The report includes comprehensive kids tablet market analysis regarding market drivers, restrains, opportunities, challenges and regional trends. Adoption across households, the education sector, and government initiatives globally are made possible as manufacturers are also innovating with child-safe features and parental controls sustainable over the years, thus contributing to the growth of the global market.
For instance, more than 55% of K–12 schools globally have integrated tablets into classroom teaching for interactive learning.

To Get more information on Kids Tablet Market - Request Free Sample Report
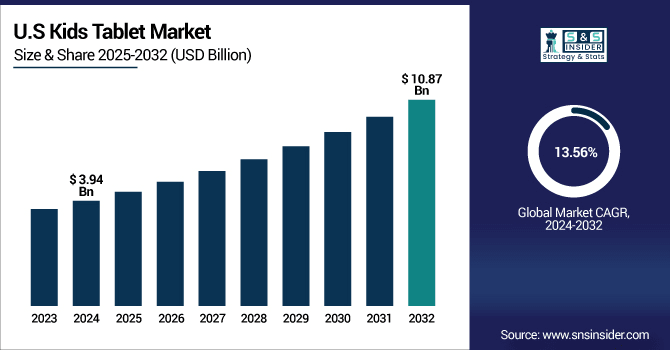
The U.S. Kids Tablet Market size was USD 3.94 billion in 2024 and is expected to reach USD 10.87 billion by 2032, growing at a CAGR of 13.56% over the forecast period of 2025–2032.

The U.S. is experiencing rapid growth fueled by the digital learning trends, the growing demand among parents for educational tools and technology adoption in early education. Demand is also spurred by government-led efforts to improve digital classrooms alongside growing recognition regarding digital literacy as a fundamental need for children. Along with a tech-savvy population and strong infrastructure, these factors are contributing to the rapid kids tablet market growth across the country.
For instance, more than 80% of the U.S. school districts have allocated budgets specifically for student tablets.
Market Dynamics:
Key Drivers:
-
Rising Parental Awareness and Demand for Child-Safe Technology Solutions
Growing parent prudence regarding screen safety and the quality of educational content has been a principal driver for demand for child-proof technology solutions, such as kids tablet. More parents are choosing tablets built with strong parental controls, usage tracking, and age-appropriate apps, so kids can have safe digital experiences. Additionally, features, such as restricted Wi-Fi access, durable builds, and educational games are making kids' tablets a more appealing option than regular devices. This abundant attention toward online safety and enhancement of learning is escalating purchase and growth between both types of purchasers, domestic and even institutional.
For instance, nearly 68% of kids’ tablets now come with shockproof or ruggedized cases to withstand rough handling.
Restraints:
-
Limited Digital Infrastructure in Remote and Rural Areas Affecting Market Expansion
One of the main barriers to the adoption of kids tablets in the market is limited market access due to limited digital infrastructure in remote and rural areas. But all of this is useless in many parts globally, where the internet does not work well, nobody has power, and few people can read or understand digital text. These technological gaps hinder integration of tablets in learning settings in schools and homes. In addition, training and where teachers and parents are not trained to take the tablets seriously as an educational tool inhibits the growing potential in rural and developing markets.
Opportunities:
-
Government Initiatives to Digitize Education Systems Across Developing Economies Can Create Multiple Growth Opportunities
The strong growth opportunity for kids tablet is due to the government initiative in the field of digitization of education systems especially in the developing economies. Digital literacy initiatives, tech-enabled classrooms, and e-learning platforms are driving the need for low-cost and child-specific educational devices. Some governments are giving financial or business backing to private firms to distribute tablets in schools, expanding access to quality education. The increase in the usage of tablets not only enhances the potential tablet users but also encourages innovation in content development, infrastructure development and localized learning with far larger scalable opportunities opening up in emerging markets.
For instance, more than 70% of public schools globally incorporated at least one digital learning platform in classrooms.
Challenges:
-
Concerns About Excessive Screen Time and Its Impact on Child Development Challenges Market Growth
The increasing fears over the harmful nature of overuse of the device, which hampers overall growth of the children is hindering the growth of the kids tablet market. There are many parents and educators worried about how long kids should be on devices, or the possibility of attention disorders and sleep loss, or whether kids should even be sitting around doing much less than running around in the park. This perception hinders efforts to make tablets widespread adoption despite their educational potential. While features are being built that attempt to balance screen time and health-related usage patterns, such psychological and behavioral concerns will always remain a hurdle toward market acceptance.
Segmentation Analysis:
By Age Group
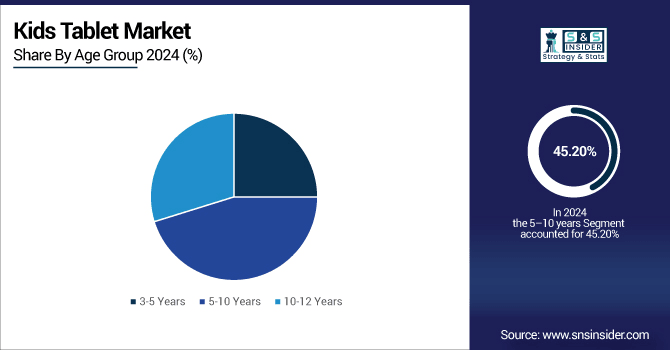
In 2024, the highest revenue share of 45.20% was held by the 5–10 years age group owing to the growing adoption of tablets in formal education programs and home-based learning. This age group actively use tablets for homework, reading and skill-building apps. Samsung has also exploited this generation with kid modes on their tablets and educational content that matches the school curriculum, which, the firm claims, has been taken up in record numbers by school districts and parents looking for moderation aides.
The 3–5 years segment is expected to grow at a rapid pace overl 2024-2032, with a CAGR of 15.10%, owing to the proliferation of digital preschool and early development tools. Tablet specs in this space prioritize easy to use interfaces and gamified learning. LeapFrog Enterprises is a prominent name for earlier-age tablets with its LeapPad line featuring toddler- and early-learner-friendly interactive media and solid designs with parental control options.

By Product Type
The full-featured tablets lead the kids tablet market share in 2024 by 40.10% owing to their capabilities, such as strong parental controls, educational content, and multimedia support. These devices would have great hardware and software performance making it right for education institutions and best for home use as well. Amazon continues its one-two punch in this segment with the Fire HD Kids Edition, which, for the price-conscious parent, offers lots of kid-friendly features out of the box, including bundled content, a kid-proof case, and a multi-year no-questions-asked replacement warranty.
Hybrid tablets will grow with the highest CAGR 15.11% during 2024-2032 due to their function as both a tablet and a laptop. Older kids are looking for these devices to handle schoolwork, online classes, and creative tasks, as well. Some of the fastest-growing segments in the tablet market come from the educational sphere, and Lenovo is one of the influential players helping drive growth in this area with a fleet of 2-in-1 convertible tablets for education with both stylus and detachable keyboard support, along with specs that target interactivity and content creation.
By Connectivity
The revenue share of Wi-Fi Only tablets reached 48.20% in 2024, being the most competitive product for its affordability and the potential to use fixed environments, such as homes and schools. Parents also tend to choose these tablets as they are a way to keep children away from unfiltered internet. One of the brands that has stepped up for this segment is Kurio, which is known for providing Wi-Fi-enabled Android tablets specifically tailored for kids with a focus on content filtering, time management, and built to last as per the typical parent concern where online oriented product for kids is concerned.
Wi-Fi + Cellular segment is projected to register highest CAGR of 14.29% during 2024 to 2032, due to rise in need for mobility and uninterrupted internet access. This could be particularly beneficial to students based in remote and rural communities, where the Wi-Fi infrastructure is generally unreliable. Another company to look for in this space is Huawei, which about two weeks ago announced a series of cellular-enabled tablets marketed toward kids with educational content, high durability, and SIM support in spearhead developing markets.
By End-User
In 2024, Educational Institutions led the kids tablet market with a 60.20% revenue share, as several schools have adapted to the trend of digital classrooms and are providing tablets as an essential part of the e-learning infrastructure. Tablets also provide for a greater degree of personalized learning and digital collaboration. Apple is still a major player in this space via its iPad for Education program that works with schools globally to provide robust hardware paired with teaching apps and classroom management tools.
The government and NGOs segment is expected to grow at the highest CAGR of 15.84%, as the initiatives toward digital inclusion and public-private partnerships are helping reduce the digital divide. To promote basic education, these organizations have turned to distributing tablets to children from lower-income families. DataWind, which produces ultra-low-cost tablets, has teamed up with various government and NGO programs (notably in India and Africa) to provide low-cost devices that are meant to fulfill very basic education requirements.
Regional Analysis:
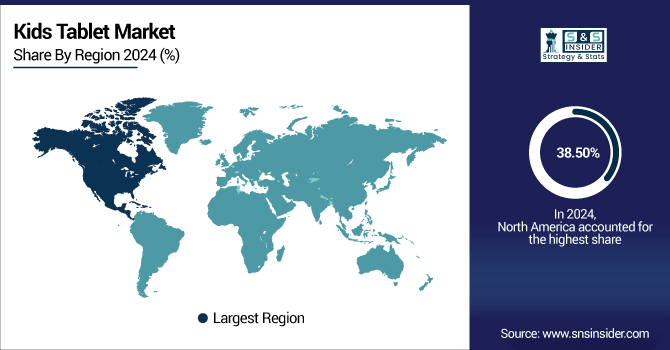
North America held the largest kids tablet market share in 2024, at 38.50% of revenue, due to the region’s significant penetration of digital literacy technology, the prevalence of educational technology at an early stage, and a strong presence of dominating manufacturers. The area additionally includes the sort of widespread web access and consumer that are progressively searching for intelligent, secure, and instructional kids content.

Get Customized Report as per Your Business Requirement - Enquiry Now
-
The U.S. dominates the North American Kids Tablet Market due to high technology adoption, strong presence of key players, advanced educational infrastructure, and early integration of digital learning tools in schools, supported by government initiatives and high parental purchasing power.
Asia Pacific is expected to grow at the highest CAGR of 14.30% during 2024-2032, owing to the rapid investments in education, the surge in urbanization, and the awareness regarding digital learning. The regional market is growing at a very high rate due to rapid economic development in the countries, such as India, China, and government encouragement for digital education drive to motivate modernization of technology in teaching and learning.
-
China leads the Asia Pacific Kids Tablet Market owing to its massive population of school-aged children, government-driven digital education policies, rapid urbanization, and strong local manufacturing capabilities that provide affordable, education-focused tablets tailored to regional learning needs and languages.
Europe accounts for substantial business for Kids Tablet industry owing to well established educational systems, increased digital literacy and strong parental focus towards early childhood learning. Germany, the U.K., and France are among the leading adopters driven by government-led initiatives centered on digital education. Market growth across the region is also driven by the increasing awareness of safe digital content and investment in EdTech.
-
Germany dominates the European kids tablet market due to strong government support for digital education, high investment in school technology, and strict content regulations. Its advanced infrastructure and high parental awareness of educational tools drive consistent demand across households and institutions.
The Kids Tablet Market in the Middle East & Africa and Latin America is progressing slowly. UAE tops MEA with advanced digital infrastructure and high uptake of EdTech. Brazil accounts for the largest number of students in Latin America due to the government's investments in education and the growing number of schools incorporating digital learning into their classrooms.
Key Players:
Major kids tablet companies in the market are Apple Inc., Samsung Electronics Co., Ltd., Amazon.com, Inc., Huawei Technologies Co., Ltd., Lenovo Group Limited, Microsoft Corporation, AsusTek Computer Inc., Acer Inc., Dell Technologies Inc., LG Electronics Inc., Google LLC, Kurio, LeapFrog Enterprises, Inc., Dragon Touch, VTech Holdings Limited, Ematic, Contixo Inc., Nabi, RCA Tablets, and Walmart Inc and others.
Recent Developments:
-
In March 2025, Samsung Indonesia launched Galaxy Tab A9 Kids and Galaxy A16 Kids Editions with Paw Patrol branding, themed accessories, and content to engage children safely.
-
In October 2024, LeapFrog Learn Together Tablet was launched with pre-loaded educational games aligned to early learning curricula; also expanded into Europe and partnered with Sesame Workshop for character-based content.
Report Attributes | Details |
---|---|
Market Size in 2024 | USD 14.20 Billion |
Market Size by 2032 | USD 39.68 Millon |
CAGR | CAGR of 13.74% From 2025 to 2032 |
Base Year | 2024 |
Forecast Period | 2025-2032 |
Historical Data | 2021-2023 |
Report Scope & Coverage | Market Size, Segments Analysis, Competitive Landscape, Regional Analysis, DROC & SWOT Analysis, Forecast Outlook |
Key Segments | • By Product Type (Full-Featured Tablets, Budget Kids Tablets, E-Readers and Hybrid Tablets) • By Age Group (3-5 Years, 5-10 Years and 10-12 Years) • By Connectivity (Wi-Fi Only, Wi-Fi + Cellular and Bluetooth Enabled) • By End-User (Households, Educational Institutions and Government/NGOs) |
Regional Analysis/Coverage | North America (US, Canada, Mexico), Europe (Germany, France, UK, Italy, Spain, Poland, Turkey, Rest of Europe), Asia Pacific (China, India, Japan, South Korea, Singapore, Australia, Taiwan, Rest of Asia Pacific), Middle East & Africa (UAE, Saudi Arabia, Qatar, South Africa, Rest of Middle East & Africa), Latin America (Brazil, Argentina, Rest of Latin America) |
Company Profiles | Apple Inc., Samsung Electronics Co., Ltd., Amazon.com, Inc., Huawei Technologies Co., Ltd., Lenovo Group Limited, Microsoft Corporation, AsusTek Computer Inc., Acer Inc., Dell Technologies Inc., LG Electronics Inc., Google LLC, Kurio, LeapFrog Enterprises, Inc., Dragon Touch, VTech Holdings Limited, Ematic, Contixo Inc., Nabi, RCA Tablets and Walmart Inc. |
Table Of Contents
1. Introduction
1.1 Market Definition & Scope
1.2 Research Assumptions & Abbreviations
1.3 Research Methodology
2. Executive Summary
2.1 Market Snapshot
2.2 Market Absolute $ Opportunity Assessment & Y-o-Y Analysis, 2021–2032
2.3 Market Size & Forecast, By Segmentation, 2021–2032
2.3.1 Market Size By Product Type
2.3.2 Market Size By Age Group
2.3.3 Market Size By Connectivity
2.3.4 Market Size By End-User
2.4 Market Share & Bps Analysis By Region, 2024
2.5 Industry Growth Scenarios – Conservative, Likely & Optimistic
2.6 Industry CxO’s Perspective
3. Market Overview
3.1 Market Dynamics
3.1.1 Drivers
3.1.2 Restraints
3.1.3 Opportunities
3.1.4 Key Market Trends
3.2 Industry PESTLE Analysis
3.3 Key Industry Forces (Porter’s) Impacting Market Growth
3.4 Industry Supply Chain Analysis
3.4.1 Raw Material Suppliers
3.4.2 Manufacturers
3.4.3 Distributors/Suppliers
3.4.4 Customers/End-Users
3.5 Industry Life Cycle Assessment
3.6 Parent Market Overview
3.7 Market Risk Assessment
4. Statistical Insights & Trends Reporting
4.1 Operational & Performance Metrics
4.1.1 Overview
4.1.2 Battery Life & Screen Size Statistics
4.1.3 Storage & RAM Adoption Metrics
4.1.4 Durability & Warranty Claims Analysis
4.1.5 Parental Control Feature Adoption
4.2 Investment & R&D Statistics
4.2.1 Overview
4.2.2 R&D Expenditure By Key Players
4.2.3 Patent Filing Trends By Technology
4.2.4 Investment Trends In Child-Focused Features
4.3 Regulatory & Compliance Statistics
4.3.1 Overview
4.3.2 Regulatory Trends By Key Countries
4.3.3 Compliance Adoption By Product Type
4.3.4 Child Data Protection & Safety Standards
4.4 Supply Chain & Manufacturing Statistics
4.4.1 Overview
4.4.2 Manufacturing Facility Distribution By Region
4.4.3 Component Sourcing & Dependency Analysis
4.4.4 Lead Time & Logistics Statistics
4.4.5 Import & Export Contribution
5. Kids Tablet Market Segmental Analysis & Forecast, By Product Type, 2021 – 2032, Value (Usd Billion)
5.1 Introduction
5.2 Full-Featured Tablets
5.2.1 Key Trends
5.2.2 Market Size & Forecast, 2021 – 2032
5.3 Budget Kids Tablets
5.3.1 Key Trends
5.3.2 Market Size & Forecast, 2021 – 2032
5.4 E-Readers
5.4.1 Key Trends
5.4.2 Market Size & Forecast, 2021 – 2032
5.5 Hybrid Tablets
5.5.1 Key Trends
5.5.2 Market Size & Forecast, 2021 – 2032
6. Kids Tablet Market Segmental Analysis & Forecast, By Age Group, 2021 – 2032, Value (Usd Billion)
6.1 Introduction
6.2 3-5 Years
6.2.1 Key Trends
6.2.2 Market Size & Forecast, 2021 – 2032
6.3 5-10 Years
6.3.1 Key Trends
6.3.2 Market Size & Forecast, 2021 – 2032
6.4 10-12 Years
6.4.1 Key Trends
6.4.2 Market Size & Forecast, 2021 – 2032
7. Kids Tablet Market Segmental Analysis & Forecast, By Connectivity, 2021 – 2032, Value (Usd Billion)
7.1 Introduction
7.2 Wi-Fi Only
7.2.1 Key Trends
7.2.2 Market Size & Forecast, 2021 – 2032
7.3 Wi-Fi + Cellular
7.3.1 Key Trends
7.3.2 Market Size & Forecast, 2021 – 2032
7.4 Bluetooth Enabled
7.4.1 Key Trends
7.4.2 Market Size & Forecast, 2021 – 2032
8. Kids Tablet Market Segmental Analysis & Forecast, By End-User, 2021 – 2032, Value (Usd Billion)
8.1 Introduction
8.2 Households
8.2.1 Key Trends
8.2.2 Market Size & Forecast, 2021 – 2032
8.3 Educational Institutions
8.3.1 Key Trends
8.3.2 Market Size & Forecast, 2021 – 2032
8.4 Government/NGOs
8.4.1 Key Trends
8.4.2 Market Size & Forecast, 2021 – 2032
9. Kids Tablet Market Segmental Analysis & Forecast By Region, 2021 – 2025, Value (Usd Billion)
9.1 Introduction
9.2 North America
9.2.1 Key Trends
9.2.2 Kids Tablet Market Size & Forecast, By Product Type, 2021 – 2032
9.2.3 Kids Tablet Market Size & Forecast, By Age Group, 2021 – 2032
9.2.4 Kids Tablet Market Size & Forecast, By Connectivity, 2021 – 2032
9.2.5 Kids Tablet Market Size & Forecast, By End-User, 2021 – 2032
9.2.6 Kids Tablet Market Size & Forecast, By Country, 2021 – 2032
9.2.6.1 USA
9.2.6.1.1 Kids Tablet Market Size & Forecast, By Product Type, 2021 – 2032
9.2.6.1.2 Kids Tablet Market Size & Forecast, By Age Group, 2021 – 2032
9.2.6.1.3 Kids Tablet Market Size & Forecast, By Connectivity, 2021 – 2032
9.2.6.1.4 Kids Tablet Market Size & Forecast, By End-User, 2021 – 2032
9.2.6.2 Canada
9.2.6.2.1 Kids Tablet Market Size & Forecast, By Product Type, 2021 – 2032
9.2.6.2.2 Kids Tablet Market Size & Forecast, By Age Group, 2021 – 2032
9.2.6.2.3 Kids Tablet Market Size & Forecast, By Connectivity, 2021 – 2032
9.2.6.2.4 Kids Tablet Market Size & Forecast, By End-User, 2021 – 2032
9.3 Europe
9.3.1 Key Trends
9.3.2 Kids Tablet Market Size & Forecast, By Product Type, 2021 – 2032
9.3.3 Kids Tablet Market Size & Forecast, By Age Group, 2021 – 2032
9.3.4 Kids Tablet Market Size & Forecast, By Connectivity, 2021 – 2032
9.3.5 Kids Tablet Market Size & Forecast, By End-User, 2021 – 2032
9.3.6 Kids Tablet Market Size & Forecast, By Country, 2021 – 2032
9.3.6.1 Germany
9.3.6.1.1 Kids Tablet Market Size & Forecast, By Product Type, 2021 – 2032
9.3.6.1.2 Kids Tablet Market Size & Forecast, By Age Group, 2021 – 2032
9.3.6.1.3 Kids Tablet Market Size & Forecast, By Connectivity, 2021 – 2032
9.3.6.1.4 Kids Tablet Market Size & Forecast, By End-User, 2021 – 2032
9.3.6.2 UK
9.3.6.2.1 Kids Tablet Market Size & Forecast, By Product Type, 2021 – 2032
9.3.6.2.2 Kids Tablet Market Size & Forecast, By Age Group, 2021 – 2032
9.3.6.2.3 Kids Tablet Market Size & Forecast, By Connectivity, 2021 – 2032
9.3.6.2.4 Kids Tablet Market Size & Forecast, By End-User, 2021 – 2032
9.3.6.3 France
9.3.6.3.1 Kids Tablet Market Size & Forecast, By Product Type, 2021 – 2032
9.3.6.3.2 Kids Tablet Market Size & Forecast, By Age Group, 2021 – 2032
9.3.6.3.3 Kids Tablet Market Size & Forecast, By Connectivity, 2021 – 2032
9.3.6.3.4 Kids Tablet Market Size & Forecast, By End-User, 2021 – 2032
9.3.6.4 Italy
9.3.6.4.1 Kids Tablet Market Size & Forecast, By Product Type, 2021 – 2032
9.3.6.4.2 Kids Tablet Market Size & Forecast, By Age Group, 2021 – 2032
9.3.6.4.3 Kids Tablet Market Size & Forecast, By Connectivity, 2021 – 2032
9.3.6.4.4 Kids Tablet Market Size & Forecast, By End-User, 2021 – 2032
9.3.6.5 Spain
9.3.6.5.1 Kids Tablet Market Size & Forecast, By Product Type, 2021 – 2032
9.3.6.5.2 Kids Tablet Market Size & Forecast, By Age Group, 2021 – 2032
9.3.6.5.3 Kids Tablet Market Size & Forecast, By Connectivity, 2021 – 2032
9.3.6.5.4 Kids Tablet Market Size & Forecast, By End-User, 2021 – 2032
9.3.6.6 Russia
9.3.6.6.1 Kids Tablet Market Size & Forecast, By Product Type, 2021 – 2032
9.3.6.6.2 Kids Tablet Market Size & Forecast, By Age Group, 2021 – 2032
9.3.6.6.3 Kids Tablet Market Size & Forecast, By Connectivity, 2021 – 2032
9.3.6.6.4 Kids Tablet Market Size & Forecast, By End-User, 2021 – 2032
9.3.6.7 Poland
9.3.6.7.1 Kids Tablet Market Size & Forecast, By Product Type, 2021 – 2032
9.3.6.7.2 Kids Tablet Market Size & Forecast, By Age Group, 2021 – 2032
9.3.6.7.3 Kids Tablet Market Size & Forecast, By Connectivity, 2021 – 2032
9.3.6.7.4 Kids Tablet Market Size & Forecast, By End-User, 2021 – 2032
9.3.6.8 Rest of Europe
9.3.6.8.1 Kids Tablet Market Size & Forecast, By Product Type, 2021 – 2032
9.3.6.8.2 Kids Tablet Market Size & Forecast, By Age Group, 2021 – 2032
9.3.6.8.3 Kids Tablet Market Size & Forecast, By Connectivity, 2021 – 2032
9.3.6.8.4 Kids Tablet Market Size & Forecast, By End-User, 2021 – 2032
9.4 Asia-Pacific
9.4.1 Key Trends
9.4.2 Kids Tablet Market Size & Forecast, By Product Type, 2021 – 2032
9.4.3 Kids Tablet Market Size & Forecast, By Age Group, 2021 – 2032
9.4.4 Kids Tablet Market Size & Forecast, By Connectivity, 2021 – 2032
9.4.5 Kids Tablet Market Size & Forecast, By End-User, 2021 – 2032
9.4.6 Kids Tablet Market Size & Forecast, By Country, 2021 – 2032
9.4.6.1 China
9.4.6.1.1 Kids Tablet Market Size & Forecast, By Product Type, 2021 – 2032
9.4.6.1.2 Kids Tablet Market Size & Forecast, By Age Group, 2021 – 2032
9.4.6.1.3 Kids Tablet Market Size & Forecast, By Connectivity, 2021 – 2032
9.4.6.1.4 Kids Tablet Market Size & Forecast, By End-User, 2021 – 2032
9.4.6.2 India
9.4.6.2.1 Kids Tablet Market Size & Forecast, By Product Type, 2021 – 2032
9.4.6.2.2 Kids Tablet Market Size & Forecast, By Age Group, 2021 – 2032
9.4.6.2.3 Kids Tablet Market Size & Forecast, By Connectivity, 2021 – 2032
9.4.6.2.4 Kids Tablet Market Size & Forecast, By End-User, 2021 – 2032
9.4.6.3 Japan
9.4.6.3.1 Kids Tablet Market Size & Forecast, By Product Type, 2021 – 2032
9.4.6.3.2 Kids Tablet Market Size & Forecast, By Age Group, 2021 – 2032
9.4.6.3.3 Kids Tablet Market Size & Forecast, By Connectivity, 2021 – 2032
9.4.6.3.4 Kids Tablet Market Size & Forecast, By End-User, 2021 – 2032
9.4.6.4 South Korea
9.4.6.4.1 Kids Tablet Market Size & Forecast, By Product Type, 2021 – 2032
9.4.6.4.2 Kids Tablet Market Size & Forecast, By Age Group, 2021 – 2032
9.4.6.4.3 Kids Tablet Market Size & Forecast, By Connectivity, 2021 – 2032
9.4.6.4.4 Kids Tablet Market Size & Forecast, By End-User, 2021 – 2032
9.4.6.5 Australia
9.4.6.5.1 Kids Tablet Market Size & Forecast, By Product Type, 2021 – 2032
9.4.6.5.2 Kids Tablet Market Size & Forecast, By Age Group, 2021 – 2032
9.4.6.5.3 Kids Tablet Market Size & Forecast, By Connectivity, 2021 – 2032
9.4.6.5.4 Kids Tablet Market Size & Forecast, By End-User, 2021 – 2032
9.4.6.6 ASEAN Countries
9.4.6.6.1 Kids Tablet Market Size & Forecast, By Product Type, 2021 – 2032
9.4.6.6.2 Kids Tablet Market Size & Forecast, By Age Group, 2021 – 2032
9.4.6.6.3 Kids Tablet Market Size & Forecast, By Connectivity, 2021 – 2032
9.4.6.6.4 Kids Tablet Market Size & Forecast, By End-User, 2021 – 2032
9.4.6.7 Rest of Asia-Pacific
9.4.6.7.1 Kids Tablet Market Size & Forecast, By Product Type, 2021 – 2032
9.4.6.7.2 Kids Tablet Market Size & Forecast, By Age Group, 2021 – 2032
9.4.6.7.3 Kids Tablet Market Size & Forecast, By Connectivity, 2021 – 2032
9.4.6.7.4 Kids Tablet Market Size & Forecast, By End-User, 2021 – 2032
9.5 Latin America
9.5.1 Key Trends
9.5.2 Kids Tablet Market Size & Forecast, By Product Type, 2021 – 2032
9.5.3 Kids Tablet Market Size & Forecast, By Age Group, 2021 – 2032
9.5.4 Kids Tablet Market Size & Forecast, By Connectivity, 2021 – 2032
9.5.5 Kids Tablet Market Size & Forecast, By End-User, 2021 – 2032
9.5.6 Kids Tablet Market Size & Forecast, By Country, 2021 – 2032
9.5.6.1 Brazil
9.5.6.1.1 Kids Tablet Market Size & Forecast, By Product Type, 2021 – 2032
9.5.6.1.2 Kids Tablet Market Size & Forecast, By Age Group, 2021 – 2032
9.5.6.1.3 Kids Tablet Market Size & Forecast, By Connectivity, 2021 – 2032
9.5.6.1.4 Kids Tablet Market Size & Forecast, By End-User, 2021 – 2032
9.5.6.2 Argentina
9.5.6.2.1 Kids Tablet Market Size & Forecast, By Product Type, 2021 – 2032
9.5.6.2.2 Kids Tablet Market Size & Forecast, By Age Group, 2021 – 2032
9.5.6.2.3 Kids Tablet Market Size & Forecast, By Connectivity, 2021 – 2032
9.5.6.2.4 Kids Tablet Market Size & Forecast, By End-User, 2021 – 2032
9.5.6.3 Mexico
9.5.6.3.1 Kids Tablet Market Size & Forecast, By Product Type, 2021 – 2032
9.5.6.3.2 Kids Tablet Market Size & Forecast, By Age Group, 2021 – 2032
9.5.6.3.3 Kids Tablet Market Size & Forecast, By Connectivity, 2021 – 2032
9.5.6.3.4 Kids Tablet Market Size & Forecast, By End-User, 2021 – 2032
9.5.6.4 Colombia
9.5.6.4.1 Kids Tablet Market Size & Forecast, By Product Type, 2021 – 2032
9.5.6.4.2 Kids Tablet Market Size & Forecast, By Age Group, 2021 – 2032
9.5.6.4.3 Kids Tablet Market Size & Forecast, By Connectivity, 2021 – 2032
9.5.6.4.4 Kids Tablet Market Size & Forecast, By End-User, 2021 – 2032
9.5.6.5 Rest of Latin America
9.5.6.5.1 Kids Tablet Market Size & Forecast, By Product Type, 2021 – 2032
9.5.6.5.2 Kids Tablet Market Size & Forecast, By Age Group, 2021 – 2032
9.5.6.5.3 Kids Tablet Market Size & Forecast, By Connectivity, 2021 – 2032
9.5.6.5.4 Kids Tablet Market Size & Forecast, By End-User, 2021 – 2032
9.6 Middle East & Africa
9.6.1 Key Trends
9.6.2 Kids Tablet Market Size & Forecast, By Product Type, 2021 – 2032
9.6.3 Kids Tablet Market Size & Forecast, By Age Group, 2021 – 2032
9.6.4 Kids Tablet Market Size & Forecast, By Connectivity, 2021 – 2032
9.6.5 Kids Tablet Market Size & Forecast, By End-User, 2021 – 2032
9.6.6 Kids Tablet Market Size & Forecast, By Country, 2021 – 2032
9.6.6.1 UAE
9.6.6.1.1 Kids Tablet Market Size & Forecast, By Product Type, 2021 – 2032
9.6.6.1.2 Kids Tablet Market Size & Forecast, By Age Group, 2021 – 2032
9.6.6.1.3 Kids Tablet Market Size & Forecast, By Connectivity, 2021 – 2032
9.6.6.1.4 Kids Tablet Market Size & Forecast, By End-User, 2021 – 2032
9.6.6.2 Saudi Arabia
9.6.6.2.1 Kids Tablet Market Size & Forecast, By Product Type, 2021 – 2032
9.6.6.2.2 Kids Tablet Market Size & Forecast, By Age Group, 2021 – 2032
9.6.6.2.3 Kids Tablet Market Size & Forecast, By Connectivity, 2021 – 2032
9.6.6.2.4 Kids Tablet Market Size & Forecast, By End-User, 2021 – 2032
9.6.6.3 Qatar
9.6.6.3.1 Kids Tablet Market Size & Forecast, By Product Type, 2021 – 2032
9.6.6.3.2 Kids Tablet Market Size & Forecast, By Age Group, 2021 – 2032
9.6.6.3.3 Kids Tablet Market Size & Forecast, By Connectivity, 2021 – 2032
9.6.6.3.4 Kids Tablet Market Size & Forecast, By End-User, 2021 – 2032
9.6.6.4 Egypt
9.6.6.4.1 Kids Tablet Market Size & Forecast, By Product Type, 2021 – 2032
9.6.6.4.2 Kids Tablet Market Size & Forecast, By Age Group, 2021 – 2032
9.6.6.4.3 Kids Tablet Market Size & Forecast, By Connectivity, 2021 – 2032
9.6.6.4.4 Kids Tablet Market Size & Forecast, By End-User, 2021 – 2032
9.6.6.5 South Africa
9.6.6.5.1 Kids Tablet Market Size & Forecast, By Product Type, 2021 – 2032
9.6.6.5.2 Kids Tablet Market Size & Forecast, By Age Group, 2021 – 2032
9.6.6.5.3 Kids Tablet Market Size & Forecast, By Connectivity, 2021 – 2032
9.6.6.5.4 Kids Tablet Market Size & Forecast, By End-User, 2021 – 2032
9.6.6.6 Rest of Middle East & Africa
9.6.6.6.1 Kids Tablet Market Size & Forecast, By Product Type, 2021 – 2032
9.6.6.6.2 Kids Tablet Market Size & Forecast, By Age Group, 2021 – 2032
9.6.6.6.3 Kids Tablet Market Size & Forecast, By Connectivity, 2021 – 2032
9.6.6.6.4 Kids Tablet Market Size & Forecast, By End-User, 2021 – 2032
10. Competitive Landscape
10.1 Key Players' Positioning
10.2 Competitive Developments
10.2.1 Key Strategies Adopted (%), By Key Players, 2024
10.2.2 Year-Wise Strategies & Development, 2021 – 2025
10.2.3 Number Of Strategies Adopted By Key Players, 2024
10.3 Market Share Analysis, 2024
10.4 Product/Service & Application Benchmarking
10.4.1 Product/Service Specifications & Features By Key Players
10.4.2 Product/Service Heatmap By Key Players
10.4.3 Application Heatmap By Key Players
10.5 Industry Start-Up & Innovation Landscape
10.6 Key Company Profiles
10.6.1 Apple Inc.
10.6.1.1 Company Overview & Snapshot
10.6.1.2 Product/Service Portfolio
10.6.1.3 Key Company Financials
10.6.1.4 SWOT Analysis
10.6.2 Samsung Electronics Co., Ltd.
10.6.2.1 Company Overview & Snapshot
10.6.2.2 Product/Service Portfolio
10.6.2.3 Key Company Financials
10.6.2.4 SWOT Analysis
10.6.3 Amazon.com, Inc.
10.6.3.1 Company Overview & Snapshot
10.6.3.2 Product/Service Portfolio
10.6.3.3 Key Company Financials
10.6.3.4 SWOT Analysis
10.6.4 Huawei Technologies Co., Ltd.
10.6.4.1 Company Overview & Snapshot
10.6.4.2 Product/Service Portfolio
10.6.4.3 Key Company Financials
10.6.4.4 SWOT Analysis
10.6.5 Lenovo Group Limited
10.6.5.1 Company Overview & Snapshot
10.6.5.2 Product/Service Portfolio
10.6.5.3 Key Company Financials
10.6.5.4 SWOT Analysis
10.6.6 Microsoft Corporation
10.6.6.1 Company Overview & Snapshot
10.6.6.2 Product/Service Portfolio
10.6.6.3 Key Company Financials
10.6.6.4 SWOT Analysis
10.6.7 AsusTek Computer Inc.
10.6.7.1 Company Overview & Snapshot
10.6.7.2 Product/Service Portfolio
10.6.7.3 Key Company Financials
10.6.7.4 SWOT Analysis
10.6.8 Acer Inc.
10.6.8.1 Company Overview & Snapshot
10.6.8.2 Product/Service Portfolio
10.6.8.3 Key Company Financials
10.6.8.4 SWOT Analysis
10.6.9 Dell Technologies Inc.
10.6.9.1 Company Overview & Snapshot
10.6.9.2 Product/Service Portfolio
10.6.9.3 Key Company Financials
10.6.9.4 SWOT Analysis
10.6.10 LG Electronics Inc.
10.6.10.1 Company Overview & Snapshot
10.6.10.2 Product/Service Portfolio
10.6.10.3 Key Company Financials
10.6.10.4 SWOT Analysis
10.6.11 Google LLC
10.6.11.1 Company Overview & Snapshot
10.6.11.2 Product/Service Portfolio
10.6.11.3 Key Company Financials
10.6.11.4 SWOT Analysis
10.6.12 Kurio
10.6.12.1 Company Overview & Snapshot
10.6.12.2 Product/Service Portfolio
10.6.12.3 Key Company Financials
10.6.12.4 SWOT Analysis
10.6.13 LeapFrog Enterprises, Inc.
10.6.13.1 Company Overview & Snapshot
10.6.13.2 Product/Service Portfolio
10.6.13.3 Key Company Financials
10.6.13.4 SWOT Analysis
10.6.14 Dragon Touch
10.6.14.1 Company Overview & Snapshot
10.6.14.2 Product/Service Portfolio
10.6.14.3 Key Company Financials
10.6.14.4 SWOT Analysis
10.6.15 VTech Holdings Limited
10.6.15.1 Company Overview & Snapshot
10.6.15.2 Product/Service Portfolio
10.6.15.3 Key Company Financials
10.6.15.4 SWOT Analysis
10.6.16 Ematic
10.6.16.1 Company Overview & Snapshot
10.6.16.2 Product/Service Portfolio
10.6.16.3 Key Company Financials
10.6.16.4 SWOT Analysis
10.6.17 Contixo Inc.
10.6.17.1 Company Overview & Snapshot
10.6.17.2 Product/Service Portfolio
10.6.17.3 Key Company Financials
10.6.17.4 SWOT Analysis
10.6.18 Nabi
10.6.18.1 Company Overview & Snapshot
10.6.18.2 Product/Service Portfolio
10.6.18.3 Key Company Financials
10.6.18.4 SWOT Analysis
10.6.19 RCA Tablets
10.6.19.1 Company Overview & Snapshot
10.6.19.2 Product/Service Portfolio
10.6.19.3 Key Company Financials
10.6.19.4 SWOT Analysis
10.6.20 Walmart Inc.
10.6.20.1 Company Overview & Snapshot
10.6.20.2 Product/Service Portfolio
10.6.20.3 Key Company Financials
10.6.20.4 SWOT Analysis
11. Analyst Recommendations
11.1 SNS Insider Opportunity Map
11.2 Industry Low-Hanging Fruit Assessment
11.3 Market Entry & Growth Strategy
11.4 Analyst Viewpoint & Suggestions On Market Growth
12. Assumptions
13. Disclaimer
14. Appendix
14.1 List Of Tables
14.2 List Of Figures
Key Segments:
By Product Type
-
Full-Featured Tablets
-
Budget Kids Tablets
-
E-Readers
-
Hybrid Tablets
By Age Group
-
3-5 Years
-
5-10 Years
-
10-12 Years
By Connectivity
-
Wi-Fi Only
-
Wi-Fi + Cellular
-
Bluetooth Enabled
By End-User
-
Households
-
Educational Institutions
-
Government/NGOs
Request for Segment Customization as per your Business Requirement: Segment Customization Request
Regional Coverage:
North America
-
US
-
Canada
Europe
-
Germany
-
UK
-
France
-
Italy
-
Spain
-
Russia
-
Poland
-
Rest of Europe
Asia Pacific
-
China
-
India
-
Japan
-
South Korea
-
Australia
-
ASEAN Countries
-
Rest of Asia Pacific
Middle East & Africa
-
UAE
-
Saudi Arabia
-
Qatar
-
South Africa
-
Rest of Middle East & Africa
Latin America
-
Brazil
-
Argentina
-
Mexico
-
Colombia
-
Rest of Latin America
Request for Country Level Research Report: Country Level Customization Request
Available Customization
With the given market data, SNS Insider offers customization as per the company’s specific needs. The following customization options are available for the report:
-
Detailed Volume Analysis
-
Criss-Cross segment analysis (e.g. Product X Application)
-
Competitive Product Benchmarking
-
Geographic Analysis
-
Additional countries in any of the regions
-
Customized Data Representation
-
Detailed analysis and profiling of additional market players
An accurate research report requires proper strategizing as well as implementation. There are multiple factors involved in the completion of good and accurate research report and selecting the best methodology to compete the research is the toughest part. Since the research reports we provide play a crucial role in any company’s decision-making process, therefore we at SNS Insider always believe that we should choose the best method which gives us results closer to reality. This allows us to reach at a stage wherein we can provide our clients best and accurate investment to output ratio.
Each report that we prepare takes a timeframe of 350-400 business hours for production. Starting from the selection of titles through a couple of in-depth brain storming session to the final QC process before uploading our titles on our website we dedicate around 350 working hours. The titles are selected based on their current market cap and the foreseen CAGR and growth.
The 5 steps process:
Step 1: Secondary Research:
Secondary Research or Desk Research is as the name suggests is a research process wherein, we collect data through the readily available information. In this process we use various paid and unpaid databases which our team has access to and gather data through the same. This includes examining of listed companies’ annual reports, Journals, SEC filling etc. Apart from this our team has access to various associations across the globe across different industries. Lastly, we have exchange relationships with various university as well as individual libraries.

Step 2: Primary Research
When we talk about primary research, it is a type of study in which the researchers collect relevant data samples directly, rather than relying on previously collected data. This type of research is focused on gaining content specific facts that can be sued to solve specific problems. Since the collected data is fresh and first hand therefore it makes the study more accurate and genuine.
We at SNS Insider have divided Primary Research into 2 parts.
Part 1 wherein we interview the KOLs of major players as well as the upcoming ones across various geographic regions. This allows us to have their view over the market scenario and acts as an important tool to come closer to the accurate market numbers. As many as 45 paid and unpaid primary interviews are taken from both the demand and supply side of the industry to make sure we land at an accurate judgement and analysis of the market.
This step involves the triangulation of data wherein our team analyses the interview transcripts, online survey responses and observation of on filed participants. The below mentioned chart should give a better understanding of the part 1 of the primary interview.

Part 2: In this part of primary research the data collected via secondary research and the part 1 of the primary research is validated with the interviews from individual consultants and subject matter experts.
Consultants are those set of people who have at least 12 years of experience and expertise within the industry whereas Subject Matter Experts are those with at least 15 years of experience behind their back within the same space. The data with the help of two main processes i.e., FGDs (Focused Group Discussions) and IDs (Individual Discussions). This gives us a 3rd party nonbiased primary view of the market scenario making it a more dependable one while collation of the data pointers.
Step 3: Data Bank Validation
Once all the information is collected via primary and secondary sources, we run that information for data validation. At our intelligence centre our research heads track a lot of information related to the market which includes the quarterly reports, the daily stock prices, and other relevant information. Our data bank server gets updated every fortnight and that is how the information which we collected using our primary and secondary information is revalidated in real time.

Step 4: QA/QC Process
After all the data collection and validation our team does a final level of quality check and quality assurance to get rid of any unwanted or undesired mistakes. This might include but not limited to getting rid of the any typos, duplication of numbers or missing of any important information. The people involved in this process include technical content writers, research heads and graphics people. Once this process is completed the title gets uploader on our platform for our clients to read it.
Step 5: Final QC/QA Process:
This is the last process and comes when the client has ordered the study. In this process a final QA/QC is done before the study is emailed to the client. Since we believe in giving our clients a good experience of our research studies, therefore, to make sure that we do not lack at our end in any way humanly possible we do a final round of quality check and then dispatch the study to the client.