Gas To Liquid (GTL) Market Report Scope & Overview:
Get more information on Gas To Liquid Market - Request Sample Report
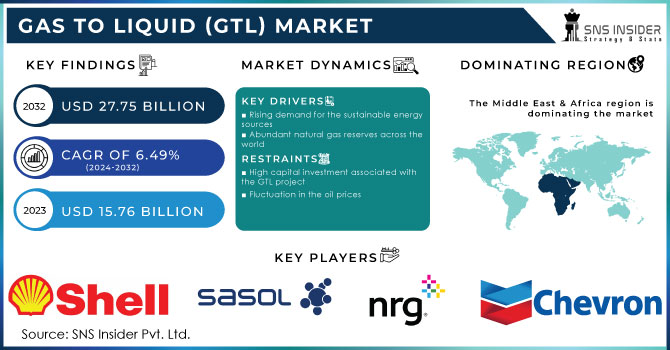
The Gas To Liquid (GTL) Market size was valued at USD 15.76 billion in 2023 and is expected to reach USD 27.75 billion by 2032 with a growing CAGR of 6.49% over the forecast period of 2024-2032.
Gas to Liquid (GTL) technology is a revolutionary process that converts natural gas into high-quality liquid fuels. This innovative method offers numerous benefits, including increased energy efficiency, reduced emissions, and enhanced sustainability. GTL technology involves the conversion of natural gas, primarily methane, into liquid hydrocarbons through a series of chemical reactions. This process, known as Fischer-Tropsch synthesis, utilizes catalysts to transform gaseous hydrocarbons into liquid fuels, such as diesel, kerosene, and naphtha. The resulting products possess excellent combustion properties, making them suitable for various applications, including transportation, power generation, and industrial processes. GTL technology offers higher energy efficiency compared to traditional refining processes. By converting natural gas directly into liquid fuels, GTL eliminates the energy-intensive steps involved in crude oil refining, resulting in reduced energy consumption and lower greenhouse gas emissions. GTL fuels exhibit lower levels of harmful pollutants, such as sulfur, nitrogen oxides, and particulate matter, compared to conventional diesel. This reduction in emissions contributes to improved air quality and mitigates the environmental impact of transportation and industrial activities.
Additionally, GTL fuels have a higher cetane number, which improves combustion efficiency and reduces engine noise. Furthermore, the gas-to-liquid market has the potential to diversify energy sources and reduce dependence on crude oil. Natural gas reserves are abundant worldwide, and GTL technology allows for the monetization of these reserves. This can lead to increased energy security and stability, as countries can rely on their own gas resources rather than importing oil.
The market for gas-to-liquid products is expected to witness substantial growth in the coming years. The rising demand for cleaner fuels, coupled with advancements in GTL technology, is driving this growth. Moreover, the increasing focus on environmental sustainability and stricter regulations on emissions are further propelling the market. However, the gas-to-liquid market also faces certain challenges. The high capital costs associated with building GTL plants and the complex nature of the technology pose barriers to entry. Additionally, the market is highly dependent on natural gas prices, which can be volatile. These factors require careful consideration and strategic planning for companies operating in this sector.
Market Dynamics
Drivers
-
Rising demand for the sustainable energy sources
-
Abundant natural gas reserves across the world
With the discovery of new gas fields and advancements in extraction techniques, the availability of feedstock for GTL production has significantly increased. This factor, coupled with the rising global energy demand, creates a favorable environment for GTL market growth.
Restrain
-
High capital investment associated with the GTL project
-
Fluctuation in the oil prices
The gas-to-liquid market faces challenges due to the unpredictable nature of oil prices. When oil prices fluctuate, it directly impacts the profitability and viability of gas-to-liquid projects. When oil prices are high, it becomes more expensive to produce gas-to-liquid products. The cost of raw materials, such as natural gas, increases, which in turn affects the overall production costs. This can lead to reduced profit margins or even losses for companies involved in gas-to-liquid operations. Conversely, when oil prices are low, it may seem like an advantageous situation for the gas-to-liquid market. However, this is not always the case. Low oil prices can discourage investment in gas-to-liquid projects as they may not be financially viable. Investors may choose to allocate their resources to other sectors with more stable returns. Furthermore, fluctuations in oil prices can also impact the demand for gas-to-liquid products. When oil prices are high, consumers tend to seek alternative energy sources, including gas-to-liquid products, as they become relatively more affordable. However, when oil prices drop, consumers may switch back to traditional petroleum-based products, as they become more cost-effective.
Opportunities
-
Growing focus on clean energy sources
-
Increasing demand for transportation from various nation
The gas-to-liquid market is experiencing a surge in opportunities due to the growing demand for transportation services worldwide. As countries continue to develop and expand their economies, the need for efficient and reliable transportation systems becomes paramount. One of the primary reasons behind this increasing demand is the ever-growing population, which leads to a higher need for transportation infrastructure. As more people require mobility for work, education, and leisure, the demand for vehicles and fuel rises accordingly. However, traditional petroleum-based fuels have limitations in terms of availability and environmental impact. GTL technology converts natural gas into high-quality liquid fuels, such as diesel, kerosene, and naphtha. These fuels offer several advantages over conventional petroleum-based fuels, including cleaner emissions, improved fuel efficiency, and reduced carbon footprint. Furthermore, the gas-to-liquid process provides a solution to the limited availability of petroleum reserves. Natural gas, which is abundant in many regions, can be utilized as a reliable and sustainable alternative. This not only ensures a more secure energy supply but also reduces dependence on oil-producing nations.
Challenges
-
Complex and technologically advanced nature of GTL processes
Impact of Russia-Ukraine War:
The Russia-Ukraine war has caused a disruption in the gas-to-liquid market. The European Union heavily relies on Russian pipelines for approximately 45% of its natural gas supply, with a quarter of that passing through Ukraine. Germany, in particular, depends on Russia for about 50% of its natural gas needs. Unfortunately, the conflict has resulted in a decrease in gas supplies from Russia to Ukraine, which has had a negative impact on the gas-to-liquid market. This reduction in supply has led to a surge in gas prices, making it increasingly expensive for companies to produce gas-to-liquid products. As a consequence, the United States experienced a staggering increase in gas prices, with a rise of $1.49 per gallon, equivalent to a 43% surge, reaching a record high of $5.12 between February 21, 2022, and June 14, 2022. Furthermore, the war has created an atmosphere of uncertainty and instability, which has deterred potential investors from entering the market. The fear of political and economic repercussions has made many hesitant to invest in gas-to-liquid projects, leading to a slowdown in industry growth.
Impact of Recession:
One of the primary consequences of the recession on the GTL market has been a reduction in investment. As economic uncertainty looms, investors have become more cautious, resulting in a decline in funding for GTL projects. This lack of financial support has hindered the development and expansion of the GTL industry, limiting its potential growth. The recession has also led to a decrease in GTL production. With reduced investment, companies have been forced to scale back their operations, resulting in lower output levels. This decline in production has not only affected the profitability of GTL projects but has also impacted the availability of GTL products in the market.
Furthermore, the recession has caused a shift in energy priorities. As countries face economic challenges, their focus has shifted towards more cost-effective energy sources. This shift has diverted attention away from GTL projects, as they often require substantial investment and have higher production costs compared to traditional fossil fuels. Consequently, the recession has hindered the growth of the GTL market by altering energy preferences.
Key Market Segmentation
By Technology
-
Fischer-Tropsch (FT)
-
Methanol to Gasoline (MTG)
-
Syngas
By Product Type
-
GTL Diesel
-
GTL Naphtha
By Application
-
Fuel Oil
-
Lubricating Oil
-
Process Oil
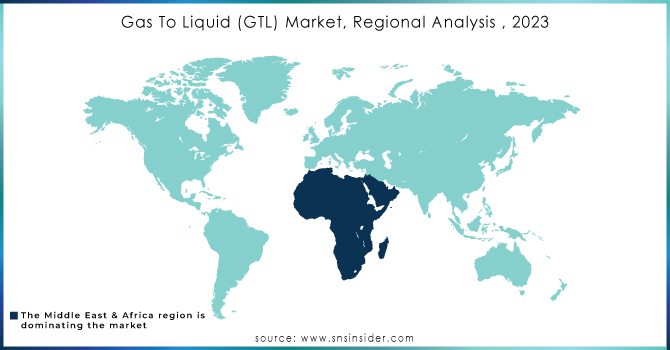
Regional Analysis
The Middle East & Africa region is the dominating region in the Gas To Liquid (GTL) market. One of the primary driving factors for this dominance is the abundance of natural gas reserves in this region. Countries like Iran, Qatar, Nigeria, and South Africa possess vast reserves of natural gas, providing a solid foundation for GTL projects. In 2022, Iran had the highest natural gas reserves among other Middle Eastern countries, amounting to approximately 34 trillion cubic meters. In contrast, Qatar held about 26.8 trillion cubic meters of natural gas reserves and Egypt held nearly 3 trillion cubic meters of natural gas reserves in the same year. These reserves not only ensure a steady supply of feedstock but also reduce transportation costs, making the GTL process economically viable. Furthermore, the Middle East & African region benefit from favorable government policies and support for GTL initiatives. Governments in these countries have recognized the potential of GTL technology in diversifying their economies and reducing their dependence on oil exports. As a result, they have implemented policies that encourage investment in GTL projects, providing incentives and creating a conducive business environment. Another crucial aspect contributing to the region's dominance is the presence of established GTL infrastructure. The Middle East & Africa region boasts several world-class GTL plants, which have been operational for years. These plants have not only demonstrated the commercial viability of GTL technology but have also developed expertise and knowledge in the field. This experience gives the region a competitive edge, attracting further investments and fostering technological advancements. Moreover, the Middle East & Africa region's strategic geographical location plays a significant role in its dominance. Situated between major gas-producing regions and global markets, it offers.
The Asia Pacific region is estimated to grow with the highest CAGR during the forecast period in the Gas to Liquid market. With countries like China, India, and Australia leading the way, the Asia Pacific region possesses a significant resource base to support the development of GTL facilities. Furthermore, the increasing demand for cleaner and more sustainable energy sources in the region is driving the growth of the GTL market. As countries strive to reduce their carbon footprint and comply with stringent environmental regulations, the conversion of natural gas into cleaner liquid fuels becomes an attractive solution. GTL technology offers a viable alternative to traditional fossil fuels, contributing to a greener and more sustainable energy landscape.
Get Customized Report as per your Business Requirement - Request For Customized Report
REGIONAL COVERAGE:
North America
-
US
-
Canada
-
Mexico
Europe
-
Eastern Europe
-
Poland
-
Romania
-
Hungary
-
Turkey
-
Rest of Eastern Europe
-
-
Western Europe
-
Germany
-
France
-
UK
-
Italy
-
Spain
-
Netherlands
-
Switzerland
-
Austria
-
Rest of Western Europe
-
Asia Pacific
-
China
-
India
-
Japan
-
South Korea
-
Vietnam
-
Singapore
-
Australia
-
Rest of Asia Pacific
Middle East & Africa
-
Middle East
-
UAE
-
Egypt
-
Saudi Arabia
-
Qatar
-
Rest of Middle East
-
-
Africa
-
Nigeria
-
South Africa
-
Rest of Africa
-
Latin America
-
Brazil
-
Argentina
-
Colombia
-
Rest of Latin America
Key Players
The major key players are Chevron Corporation, NRG Energy, Royal Dutch Shell, Sasol Limited, Gas Techno, Linc Energy, Petro SA, Velocys PLC, ORYX GTL, Compact GTL, and other key players mentioned in the final report.
Recent Developments:
-
In Jan 2023, PetroSA planned to fully reinstate its Mossel Bay production assets, which consist of the FA Platform and GTL refinery (gas loop and liquids refinery). These assets were previously suspended in 2020 due to feedstock challenges. The company aims to resume production as quickly as possible while keeping costs at a minimum.
| Report Attributes | Details |
| Market Size in 2023 | US$ 15.76 Bn |
| Market Size by 2032 | US$ 27.75 Bn |
| CAGR | CAGR of 6.49% From 2024 to 2032 |
| Base Year | 2023 |
| Forecast Period | 2024-2032 |
| Historical Data | 2020-2022 |
| Report Scope & Coverage | Market Size, Segments Analysis, Competitive Landscape, Regional Analysis, DROC & SWOT Analysis, Forecast Outlook |
| Key Segments | • By Technology (Fischer-Tropsch (FT), Methanol to Gasoline (MTG), and Syngas) • By Product Type (GTL Diesel and GTL Naphtha) • By Application (Fuel Oil, Lubricating Oil, and Process Oil) |
| Regional Analysis/Coverage | North America (US, Canada, Mexico), Europe (Eastern Europe [Poland, Romania, Hungary, Turkey, Rest of Eastern Europe] Western Europe] Germany, France, UK, Italy, Spain, Netherlands, Switzerland, Austria, Rest of Western Europe]). Asia Pacific (China, India, Japan, South Korea, Vietnam, Singapore, Australia, Rest of Asia Pacific), Middle East & Africa (Middle East [UAE, Egypt, Saudi Arabia, Qatar, Rest of Middle East], Africa [Nigeria, South Africa, Rest of Africa], Latin America (Brazil, Argentina, Colombia Rest of Latin America) |
| Company Profiles | Chevron Corporation, NRG Energy, Royal Dutch Shell, Sasol Limited, Gas Techno, Linc Energy, Petro SA, Velocys PLC, ORYX GTL, Compact GTL |
| Key Drivers | • Rising demand for the sustainable energy sources • Abundant natural gas reserves across the world |
| Market Restraints | • High capital investment associated with the GTL project • Fluctuation in the oil prices |
Get in Touch
