image

Carbon Offset/Carbon Credit Market Report Scope & Overview:
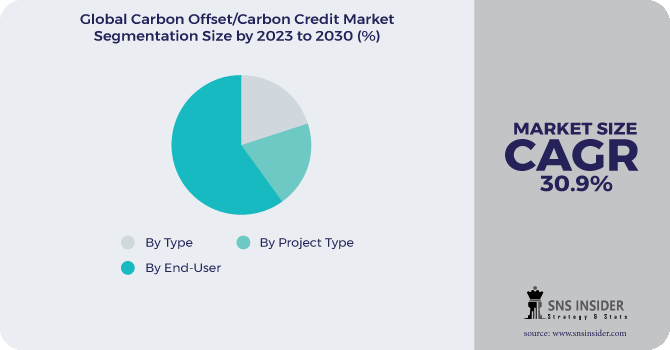
Carbon Offset/Carbon Credit Market size was valued at USD 319.26 billion in 2022 and is expected to grow to USD 2752.08 billion by 2030 and grow at a CAGR of 30.9% over the forecast period of 2023-2030.

Carbon offset and carbon credits are terms used in the field of environmental sustainability. Carbon offset refers to the practice of compensating for carbon emissions by investing in projects that reduce or remove carbon from the atmosphere. Carbon credits, on the other hand, are a tradable commodity that represents a reduction in greenhouse gas emissions. To put it simply, carbon offset and carbon credits are ways to mitigate the negative impact of carbon emissions on the environment. By investing in carbon offset projects or purchasing carbon credits, individuals and businesses can take responsibility for their carbon footprint and contribute to the fight against climate change. It is important to note that carbon offset and carbon credits are not a substitute for reducing carbon emissions. They should be used in conjunction with efforts to reduce emissions in order to achieve a more sustainable future.

Carbon Offset/Carbon Credit Market Revenue Analysis

The carbon offset/carbon credit market has gained significant attention in recent years as a means of mitigating the impact of climate change. However, it is important to note that the carbon offset/carbon credit market is not a silver bullet solution to climate change. It is just one tool in a larger toolkit that must be used in conjunction with other measures, such as reducing emissions at the source and transitioning to renewable energy sources. Furthermore, the carbon offset/carbon credit market is not without its criticisms and challenges. Some argue that it allows individuals and organizations to continue emitting carbon without making significant changes to their behavior or operations. Others point out that the market can be complex and difficult to navigate, with varying standards and regulations across different countries and industries.

Market Dynamics

Drivers

  • Increasing awareness about global warming due to the emission of greenhouse gases

  • Policies and regulations imposed by the Government to reduce carbon emissions

  • Rising investment in carbon capture and removal technologies

  • Growing number of markets allowing partial use of carbon offsets

The partial use of carbon offset is increasing in a number of markets. This trend is gaining momentum as more and more companies seek to reduce their carbon footprint and meet sustainability goals. Carbon offsets are a way for companies to offset their carbon emissions by investing in projects that reduce greenhouse gas emissions elsewhere. However, some markets only allow a portion of a company's emissions to be offset through carbon credits. This is where the partial use of carbon offsets comes into play. Companies can still invest in carbon reduction projects, but only a portion of their emissions can be offset through these projects. This approach has its advantages and disadvantages. On the one hand, it allows companies to take steps towards reducing their carbon footprint, even if they cannot completely eliminate it. This factor boosts the growth of the carbon offset/carbon credit market.

Restrain

  • High costs associated with carbon offset/carbon credit strategies

Opportunities

  • Expansion of the carbon offset projects

  • Development of carbon trading schemes internationally

  • Increasing environmental concern with government support

The government has implemented strict rules and regulations to mitigate the impact of carbon footprints. The industrialization has led to an increase in greenhouse emissions, which has polluted the environment and necessitated the development of techniques to reduce these effects. Carbon offset and carbon credits are strategies that aid in reducing carbon footprints. As a result, the carbon offset/carbon credit market presents numerous opportunities in the upcoming year.

Challenges

  •  Volatile prices of carbon credits

Impact of COVID-19

The COVID-19 pandemic impacted the carbon offset/carbon credit market. During the COVID-19 period, there were 13 carbon credit bubbles that exhibited the LPPL signature when re-calibrated using the Filimonov and Sornette (2013) LPPL equation. Additionally, it was observed that the average drawdown of these bubbles was twice that of S&P-500 listed stocks (54% vs. 27%) under the challenging conditions of the COVID-19 pandemic. carbon credit bubbles refer to the fluctuation in the price of carbon credits, which are tradable permits that allow companies to emit a certain amount of carbon dioxide. The significant drawdown observed in these bubbles during the COVID-19 period highlights the vulnerability of carbon credit markets to external shocks

The market, which was already facing challenges due to the lack of a global carbon pricing mechanism, has been further disrupted by the pandemic. One of the main impacts of COVID-19 on the carbon offset/carbon credit market has been the reduction in demand. With many businesses and industries shutting down or reducing their operations, there has been a decrease in the amount of carbon emissions being produced. This has led to a decrease in the demand for carbon offsets and credits, as companies are not as motivated to offset their emissions. Another impact of COVID-19 on the carbon offset/carbon credit market has been the disruption of supply chains. Many carbon offset projects, such as renewable energy projects, have been delayed or canceled due to the pandemic. This has led to a decrease in the supply of carbon offsets and credits, which has further impacted the market. However, there have been some positive developments in the carbon offset/carbon credit market during the pandemic. For example, some companies have continued to invest in carbon offset projects as part of their sustainability goals. Additionally, there has been a growing interest in nature-based solutions, such as reforestation and conservation projects, which can help to offset carbon emissions.

Impact of Russia-Ukraine War:

Russia's invasion of Ukraine has had a significant impact on the global energy market, leading to an increase in fossil fuel demand and carbon emissions. As a result, companies are now seeking carbon credits to offset their emissions, which is driving up carbon prices. The volatility of carbon prices has been particularly evident since the start of the conflict in March 2022, with EU carbon allowance prices plummeting by almost 42% in just one week before rebounding sharply. Despite the recent increase in carbon prices, the EU Emissions Trading System (ETS) has experienced a significant crash since the start of the conflict. Inflation and rising energy prices had previously driven the price of a carbon permit to a high of €97 in early February, but the imposition of sanctions against Russia has caused a sharp decline in the market. In addition to the economic impact, the war has also had environmental consequences. The conflict has led to an increase in emissions from military activities, which has further contributed to climate change. This has made it even more important for the global community to support carbon offset and carbon credit projects in other regions.

Impact of Recession:

The recent recession impacted various sectors including the carbon offset/carbon credit market. The recession has caused many businesses to cut back on their carbon reduction efforts, as they focus on staying afloat and maintaining profitability. This has led to a decrease in demand for carbon offsets and credits, as companies are less willing to invest in these initiatives. Additionally, the recession has led to a decrease in overall economic activity, which has resulted in a decrease in carbon emissions. This has further reduced the demand for carbon offsets and credits. The decline in demand for carbon offsets and credits has led to a decrease in prices, which has made it more difficult for companies that rely on these markets to generate revenue. This has had a ripple effect throughout the industry, as companies that provide carbon offset and credit services have also been impacted.

Market segmentation

By Type:

  • Voluntary Market

  • Compliance Market

By Project Type:

  • Removal Project

  • Avoidance/Reduction projects

By End-user:

  • Energy

  • Transportation

  • Aviation

  • Power

  • Buildings

  • Industrial

  • Others

Carbon Offset/Carbon Credit Market Segmentation Analysis

Regional Analysis

The Asia Pacific region is projected to experience the highest compound annual growth rate (CAGR) in the carbon offset/carbon credit market during the forecast period. This is attributed to the region's increasing focus on sustainability and environmental protection, as well as the growing demand for carbon credits from businesses and governments. One of the main drivers of growth in the Asia Pacific carbon offset/carbon credit market is the region's commitment to reducing greenhouse gas emissions. Many countries in the region have set ambitious targets for reducing their carbon footprint, and are actively seeking ways to achieve these goals. This has led to a surge in demand for carbon credits, which allow businesses and governments to offset their emissions by investing in projects that reduce carbon emissions elsewhere. Another factor contributing to the growth of the Asia Pacific carbon offset/carbon credit market is the region's rapidly expanding economy. As more businesses and industries emerge in the region, there is a greater need for sustainable practices and environmental protection. This has led to an increase in demand for carbon credits, as businesses seek to demonstrate their commitment to sustainability and reduce their environmental impact.

REGIONAL COVERAGE:

  • North America

    • USA

    • Canada

    • Mexico

  • Europe

    • Germany

    • UK

    • France

    • Italy

    • Spain

    • The Netherlands

    • Rest of Europe

  • Asia-Pacific

    • Japan

    • south Korea

    • China

    • India

    • Australia

    • Rest of Asia-Pacific

  • The Middle East & Africa

    • Israel

    • UAE

    • South Africa

    • Rest of the Middle East & Africa

  • Latin America

    • Brazil

    • Argentina

    • Rest of Latin America

Key Players

The major key players are 3Degrees, Finite Carbon, South Pole Group, EKI Energy Service Limited, Terrapass, Carbon Credit Capital, CarbonBetter, Carbon Care Asia Limited, NativeEnergy, Climate Trade, and other key players will be included in the final report.

3Degrees-Company Financial Analysis

Company Landscape Analysis

Recent Development:

  • In March of 2023, EKI, a prominent developer and supplier of carbon credits worldwide, made its partnership with WOCE Solutions Pvt. Ltd. This collaboration will enable organizations to better comprehend and implement the concept of capturing carbon footprints through innovative product offerings.

  • EKI Energy Services experienced a 1.80% rise in stock value, reaching Rs 700.30. This increase was due to the company's recent signing of a Memorandum of Understanding (MOU) with UK-based Inclusive Energy.

  • In June of 2022, CarbonBetter launched its Certified Offset Portfolio 22-1. This innovative program provides businesses with immediate access to a carefully curated selection of carbon credits from the 2020-2021 vintage. These credits are fully vetted and hand-picked to offset greenhouse gas emissions across all three scopes. The Certified Offset Portfolio 22-1 includes a diverse range of projects, such as a run-of-river hydroelectric power plant, an improved forest management initiative, an N20 abatement project, and a wind farm. Each unit of the Portfolio offsets one metric ton of carbon emissions, and every purchase includes offsets from each project in the Portfolio.

Carbon Offset/Carbon Credit Market Report Scope:
Report Attributes Details
Market Size in 2022  US$ 319.26 Bn
Market Size by 2030  US$ 2752.08 Bn
CAGR   CAGR of 30.9% From 2023 to 2030
Base Year  2022
Forecast Period  2023-2030
Historical Data  2020-2021
Report Scope & Coverage Market Size, Segments Analysis, Competitive  Landscape, Regional Analysis, DROC & SWOT Analysis, Forecast Outlook
Key Segments • By Type (Voluntary Market and Compliance Market)
• By Project Type (Removal Project and Avoidance/Reduction projects)
• By End-user (Energy, Transportation, Aviation, Power, Buildings, Industrial, and Others)
Regional Analysis/Coverage North America (USA, Canada, Mexico), Europe
(Germany, UK, France, Italy, Spain, Netherlands,
Rest of Europe), Asia-Pacific (Japan, South Korea,
China, India, Australia, Rest of Asia-Pacific), The
Middle East & Africa (Israel, UAE, South Africa,
Rest of Middle East & Africa), Latin America (Brazil, Argentina, Rest of Latin America)
Company Profiles 3Degrees, Finite Carbon, South Pole Group, EKI Energy Service Limited, Terrapass, Carbon Credit Capital, CarbonBetter, Carbon Care Asia Limited, NativeEnergy, Climate Trade
Key Drivers • Increasing awareness about global warming due to the emission of greenhouse gases
• Policies and regulations imposed by the Government to reduce carbon emissions
Market Opportunities • Expansion of the carbon offset projects
• Development of carbon trading schemes internationally


Frequently Asked Questions

Ans: The expected CAGR of the global Carbon Offset/Carbon Credit Market during the forecast period is 30.9%.

Ans: The market size of the Carbon Offset/Carbon Credit Market is USD 319.26 billion in 2022.

Ans: The major key players in the Carbon Offset/Carbon Credit Market are 3Degrees, Finite Carbon, South Pole Group, EKI Energy Service Limited, Terrapass, Carbon Credit Capital, CarbonBetter, Carbon Care Asia Limited, NativeEnergy, and Climate Trade.

 Ans: Asia Pacific region is expected to grow with the highest CAGR during the forecast period in Carbon Offset/Carbon Credit Market.

Ans: Increasing awareness about global warming due to the emission of greenhouse gases, policies and regulations imposed by the Government to reduce carbon emissions, rising investment in carbon capture and removal technologies, and the growing number of markets allowing partial use of carbon offsets are the driving factors of the Carbon Offset/Carbon Credit Market.

Table of Contents

1. Introduction
1.1 Market Definition
1.2 Scope
1.3 Research Assumptions

2. Research Methodology

3. Market Dynamics
3.1 Drivers
3.2 Restraints
3.3 Opportunities
3.4 Challenges

4. Impact Analysis
4.1 COVID-19 Impact Analysis
4.2 Impact of Ukraine- Russia War
4.3 Impact of Ongoing Recession
4.3.1 Introduction
4.3.2 Impact on major economies
4.3.2.1 US
4.3.2.2 Canada
4.3.2.3 Germany
4.3.2.4 France
4.3.2.5 United Kingdom
4.3.2.6 China
4.3.2.7 Japan
4.3.2.8 South Korea
4.3.2.9 Rest of the World

5. Value Chain Analysis

6. Porter’s 5 forces model

7. PEST Analysis

8. Carbon Offset/Carbon Credit Market Segmentation, By Type
8.1 Voluntary Market
8.2 Compliance Market

9. Carbon Offset/Carbon Credit Market Segmentation, By Project Type
9.1 Removal Project
9.2 Avoidance/Reduction Projects

10. Carbon Offset/Carbon Credit Market Segmentation, By End-users
10.1 Energy
10.2 Transportation
10.3 Aviation
10.4 Power
10.5 Buildings
10.6 Industrial
10.7 Others

11. Regional Analysis
11.1 Introduction
11.2 North America
11.2.1 North America Carbon Offset/Carbon Credit Market by Country
11.2.2North America Carbon Offset/Carbon Credit Market by Type
11.2.3 North America Carbon Offset/Carbon Credit Market by Project Type
11.2.4 North America Carbon Offset/Carbon Credit Market by End-users
11.2.5 USA
11.2.5.1 USA Carbon Offset/Carbon Credit Market by Type
11.2.5.2 USA Carbon Offset/Carbon Credit Market by Project Type
11.2.5.3 USA Carbon Offset/Carbon Credit Market by End-users
11.2.6 Canada
11.2.6.1 Canada Carbon Offset/Carbon Credit Market by Type
11.2.6.2 Canada Carbon Offset/Carbon Credit Market by Project Type
11.2.6.3 Canada Carbon Offset/Carbon Credit Market by End-users
11.2.7 Mexico
11.2.7.1 Mexico Carbon Offset/Carbon Credit Market by Type
11.2.7.2 Mexico Carbon Offset/Carbon Credit Market by Project Type
11.2.7.3 Mexico Carbon Offset/Carbon Credit Market by End-users
11.3 Europe
11.3.1 Europe Carbon Offset/Carbon Credit Market by Country
11.3.2 Europe Carbon Offset/Carbon Credit Market by Type
11.3.3 Europe Carbon Offset/Carbon Credit Market by Project Type
11.3.4Europe Carbon Offset/Carbon Credit Market by End-users
11.3.5Germany
11.3.5.1 Germany Carbon Offset/Carbon Credit Market by Type
11.3.5.2 Germany Carbon Offset/Carbon Credit Market by Project Type
11.3.5.3 Germany Carbon Offset/Carbon Credit Market by End-users
11.3.6 UK
11.3.6.1 UK Carbon Offset/Carbon Credit Market by Type
11.3.6.2 UK Carbon Offset/Carbon Credit Market by Project Type
11.3.6.3 UK Carbon Offset/Carbon Credit Market by End-users
11.3.7 France
11.3.7.1 France Carbon Offset/Carbon Credit Market by Type
11.3.7.2 France Carbon Offset/Carbon Credit Market by Project Type
11.3.7.3 France Carbon Offset/Carbon Credit Market by End-users
11.3.8 Italy
11.3.8.1 Italy Carbon Offset/Carbon Credit Market by Type
11.3.8.2 Italy Carbon Offset/Carbon Credit Market by Project Type
11.3.8.3 Italy Carbon Offset/Carbon Credit Market by End-users
11.3.9 Spain
11.3.9.1 Spain Carbon Offset/Carbon Credit Market by Type
11.3.9.2 Spain Carbon Offset/Carbon Credit Market by Project Type
11.3.9.3 Spain Carbon Offset/Carbon Credit Market by End-users
11.3.10 The Netherlands
11.3.10.1 Netherlands Carbon Offset/Carbon Credit Market by Type
11.3.10.2 Netherlands Carbon Offset/Carbon Credit Market by Project Type
11.3.10.3 Netherlands Carbon Offset/Carbon Credit Market by End-users
11.3.11 Rest of Europe
11.3.11.1 Rest of Europe Carbon Offset/Carbon Credit Market by Type
11.3.11.2 Rest of Europe Carbon Offset/Carbon Credit Market by Project Type
11.3.11.3 Rest of Europe Carbon Offset/Carbon Credit Market by End-users
11.4 Asia-Pacific
11.4.1 Asia Pacific Carbon Offset/Carbon Credit Market by Country
11.4.2Asia Pacific Carbon Offset/Carbon Credit Market by Type
11.4.3 Asia Pacific Carbon Offset/Carbon Credit Market by Project Type
11.4.4 Asia Pacific Carbon Offset/Carbon Credit Market by End-users
11.4.5 Japan
11.4.5.1 Japan Carbon Offset/Carbon Credit Market by Type
11.4.5. 2Japan Carbon Offset/Carbon Credit Market by Project Type
11.4.5. 3Japan Carbon Offset/Carbon Credit Market by End-users
11.4.6 South Korea
11.4.6.1 South Korea Carbon Offset/Carbon Credit Market by Type
11.4.6.2. South Korea Carbon Offset/Carbon Credit Market by Project Type
11.4.6.3. South Korea Carbon Offset/Carbon Credit Market by End-users
11.4.7China
11.4.7.1 China Carbon Offset/Carbon Credit Market by Type
11.4.7.2. China Carbon Offset/Carbon Credit Market by Project Type
11.4.7.3. China Carbon Offset/Carbon Credit Market by End-users
11.4.8 India
11.4.8.1 India Carbon Offset/Carbon Credit Market by Type
11.4.8.2. India Carbon Offset/Carbon Credit Market by Project Type
11.4.8.3 India Carbon Offset/Carbon Credit Market by End-users
11.4.9Australia
11.4.8.1 Australia Carbon Offset/Carbon Credit Market by Type
11.4.8.2. Australia Carbon Offset/Carbon Credit Market by Project Type
11.4.8.3. Australia Carbon Offset/Carbon Credit Market by End-users
11.4.10Rest of Asia-Pacific
11.4.10.1 APAC Carbon Offset/Carbon Credit Market by Type
11.4.10.2. APAC Carbon Offset/Carbon Credit Market by Project Type
11.4.10.3. APAC Carbon Offset/Carbon Credit Market by End-users
11.5 The Middle East & Africa
11.5.1 The Middle East & Africa Carbon Offset/Carbon Credit Market by Country
11.5.2 The Middle East & Africa Carbon Offset/Carbon Credit Market by Type
11.5.3The Middle East & Africa Carbon Offset/Carbon Credit Market by Project Type
11.5.4The Middle East & Africa Carbon Offset/Carbon Credit Market by End-users
11.5.5Israel
11.5.5.1 Israel Carbon Offset/Carbon Credit Market by Type
11.5.5.2 Israel Carbon Offset/Carbon Credit Market by Project Type
11.5.5.3 Israel Carbon Offset/Carbon Credit Market by End-users
11.5.6 UAE
11.5.6.1 UAE Carbon Offset/Carbon Credit Market by Type
11.5.6.2 Israel Carbon Offset/Carbon Credit Market by Project Type
11.5.6.3 Israel Carbon Offset/Carbon Credit Market by End-users
11.5.7South Africa
11.5.7.1 South Africa Carbon Offset/Carbon Credit Market by Type
11.5.7.2 South Africa Carbon Offset/Carbon Credit Market by Project Type
11.5.7.3 South Africa Carbon Offset/Carbon Credit Market by End-users
11.5.8 Rest of Middle East & Africa
11.5.8.1 Rest of Middle East & Asia Carbon Offset/Carbon Credit Market by Type
11.5.8.2 Rest of Middle East & Asia Carbon Offset/Carbon Credit Market by Project Type
11.5.8.3 Rest of Middle East & Asia Carbon Offset/Carbon Credit Market by End-users
11.6 Latin America
11.6.1 Latin America Carbon Offset/Carbon Credit Market by Country
11.6.2. Latin America Carbon Offset/Carbon Credit Market by Type
11.6.3 Latin America Carbon Offset/Carbon Credit Market by Project Type
11.6.4 Latin America Carbon Offset/Carbon Credit Market by End-users
11.6.5 Brazil
11.6.5.1 Brazil Carbon Offset/Carbon Credit Market by Type
11.6.5.2 Brazil Carbon Offset/Carbon Credit Market by Project Type
11.6.5.3Brazil Carbon Offset/Carbon Credit Market by End-users
11.6.6 Argentina
11.6.6.1 Argentina Carbon Offset/Carbon Credit Market by Type
11.6.6.2 Argentina Carbon Offset/Carbon Credit Market by Project Type
11.6.6.3 Argentina Carbon Offset/Carbon Credit Market by End-users
11.6.7 Rest of Latin America
11.6.7.1 Rest of Latin America Carbon Offset/Carbon Credit Market by Type
11.6.7.2 Rest of Latin America Carbon Offset/Carbon Credit Market by Project Type
11.6.7.3Rest of Latin America Carbon Offset/Carbon Credit Market by End-users

12 Company Profile
12.1 3Degrees
12.1.1 Market Overview
12.1.2 Financials
12.1.3 Product/Services/Offerings
12.1.4 SWOT Analysis
12.1.5 The SNS View
12.2 Finite Carbon
12.2.1 Market Overview
12.2.2 Financials
12.2.3 Product/Services/Offerings
12.2.4 SWOT Analysis
12.2.5 The SNS View
12.3 South Pole Group
12.3.1 Market Overview
12.3.2 Financials
12.3.3 Product/Services/Offerings
12.3.4 SWOT Analysis
12.3.5 The SNS View
12.4 EKI Energy Service Limited
12.4.1 Market Overview
12.4.2 Financials
12.4.3 Product/Services/Offerings
12.4.4 SWOT Analysis
12.4.5 The SNS View
12.5 Terrapass
12.5.1 Market Overview
12.5.2 Financials
12.5.3 Product/Services/Offerings
12.5.4 SWOT Analysis
12.5.5 The SNS View
12.6 Carbon Credit Capital
12.6.1 Market Overview
12.6.2 Financials
12.6.3 Product/Services/Offerings
12.6.4 SWOT Analysis
12.6.5 The SNS View
12.7 CarbonBetter
12.7.1 Market Overview
12.7.2 Financials
12.7.3 Product/Services/Offerings
12.7.4 SWOT Analysis
12.7.5 The SNS View
12.8 Carbon Care Asia Limited
12.8.1 Market Overview
12.8.2 Financials
12.8.3 Product/Services/Offerings
12.8.4 SWOT Analysis
12.8.5 The SNS View
12.9 NativeEnergy
12.9.1 Market Overview
12.9.2 Financials
12.9.3 Product/Services/Offerings
12.9.4 SWOT Analysis
12.9.5 The SNS View
12.10 Climate Trade
12.10.1 Market Overview
12.10.2 Financials
12.10.3 Product/Services/Offerings
12.10.4 SWOT Analysis
12.10.5 The SNS View

13. Competitive Landscape
13.1 Competitive Benchmarking
13.2 Market Share Analysis
13.3 Recent Developments

14. Use Cases and Best Practices

15. Conclusion

An accurate research report requires proper strategizing as well as implementation. There are multiple factors involved in the completion of good and accurate research report and selecting the best methodology to compete the research is the toughest part. Since the research reports we provide play a crucial role in any company’s decision-making process, therefore we at SNS Insider always believe that we should choose the best method which gives us results closer to reality. This allows us to reach at a stage wherein we can provide our clients best and accurate investment to output ratio.

Each report that we prepare takes a timeframe of 350-400 business hours for production. Starting from the selection of titles through a couple of in-depth brain storming session to the final QC process before uploading our titles on our website we dedicate around 350 working hours. The titles are selected based on their current market cap and the foreseen CAGR and growth.


The 5 steps process:

Step 1: Secondary Research:

Secondary Research or Desk Research is as the name suggests is a research process wherein, we collect data through the readily available information. In this process we use various paid and unpaid databases which our team has access to and gather data through the same. This includes examining of listed companies’ annual reports, Journals, SEC filling etc. Apart from this our team has access to various associations across the globe across different industries. Lastly, we have exchange relationships with various university as well as individual libraries.

Secondary Research

Step 2: Primary Research

When we talk about primary research, it is a type of study in which the researchers collect relevant data samples directly, rather than relying on previously collected data.  This type of research is focused on gaining content specific facts that can be sued to solve specific problems. Since the collected data is fresh and first hand therefore it makes the study more accurate and genuine.

We at SNS Insider have divided Primary Research into 2 parts.

Part 1 wherein we interview the KOLs of major players as well as the upcoming ones across various geographic regions. This allows us to have their view over the market scenario and acts as an important tool to come closer to the accurate market numbers. As many as 45 paid and unpaid primary interviews are taken from both the demand and supply side of the industry to make sure we land at an accurate judgement and analysis of the market.

This step involves the triangulation of data wherein our team analyses the interview transcripts, online survey responses and observation of on filed participants. The below mentioned chart should give a better understanding of the part 1 of the primary interview.

Primary Research

Part 2: In this part of primary research the data collected via secondary research and the part 1 of the primary research is validated with the interviews from individual consultants and subject matter experts.

Consultants are those set of people who have at least 12 years of experience and expertise within the industry whereas Subject Matter Experts are those with at least 15 years of experience behind their back within the same space. The data with the help of two main processes i.e., FGDs (Focused Group Discussions) and IDs (Individual Discussions). This gives us a 3rd party nonbiased primary view of the market scenario making it a more dependable one while collation of the data pointers.

Step 3: Data Bank Validation

Once all the information is collected via primary and secondary sources, we run that information for data validation. At our intelligence centre our research heads track a lot of information related to the market which includes the quarterly reports, the daily stock prices, and other relevant information. Our data bank server gets updated every fortnight and that is how the information which we collected using our primary and secondary information is revalidated in real time.

Data Bank Validation

Step 4: QA/QC Process

After all the data collection and validation our team does a final level of quality check and quality assurance to get rid of any unwanted or undesired mistakes. This might include but not limited to getting rid of the any typos, duplication of numbers or missing of any important information. The people involved in this process include technical content writers, research heads and graphics people. Once this process is completed the title gets uploader on our platform for our clients to read it.

Step 5: Final QC/QA Process:

This is the last process and comes when the client has ordered the study. In this process a final QA/QC is done before the study is emailed to the client. Since we believe in giving our clients a good experience of our research studies, therefore, to make sure that we do not lack at our end in any way humanly possible we do a final round of quality check and then dispatch the study to the client.

Start a Conversation

Hi! Click one of our member below to chat on Phone