Genotyping Market Report Scope & Overview:
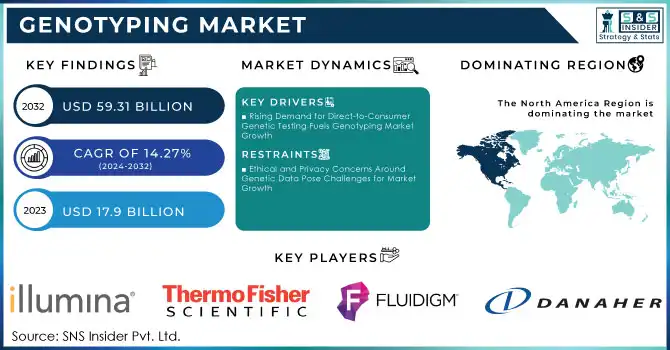
Genotyping Market was valued at USD 17.9 billion in 2023 and is expected to reach USD 59.31 billion by 2032, growing at a CAGR of 14.27% from 2024-2032.
The genotyping market is growing rapidly, because of advancements in genomics and biotechnology. These scientific breakthroughs allow scientists to gain a much clearer understanding of genetic variations, which in turn promotes its application for personalized medicine and precision health. Therefore, genotyping has become essential for understanding how genetic differences impact health and disease outcomes. This relevance is further amplified by the adoption of genotyping technologies in diverse fields like drug discovery, agriculture, and clinical diagnostics, which are all benefiting from the improved accessibility of sequencing technologies as their costs continue to decline.
To Get More Information on Genotyping Market - Request Sample Report
This growing accessibility is closely tied to the rising demand for genotyping, driven by the high prevalence of genetic disorders and chronic diseases such as cancer, diabetes, and cardiovascular conditions. According to WHO, an estimated 240,000 newborns die worldwide within 28 days of birth annually due to congenital disorders, while an additional 170,000 children between 1 month and 5 years succumb to these conditions. These alarming statistics highlight the need for genomics research, prompting significant investments from governments and private organizations to advance healthcare applications. Besides healthcare, this also has transformed agriculture with improved crop yields and resistance to pests. Finally, public interest in knowing ancestry and health-related information has been the driving force for direct-to-consumer genetic testing that further expands the application of genotyping technologies into everyday life
Next-generation systems (NGS), CRISPR-based gene-editing technologies, etc. are some trends driving significant growth prospects for the genotyping market and offering new areas of expansion into new markets. Combined, these improvements are making genotyping more streamlined and efficient, and are being accompanied by artificial intelligence capabilities that make the analysis of complicated genetic information less daunting. Given that AI tools are tightly integrated into digital health platforms and cloud-based genomic databases, data-sharing and collaboration should be vastly improved. Such progress is underpinned by shifting regulatory frameworks focusing on the responsible use of genetic data and creating a conducive climate for innovation. Consequently, sectors like pharmaceuticals, agricultural, and consumer genomics are set to experience immense growth
Genotyping Market Dynamics
DRIVERS
-
Rising Demand for Direct-to-Consumer Genetic Testing Fuels Genotyping Market Growth
The rising demand for personal ancestry, health risks, and genetic traits is making people opt for more DTC genetic testing. The DTC genetic test provides a very convenient, non-invasive, and cost-effective means of genetic information that appeals strongly to consumers. Improving genotyping technologies have added further accuracy and reliability in tests, hence more usage. DTC genetic testing is the most significant aspect of growth in the genotyping market as people are currently looking for personalized health and ancestry information. This growing demand reflects a broader trend in consumer empowerment in health and wellness decisions, which will fuel growth in this segment.
-
Expanding Use of Genotyping in Agriculture and Livestock Breeding Accelerates Market Growth
The growing need for sustainable food production and improved agricultural efficiency has led to a significant rise in the adoption of genotyping for crop enhancement and livestock breeding. By leveraging genotyping technologies, farmers and researchers can identify genetic traits that promote higher yields, disease resistance, and environmental adaptability in crops. Similarly, in livestock, genotyping enables the selection of animals with desirable traits, improving productivity and health while reducing costs. These advancements are crucial in addressing global challenges such as climate change, food security, and resource optimization. As agriculture increasingly integrates precision genetics into its practices, the genotyping market continues to benefit from the expanding demand in this sector.
RESTRAINTS
-
Ethical and Privacy Concerns Around Genetic Data Pose Challenges for Market Growth
The storage and sharing of genetic data raise significant ethical and privacy concerns, limiting the widespread adoption of genotyping technologies. Consumers and organizations are increasingly wary of potential misuse of genetic information, such as unauthorized access, discrimination, or exploitation. The lack of standardized global regulations on genetic data handling exacerbates these fears, creating inconsistencies in compliance and trust. Furthermore, ethical dilemmas surrounding consent, ownership, and secondary use of genetic information add complexity to the market. Companies must invest heavily in data protection measures and transparency to address these concerns, but even with safeguards in place, overcoming consumer skepticism remains a significant hurdle for the genotyping industry.
Genotyping Market Segment Analysis
BY PRODUCT
In 2023, the Reagents & Kits segment captured about 62% of the genotyping market revenue due to its essential role in routine applications across research, clinical, and agricultural sectors. Technological advancements in reagents have improved reliability and efficiency, while established suppliers ensure consistent availability. This strong demand and market presence underscore the segment’s critical contribution to sustaining the genotyping industry and driving continued innovation.
The Software and Services segment is expected to grow at a CAGR of 17.77% from 2024 to 2032, fueled by the rising need for advanced bioinformatics tools and secure data management solutions. The surge in genetic data has heightened demand for analytics software, while personalized services expand opportunities in emerging markets. This growth is set to transform market dynamics, emphasizing value-added solutions and fostering competition.
BY END USE
In 2023, the Diagnostics and Research Laboratories segment held the largest revenue share of about 38% in the genotyping market, driven by its critical role in genetic testing and disease research. These facilities benefit from advanced genotyping technologies that enhance diagnostic accuracy and enable breakthroughs in precision medicine. Their established infrastructure and consistent demand position this segment as a cornerstone of innovation and funding within the market.
The Pharmaceutical and Biopharmaceutical Companies segment is anticipated to grow at a CAGR of 16.09% from 2024 to 2032, fueled by the rising use of genotyping in drug discovery and personalized medicine. The need for biomarker identification and patient stratification in clinical trials has amplified the demand for advanced solutions. This growth is set to drive competition and investment, reshaping the market with innovations and expanded applications.
BY APPLICATION
In 2023, the Diagnostics and Personalized Medicine segment led the genotyping market with a 38% revenue share due to its pivotal role in disease detection and individualized treatment plans. Technological advancements have improved the accuracy and efficiency of diagnostic tests, boosting their adoption in healthcare. The growing emphasis on precision medicine reinforces this segment’s strong market presence, driving further innovation and investment.
The Pharmacogenomics segment is expected to grow at a CAGR of 16.81% from 2024 to 2032, fueled by rising demand for personalized drug therapies. Genotyping’s ability to identify genetic factors influencing drug response enhances treatment efficacy and reduces adverse effects. This trend is accelerating investments in pharmacogenomics, reshaping healthcare toward more patient-centric and effective solutions.
BY TECHNOLOGY
In 2023, the Sequencing segment captured 24% of the genotyping market revenue due to its precision and scalability in detecting genetic variations. Innovations in next-generation sequencing (NGS) have improved speed, accuracy, and cost-effectiveness, driving demand in research and clinical applications. Its strong presence in fields like oncology and personalized medicine ensures continued investment and technological advancements.
The PCR segment is expected to grow at a CAGR of 16.39% from 2024 to 2032, driven by its affordability, efficiency, and adaptability across diverse applications. PCR’s role in amplifying and analyzing DNA makes it invaluable for infectious disease diagnostics and genotyping in low-resource settings. This rapid growth is fueling innovation and expanding access to genetic testing worldwide.
Genotyping Market Regional Outlook
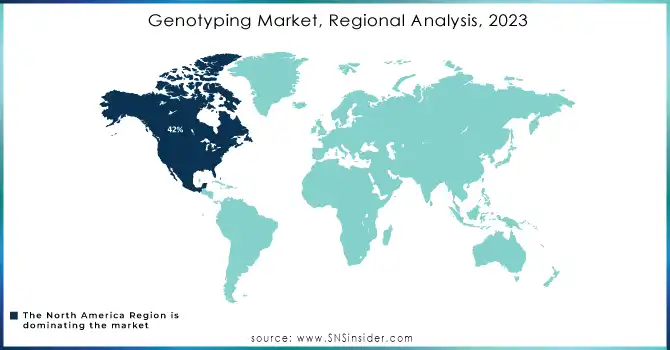
In 2023, North America dominated the genotyping market with a 42% revenue share, driven by strong demand for advanced genetic testing and well-established healthcare infrastructure. The region's leadership in research and development, supported by the presence of major market players and substantial funding, further bolstered its position. This dominance underscores North America’s role as a hub for innovation, attracting continuous investments and maintaining its competitive edge in the global market.
The Asia Pacific region is projected to grow at the fastest CAGR of 16.73% from 2024 to 2032, fueled by rising healthcare investments, expanding research initiatives, and increasing awareness of genetic testing. Emerging economies in the region are embracing genotyping technologies for applications in personalized medicine and agriculture. This rapid growth is set to reshape the competitive landscape, drawing global players to capitalize on untapped opportunities and driving regional advancements in genomics.
Do You Need any Customization Research on Genotyping Market - Enquire Now
LATEST NEWS -
-
On September 19, 2024, Illumina and LGC Biosearch Technologies announced a strategic partnership to advance genomic innovation in agriculture.
-
On September 4, 2024, QIAGEN announced a collaboration with Eli Lilly to develop a QIAstat-Dx in-vitro diagnostic (IVD) panel for detecting APOE genotypes, which are relevant in diagnosing Alzheimer’s disease.
KEY PLAYERS
-
Illumina Inc. (MiSeq System, iScan System)
-
Thermo Fisher Scientific Inc. (TaqMan Genotyping Assays, Ion GeneStudio S5 System)
-
QIAGEN (QIAseq Targeted DNA Panels, QIAxcel Advanced System)
-
F. Hoffmann-La Roche Ltd. (LightCycler 480, AVENIO Tumor Tissue Analysis Kits)
-
Fluidigm Corporation (Juno System, Biomark HD System)
-
Danaher Corporation (Leica Bond RX, Pall GeneDisc System)
-
Agilent Technologies (SureSelect Target Enrichment, AriaMx Real-Time PCR System)
-
Eurofins Scientific Inc. (GenePanel Sequencing, Genotyping Array Services)
-
GE Healthcare Inc. (Amersham ECL Detection Reagents, Biacore Genotyping Chips)
-
Bio-Rad Laboratories Inc. (CFX384 Real-Time PCR System, PrimePCR Assays)
-
PerkinElmer, Inc. (Sciclone NGS Workstation, LabChip GX Touch System)
-
Beckman Coulter, Inc. (Biomek Automated Workstations, Allegra X-30 Centrifuge)
-
Eppendorf AG (Mastercycler Pro S, epMotion 5075t NGS Workstation)
-
Promega Corporation (Maxwell RSC Genomic DNA Kits, GoTaq DNA Polymerase)
-
New England Biolabs (NEB) (NEBNext Ultra II DNA Library Prep Kits, Q5 High-Fidelity DNA Polymerase)
-
Takara Bio USA, Inc. (SMART-Seq Stranded Kits, Dragonfly Discovery System)
-
Integrated DNA Technologies (IDT) (RhAmp Genotyping Assays, PrimeTime qPCR Assays)
-
Zymo Research (ZR Genomic DNA Kit, Quick-DNA Fecal/Soil Microbe Kit)
-
BGI Genomics (DNBSEQ Sequencing System, Whole Genome Genotyping Services)
-
SOPHiA GENETICS (SOPHiA DDM for Genomic Analysis, Whole Exome Sequencing Kits)
| Report Attributes | Details |
|---|---|
| Market Size in 2023 | USD 17.9 Billion |
| Market Size by 2032 | USD 59.31 Billion |
| CAGR | CAGR of 14.27% From 2024 to 2032 |
| Base Year | 2023 |
| Forecast Period | 2024-2032 |
| Historical Data | 2020-2022 |
| Report Scope & Coverage | Market Size, Segments Analysis, Competitive Landscape, Regional Analysis, DROC & SWOT Analysis, Forecast Outlook |
| Key Segments | • By Product (Instruments, Reagents & Kits, Software and Services) • By Technology (PCR, Capillary Electrophoresis, Microarrays, Sequencing, Mass Spectrometry, Others) • By Application (Pharmacogenomics, Diagnostics and Personalized Medicine, Agricultural Biotechnology, Animal Genetics, Others) • By End Use (Pharmaceutical and Biopharmaceutical Companies, Diagnostics and Research Laboratories, Academic Institutes, Others) |
| Regional Analysis/Coverage | North America (US, Canada, Mexico), Europe (Eastern Europe [Poland, Romania, Hungary, Turkey, Rest of Eastern Europe] Western Europe] Germany, France, UK, Italy, Spain, Netherlands, Switzerland, Austria, Rest of Western Europe]), Asia Pacific (China, India, Japan, South Korea, Vietnam, Singapore, Australia, Rest of Asia Pacific), Middle East & Africa (Middle East [UAE, Egypt, Saudi Arabia, Qatar, Rest of Middle East], Africa [Nigeria, South Africa, Rest of Africa], Latin America (Brazil, Argentina, Colombia, Rest of Latin America) |
| Company Profiles | Illumina Inc., Thermo Fisher Scientific Inc., QIAGEN, F. Hoffmann-La Roche Ltd., Fluidigm Corporation, Danaher Corporation, Agilent Technologies, Eurofins Scientific Inc., GE Healthcare Inc., Bio-Rad Laboratories Inc., PerkinElmer, Inc., Beckman Coulter, Inc., Eppendorf AG, Promega Corporation, New England Biolabs (NEB), Takara Bio USA, Inc., Integrated DNA Technologies (IDT), Zymo Research, BGI Genomics, SOPHiA GENETICS. |
| Key Drivers | • Rising Demand for Direct-to-Consumer Genetic Testing Fuels Genotyping Market Growth • Expanding Use of Genotyping in Agriculture and Livestock Breeding Accelerates Market Growth |
| Restraints | • Ethical and Privacy Concerns Around Genetic Data Pose Challenges for Market Growth |
Get in Touch
