Glass Curtain Wall Market Report Scope & Overview:
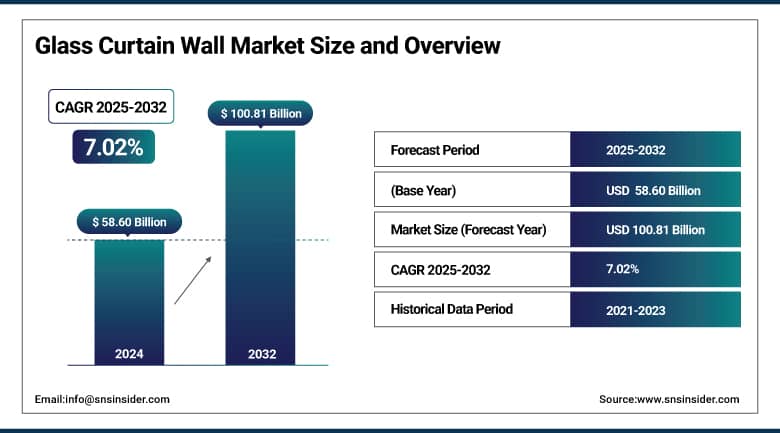
The Glass Curtain Wall Market size was valued at USD 58.60 billion in 2024 and is expected to reach USD 100.81 billion by 2032, growing at a CAGR of 7.02% over the forecast period of 2025-2032.
The global glass curtain wall market is growing due to the rising demand for sustainability-based architecture, energy efficiency, and modern building aesthetics. The glass curtain wall, which also includes matrix curtain wall systems widely used in commercial, institutional, and residential buildings, allows natural light, beauty, and thermal performance. These non-load-bearing systems aid in the overall energy consumption reduction through advanced glazing technologies such as low-E glass and insulated glass units. Fueled by the growth of green construction and increasing adoption of new building technologies, innovation in materials, structural systems, and application of smart control systems is all rapidly impacting the glass curtain wall industry. Moreover, investments in durable, secure, and acoustically insulated high-performance building facades are also complementing the growth of the market. Additionally, pre-manufactured and unitized curtain wall systems are gaining traction owing to shorter assembly time and value for money.
Major trends in the glass curtain wall market growth include increasing photovoltaic glass adoption, smart shading, and minimalistic architectural design. With developers and architects paying more attention to energy codes and contemporary aesthetics, the market for glass curtain wall market trends toward innovative, lightweight, and multifunctional solutions, which is testament to the growth of the market and are expected to provide a consistent growth prospect during the forecast period.
To Get More Information On Glass Curtain Wall Market - Request Free Sample Report
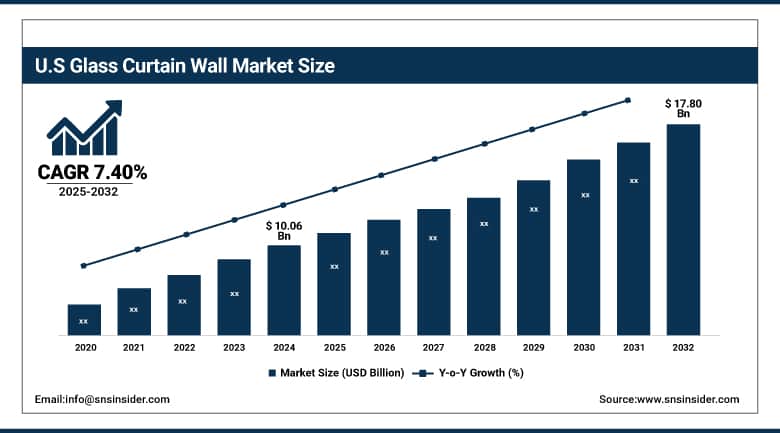
The U.S. Glass Curtain Wall Market was valued at USD 10.06 billion in 2024 and is projected to reach USD 17.80 billion by 2032, growing at a CAGR of 7.40%. Increasing commercial construction, demand for energy-efficient façades, and retrofitting of the aging building stock are fueling growth. The adoption is driven by green building standards such as LEED and innovations such as smart glazing and photovoltaic curtain walls. Such prominent manufacturers and a sustainable construction ecosystem supplement growth in the market.
Glass Curtain Wall Market Dynamics
Drivers
-
Energy-Efficient and Sustainable Construction Drives Surge in Glass Curtain Wall Adoption
The glass curtain wall market is being propelled by the increasing demand for energy-efficient and sustainable buildings. With governments and regulatory bodies worldwide tightening energy codes and advocating for green-building certifications like LEED and BREEAM, developers are adopting innovative façade technologies. Glass curtain walls with insulating glass units (IGUs) and low-emissivity (low-E) coatings reduce the transfer of heat, provide good thermal insulation, and reduce energy consumption for heating and cooling. Such solutions enhance energy efficiency, comfort for the occupants, and benefit the environment. With increasing concern regarding climate change and rising energy prices, the construction industry is focusing more on high performance façades, which is further enforcing the growth of glass curtain walls for energy efficient and sustainable buildings.
In June 2024: According to the World Economic Forum, innovations in low-emissivity (Low‑E) glass are significantly enhancing building energy efficiency by reducing heat loss and HVAC demands. While these coatings improve occupant comfort and sustainability, the article also stresses the need to address the environmental impact of glass production. This shift underscores Low-E glass as a key focus in the evolution of energy-efficient glass curtain wall systems.
Restraint
-
High Initial Investment Poses a Major Barrier to Glass Curtain Wall Adoption
The initial cost associated with glass cores constitutes severe restraint on the global glass curtain wall market. In order to satisfy the requirements of energy and aesthetics, these systems are needed to employ costly and resource-intensive materials like double- or triple-glazed, low-emissivity coatings, thermal breaks, and complex framing components. Furthermore, it is a laborious process, requiring high levels of finesse and skill, which ultimately leads to higher capital costs in order to ensure a proper fit, weatherproofing, and structure. The additional cost burden due to custom design specifications and engineering complexity makes it difficult for small and mid-scale developers to adopt these systems. While long-term operational savings and improved building performance are potential upshots, the significant upfront cost is still a barrier, especially in price-sensitive or emerging markets where budgets restrict the choice of high-end construction.
Glass Curtain Wall Market Segmentation Outlook
By Type
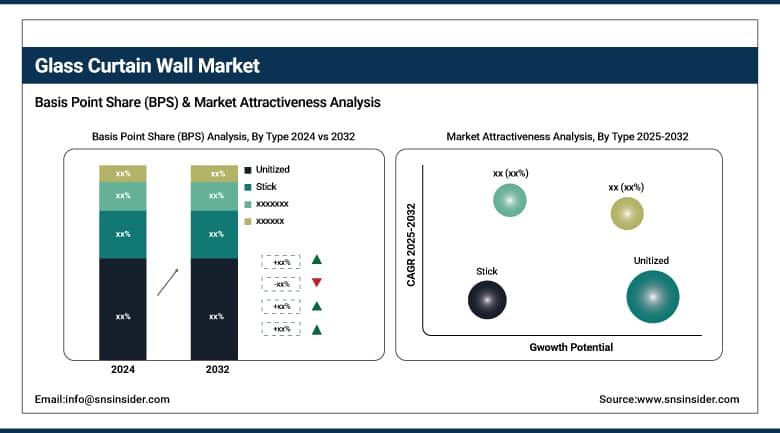
Unitized segment dominated the market and accounted for 66% of the glass curtain wall market share. The prefabricated system provides high accuracy, shorter installation time, and less manpower on-site, leading to this dominance. For taller buildings, unitized systems provide better quality control and are optimal for high rises with strong structural performance, thermal insulation, and weatherproofing capabilities. The growth of this segment can be attributed to the increasing modular construction and demand for energy-efficient building envelopes in urban commercial projects.
The stick curtain wall segment is experiencing the fastest growth in the market. The cost-efficiency and design versatility afforded by its usage make it a popular option among low- to mid-rise buildings and custom architectural applications. Compared to unitized systems, which are prefabricated in an off-site factory, stick-built systems are pieced together on-site and can be altered as construction progresses. This characteristic stands out, especially in underdeveloped countries where experienced labor is available abundantly, and project adjustments occur regularly. The growth of this segment results from the rising construction of low-scale buildings and renovations in developing economies.
By End-Use
The commercial segment led the glass curtain wall market in 2024, contributing 72% of the total market share. This dominance is due to the widespread use of curtain walls as facades for office towers, hotels, shopping malls, and institutional buildings. In all these price quotes for curtain wall systems, energy efficiency, daylighting, and aesthetic appeal are factors that matter to the commercial developers that need them most, and the curtain wall system satisfies all of these triple demands effortlessly. Moreover, massive investment in urban infrastructure and the boom of high-rise commercial buildings in metropolitan regions have further locked in this segment worldwide.
The residential segment is the fastest-growing end-use category in the glass curtain wall market. The demand is being fueled by the growing trend for luxury apartments, high-rise condominiums, and modern housing featuring natural lighting and clean lines. In response to the ever-increasing urban population and changing consumer demands of greater, high-end, sustainable living spaces, residential developers are implementing curtain wall systems into their designs. In addition, the adoption of curtain walls in residential construction is supported by government initiatives for green buildings and energy-efficient housing.
Glass Curtain Wall Market Regional Analysis
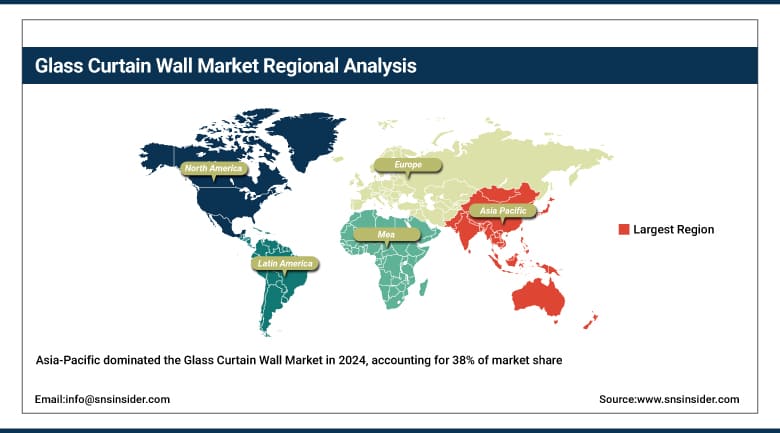
Asia-Pacific dominated the global glass curtain wall market in 2024, accounting for 38% of the total share. This is due to the fast pace of urbanization in the region, especially in commercial towers, office buildings, and high-rise apartment structures. This is being demanded by the growing sustainable architecture in developing nations. Cheap labor, availability of raw materials, and government support for infrastructure projects help in faster market penetration. Moreover, the installation of unitized and stick curtain walls continues to rise across the region, owing to not only continuous smart city initiatives but also growing cognizance toward green buildings.
China dominated the Asia-Pacific market in 2024, with its penetration accelerated by a solid local manufacturing base and government-driven infrastructure projects. Also, the strong export of curtain wall components in China expands the influence of curtain wall components in the international market.
Get Customized Report as Per Your Business Requirement - Enquiry Now
North America emerged as the fastest-growing region in the glass curtain wall market in 2024. The region's growth can be attributed to stringent green building standards, followed by the renovation of existing commercial buildings and technologies for Façade. The integrative glass curtain walls find larger applications due to growing awareness regarding energy conservation, along with federal and state incentives for sustainable construction. Market growth is also being buoyed by rising unitized systems used for quicker and higher-quality installation. The overall pace of expansion in North America is being strengthened by smart building solutions and resilient infrastructure projects.
Europe remains a significant market for glass curtain walls in 2024, with steady demand driven by modern architectural practices and strict building energy efficiency regulations. Countries in Europe land on heavy focus on sustainability, low carbon emissions, and an attractive facade. A well-established construction industry, government incentives for upgrading building energy performance, and advances in facade engineering are among the strengths of the region. Additionally, Europe takes advantage of fresher curtain wall systems for its refurbishment of ageing infrastructure. While the region is not necessarily the fastest growing, it remains an important component as a good balance of new versus retrofitted projects using high-performance materials and systems is seen.
Germany leads the European glass curtain wall market in 2024, due to the large construction industry in the country, as well as energy-efficient buildings being stressed. Demand is driven by strong environmental regulations and a push for net-zero buildings. The nation is also home to advanced glazing technologies and a strong network of facade manufacturers.
Key players in Glass Curtain Wall Market are:
-
Kawneer
-
Nippon Sheet Glass
-
Schott AG
-
China Glass Holdings Limited
-
Vitro
-
Apogee Enterprises Inc.
-
Guardian Industries
-
Central Glass Co., Ltd.
Recent Development
-
In March 2025, Kawneer launched its new 1600UT SS Curtain Wall System, combining high thermal performance (U-factor as low as 0.24) with a semi-unitized, screw-spline design for easier installation. The system meets modern seismic standards and integrates with other Kawneer products like GLASSvent UT windows. It features a sleek 2½ sightline and supports both inside- and outside-glazing configurations.
-
In September 2024, Vitro Architectural Glass supported the USD 15 million renovation of the Pittsburgh Glass Center by supplying Solarban 72 Starphire and VacuMax insulating glass. The 11,000 sq ft expansion included a new glassblowing studio and outdoor Vitro Patio. The project was unveiled with a symbolic “hot glass ribbon-cutting” celebrating 140 years of Pittsburgh’s glassmaking heritage.
| Report Attributes | Details |
|---|---|
| Market Size in 2024 | USD 58.60 Billion |
| Market Size by 2032 | USD 100.81 Billion |
| CAGR | CAGR of 7.02% From 2025 to 2032 |
| Base Year | 2024 |
| Forecast Period | 2025-2032 |
| Historical Data | 2021-2023 |
| Report Scope & Coverage | Market Size, Segments Analysis, Competitive Landscape, Regional Analysis, DROC & SWOT Analysis, Forecast Outlook |
| Key Segments | • By Type (Unitized, Stick) • By End Use (Commercial, Public, Residential) |
| Regional Analysis/Coverage | North America (US, Canada, Mexico), Europe (Germany, France, UK, Italy, Spain, Poland, Turkey, Rest of Europe), Asia Pacific (China, India, Japan, South Korea, Singapore, Australia, Rest of Asia Pacific), Middle East & Africa (UAE, Saudi Arabia, Qatar, South Africa, Rest of Middle East & Africa), Latin America (Brazil, Argentina, Rest of Latin America) |
| Company Profiles | Kawneer, Asahi Glass, Nippon Sheet Glass, Schott AG, China Glass Holdings Limited, Vitro, Apogee Enterprises Inc., Saint-Gobain, Guardian Industries, Central Glass Co., Ltd. |
Frequently Asked Questions
Ans: The Asia-Pacific region dominated the Glass Curtain Wall market in 2024.
Ans: The “Unitized” segment dominated the Glass Curtain Wall market.
Ans: Energy-Efficient and Sustainable Construction Drives Surge in Glass Curtain Wall Adoption
Ans: The Glass Curtain Wall market was USD 58.60 billion in 2024 and is expected to reach USD 100.81 billion by 2032.
Ans: The Glass Curtain Wall market is expected to grow at a CAGR of 7.02% from 2025-2032.
Get in Touch
