Grab-and-Go Bottles Market Report Scope And Overview:
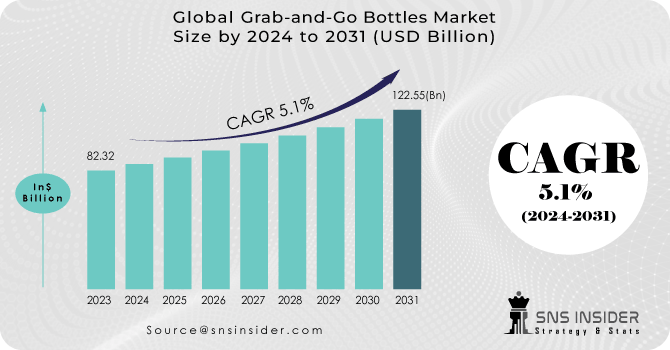
The Grab-and-Go Bottles Market Size was valued at USD 82.32 billion in 2023 and is expected to reach USD 122.55 billion by 2031 and grow at a CAGR of 5.1% over the forecast period 2024-2031.
The grab-and-go bottle market is positioned for impressive growth, driven by its versatility across industries and its perfect fit for our fast-paced lives. The convenience and portability they offer resonate with a growing number of single-person households, a trend highlighted by the US Census Bureau's data 36.1 million in 2020, reaching an estimated 41.2 million by 2031. This shift in demographics, coupled with the overall demand for on-the-go convenience, positions the grab-and-go bottle market for a thriving future.
Get More Information on Grab-and-Go Bottles Market - Request Sample Report
Retailers are capitalizing on this trend by creating innovative packaging solutions, like pre-bundled snacks and drinks in specially designed grab-and-go bottles. This convenience factor is catching on with consumers, further propelling market growth. Packaging companies are recognizing this opportunity and are investing heavily in their manufacturing lines to meet the rising demand.
MARKET DYNAMICS
KEY DRIVERS:
-
Concerns about dirty drinking water are boosting sales of grab-and-go bottled water.
Millions around the world lack access to safe drinking water. The World Health Organization estimates that 785 million people don't have basic clean water, with 144 million relying on potentially contaminated surface water sources. This troubling reality, coupled with the waterborne diseases it causes like cholera, diarrhea, typhoid, and polio, is fueling a global surge in bottled water consumption as people prioritize their health.
-
Consumer-friendly packaging is attracting more buyers, keeping the market healthy.
RESTRAIN:
-
Higher costs, lower durability, and a greater susceptibility to shock and breakage can hinder the market’s growth.
-
Tougher regulations on plastic use could slow the growth of the grab-and-go bottle market.
OPPORTUNITY:
-
E-commerce surge and recycled plastic use are fueling the grab-and-go bottle market.
The rapid growth of online shopping creates a surge in demand for convenient packaging for delivery. Grab-and-go bottles, typically lightweight and portable, are ideal for e-commerce fulfillment, contributing to market growth.
-
Tech innovations & strong demand from food & beverage industries propel grab-and-go bottle market.
CHALLENGES:
-
Public anxiety surrounding the safety of materials used in bottle manufacturing is a growing concern, potentially deterring some consumers from bottled water.
-
Refillable bottle options limited in certain areas due to a lack of refill stations
IMPACT OF RUSSIAN UKRAINE WAR
The war in Ukraine has disrupted the global supply chain, impacting the grab-and-go bottle market in several ways. Firstly, manufacturers may struggle to procure enough raw materials due to potential shortages or logistical hurdles. To mitigate this, companies can leverage advanced data and algorithms to optimize production yield and minimize waste. Additionally, negotiating shorter payment terms with suppliers in exchange for price breaks can incentivize continued supply. In the most critical cases, for materials essential to core products, a merger or joint venture with a local supplier might be necessary to reduce reliance on globalized production and its inherent risks. Finally, for products heavily reliant on single-source materials, developing alternative material options can provide a safety net against potential disruptions. These strategies can help the grab-and-go bottle market navigate the challenges posed by the Russia-Ukraine war and ensure a more resilient supply chain.
IMPACT OF ECONOMIC SLOWDOWN
The economic slowdown triggered by various factors is casting a shadow on the grab-and-go bottle market. With a significant portion of the workforce is remote, the demand for on-the-go bottled water, a key driver of the market, has shrunk by 46%. Additionally, stubbornly high inflation due to labor shortages and wage pressures could force central banks to tighten monetary policies, leading to a sharper economic slowdown that could further dampen consumer spending on grab-and-go beverages. Furthermore, the ongoing war in Ukraine and potential financial market repricing due to inflation surprises heighten global instability and disrupt supply chains, potentially impacting the production and availability of grab-and-go bottles. These combined factors pose a challenge to the market's growth in the near future.
KEY MARKET SEGMENTS
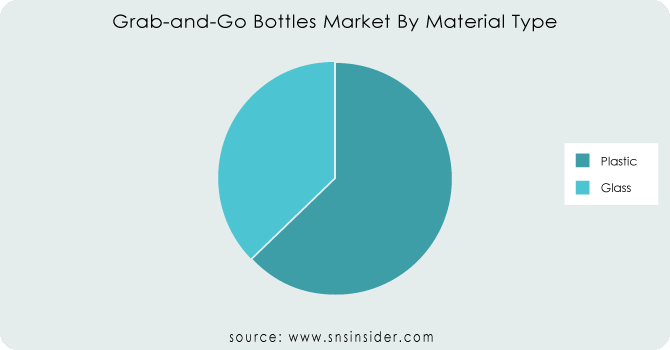
By Material Type
-
Plastic
-
Polyethylene (PE)
-
PET
-
Polypropylene (PP)
-
Others
-
-
Glass
Plastic Dominates Grab-and-Go Bottles holds more than 60% market share. Its lightweight design, affordability, and versatility make it the go-to choice, with recycling advancements boosting its appeal. This dominance may influence material selection for market players.
Get Customized Report as per Your Business Requirement - Request For Customized Report
By Capacity
-
Up to 250 ml
-
251-500 ml
-
501-1000 ml
-
Above 1000 ml
By End Use
-
Food
-
Sauces & Condiments
-
Soups & Syrups
-
Dairy Products
-
Others
-
-
Beverages
-
Alcoholic
-
Non-alcoholic
-
-
Cosmetics & Personal Care
-
Others
Beverages leads in the grab-and-go bottle market with market share by 38%, with their surging global demand fueled by factors like rising disposable income and urbanization, propelling the entire industry forward. As people on the go seek convenient and refreshing options, the grab-and-go bottle market thrives alongside the beverage industry, creating a mutually beneficial relationship.
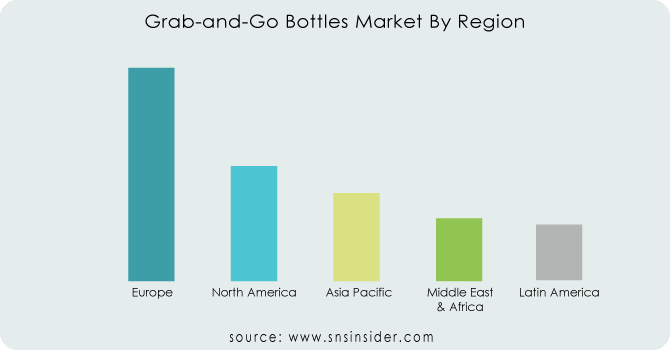
REGIONAL ANALYSIS
Europe is poised to retain its dominance in the grab-and-go bottle market throughout the forecast period. This leadership is fueled by a growing fondness for carbonated beverages, particularly in countries like Germany, the United Kingdom, France, Italy, and Spain. The driving force behind this trend is a fundamental shift in European lifestyles. Busy work schedules, longer commutes, and less leisure time have created a demand for convenient, packaged food and beverages. Grab-and-go bottles perfectly cater to this need. Moreover, advancements in technologies like aseptic packaging are empowering manufacturers. Aseptic packaging helps minimize contamination during bottling, allowing for shelf-stable, ready-to-drink products that further enhance convenience. The surge in middle-class populations across many economies adds another layer of support to the grab-and-go bottle market.
Meanwhile, North America is anticipated to experience significant growth during forecast period. This surge can be attributed to two key factors such as rising demand from various end-use industries and the strong presence of major players in the North American market.
REGIONAL COVERAGE:
North America
-
US
-
Canada
-
Mexico
Europe
-
Eastern Europe
-
Poland
-
Romania
-
Hungary
-
Turkey
-
Rest of Eastern Europe
-
-
Western Europe
-
Germany
-
France
-
UK
-
Italy
-
Spain
-
Netherlands
-
Switzerland
-
Austria
-
Rest of Western Europe
-
Asia Pacific
-
China
-
India
-
Japan
-
South Korea
-
Vietnam
-
Singapore
-
Australia
-
Rest of Asia Pacific
Middle East & Africa
-
Middle East
-
UAE
-
Egypt
-
Saudi Arabia
-
Qatar
-
Rest of Middle East
-
-
Africa
-
Nigeria
-
South Africa
-
Rest of Africa
-
Latin America
-
Brazil
-
Argentina
-
Colombia
-
Rest of Latin America
Key players
Major players in the Grab-and-Go Bottles Market are Nampak Limited, Amcor Plc., Gerresheimer AG, Ardagh Group S.A., Graham Packaging Company, Inc., ALPLA Werke Alwin Lehner GmbH & Co KG, Owens-Illinois, Inc., Vidrala SA, Berry Global Group, Inc., KanPak LLC and others.
Nampak Limited,-Company Financial Analysis
RECENT DEVELOPMENT
-
During October 2021, Amcor plc partnered with Alianza team in Colombia to launch a cooking oil bottle made entirely from recycled content. This collaboration strengthens the companies' sustainable packaging offerings.
-
In September 2020, Berry Global Group, Inc. partnered with Bhoomi to launch a sustainable packaging solution for their cold-pressed cane water elixir. Berry's 12-ounce, recyclable HDPE bottle, manufactured in Winchester, Virginia, replaced Bhoomi's standard PET bottle.
| Report Attributes | Details |
|---|---|
| Market Size in 2023 | US$ 82.32 Billion |
| Market Size by 2031 | US$ 122.55 Billion |
| CAGR | CAGR of 5.1% From 2024 to 2031 |
| Base Year | 2023 |
| Forecast Period | 2024-2031 |
| Historical Data | 2020-2022 |
| Report Scope & Coverage | Market Size, Segments Analysis, Competitive Landscape, Regional Analysis, DROC & SWOT Analysis, Forecast Outlook |
| Key Segments | • By Material Type [Plastic (Polyethylene (PE), PET, Polypropylene (PP), Others), Glass] • By Capacity (Up To 250 Ml, 251-500 Ml,501-1000 Ml, Above 1000 Ml) • By End Use [Food (Sauces & Condiments, Soups & Syrups, Dairy Products, Others), Beverages (Alcoholic, Non-Alcoholic), Cosmetics & Personal Care, Others] |
| Regional Analysis/Coverage | North America (US, Canada, Mexico), Europe (Eastern Europe [Poland, Romania, Hungary, Turkey, Rest of Eastern Europe] Western Europe] Germany, France, UK, Italy, Spain, Netherlands, Switzerland, Austria, Rest of Western Europe]), Asia Pacific (China, India, Japan, South Korea, Vietnam, Singapore, Australia, Rest of Asia Pacific), Middle East & Africa (Middle East [UAE, Egypt, Saudi Arabia, Qatar, Rest of Middle East], Africa [Nigeria, South Africa, Rest of Africa], Latin America (Brazil, Argentina, Colombia, Rest of Latin America) |
| Company Profiles | Nampak Limited, Amcor Plc., Gerresheimer AG, Ardagh Group S.A., Graham Packaging Company, Inc., ALPLA Werke Alwin Lehner GmbH & Co KG, Owens-Illinois, Inc., Vidrala SA, Berry Global Group, Inc., KanPak LLC |
| Key Drivers | • Concerns about dirty drinking water are boosting sales of grab-and-go bottled water. • Consumer-friendly packaging is attracting more buyers, keeping the market healthy. |
| Challenges | • Public anxiety surrounding the safety of materials used in bottle manufacturing is a growing concern, potentially deterring some consumers from bottled water. • Refillable bottle options limited in certain areas due to a lack of refill stations |
Frequently Asked Questions
Ans: The Europe held the largest market share and will continue to dominate the market.
Ans: Higher costs, lower durability, and a greater susceptibility to shock and breakage can hinder the market’s growth.
Ans: Concerns about dirty drinking water are boosting sales of grab-and-go bottled water.
Ans: The Grab-and-Go Bottles Market size was USD 82.32 billion in 2023 and is expected to Reach USD 122.55 billion by 2031.
Ans: The Grab-and-Go Bottles Market is expected to grow at a CAGR of 5.1%.
Get in Touch
