image

Solar Power Market Report Scope & Overview:

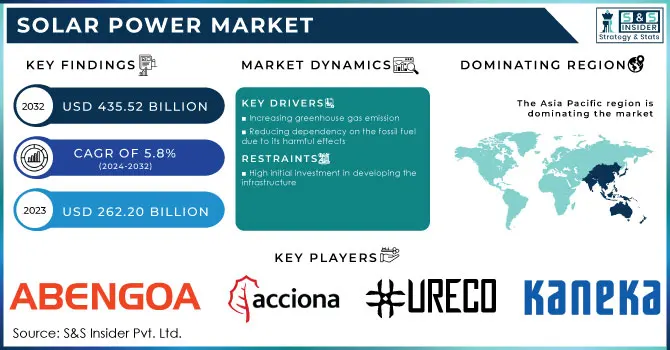
The Solar Power Market size was valued at USD 236.25 billion in 2022 and is expected to grow to USD 399.89 billion by 2030 and grow at a CAGR of 6.8% over the forecast period of 2023-2030.

Solar power is derived by using the sun’s energy and used directly as thermal energy i.e heat or through the use of photovoltaic cells in solar panels and transparent photovoltaic glass to generate the electricity. There are two types of technologies used to generate the energy from sun one is the photovoltaic system and another is a concentrated solar power system. The most efficient application of photovoltaic is the standard photovoltaic solar panels. Photovoltaic glass generates energy from the surfaces like windows, buildings, etc. Multiple lenses or reflectors are used by concentrated solar power to collect more n more sun’s thermal energy. This collected energy throughout the day is then applied to molten salts or oil that retain heat to boil the water for steam turbine generators throughout the night.

Solar Power Market Revenue Analysis

Solar power is the renewable and cleanest form of energy that converts the sun’s energy into thermal or electrical energy. The potential for solar power is huge since the Earth receives solar energy every day in the amount of nearly 200,000 times the world's daily electric generating capacity. The exploitation of solar power is limited in many places because a high cost is required for the collection, conversion, and storage of energy. Unlike fossil fuel, solar power does not produce any harmful greenhouse gas emissions which helps to reduce the carbon footprint and protect the environment from pollution.

Impact of COVID-19

The COVID-19 pandemic had considerably affected the solar power sector due to serious issues like working capital requirement, cash flow crunch, lack of workforce, difficulty in payment recovery from distribution companies, and most important supply chain disruption. The International Solar Alliance (ISA) produced a report on the operational and financial impact of Covid-19 on the solar power sector across the globe. According to this report, the pandemic caused a reduction of about 20% in the global capacity of solar power generation. During the pandemic consumption of bioenergy and other renewable energies decreased due to the restriction on travel, business activities, and border crossing.

Market Dynamics

Drivers

  • Increasing greenhouse gas emission

  • Reducing dependency on the fossil fuel due to its harmful effects

  • Rising demand for green energy from the population

  • The rise in the usage of electricity in houses, public institutions, and businesses

Silver is the major raw material used in the solar module. Due to the fluctuating price of silver demand for solar panel installation is increased which further drives solar power market growth. The emission of harmful greenhouse gas is hazardous to the environment as well as to living beings. Solar power is a form of renewable energy which reduce the carbon footprint and protect the environment from depletion of the ozone layer therefore there is increasing demand for green energy and decreasing dependency on fossil fuel for energy and electricity. These factors drive the solar power market globally.

Restrain

  • High initial investment in developing the infrastructure

The initial cost required to develop the infrastructure to collect, convert, and store the energy is high which may hamper the solar power market. Another reason which can restrain the growth of the market is the lack of infrastructure to collect more energy.

Opportunities

  • Increasing investment in the solar power sector

  • Rising government initiative to adopt renewable energy resources to curb the carbon footprint

Challenges

  • Continuously changing climatic conditions and geographical latitudes

Impact of Russia-Ukraine War:

The ongoing conflict between Russia and Ukraine has had a significant impact on the solar power market. The instability in the region has caused a decrease in investment and a slowdown in the growth of the solar industry. One of the main reasons for this is the uncertainty surrounding the future of the energy market in the region. The conflict has led to a decrease in demand for energy, which has resulted in a decrease in the price of oil and gas. This has made it more difficult for solar power to compete in the market.

Additionally, the conflict has caused a decrease in foreign investment in the region. Many investors are hesitant to invest in a region that is experiencing political instability and conflict. This has made it more difficult for solar power companies to secure funding for new projects.

Impact of Recession:

The solar power market has been significantly affected by the recent economic recession. The recession has caused a decrease in demand for solar power products, as consumers and businesses have become more cautious with their spending. This has resulted in a decrease in sales and revenue for solar power companies. Furthermore, the recession has also affected the financing of solar power projects. Banks and other financial institutions have become more hesitant to provide loans for solar power projects, as they are seen as risky investments during uncertain economic times. This has made it more difficult for solar power companies to secure the necessary funding to develop and expand their projects.

Market segmentation

On the basis of Technology, the Solar Power Market is further segmented into Photovoltaic Systems and Concentrated Solar Power Systems

On the basis of Solar Module, the Solar Power Market is further segmented into Monocrystalline, Polycrystalline, Cadmium Telluride, Amorphous Silicon Cells, and Others

On the basis of End-use, the Solar Power Market is further classified into Electricity Generation, Heating, Charging, and Lighting

On the basis of Application, the Solar Power Market is further bifurcated into Residential, Commercial, and Industrial

By Technology

  • Photovoltaic Systems

  • Concentrated Solar Power Systems

By Solar Module

  • Monocrystalline

  • Polycrystalline

  • Cadmium Telluride

  • Amorphous Silicon Cells

  • Others

By End-use

  • Electricity Generation

  • Heating

  • Charging

  • Lighting

By Application

  • Residential

  • Commercial

  • Industrial

Solar Power Market Segmentation Analysis

Regional Analysis

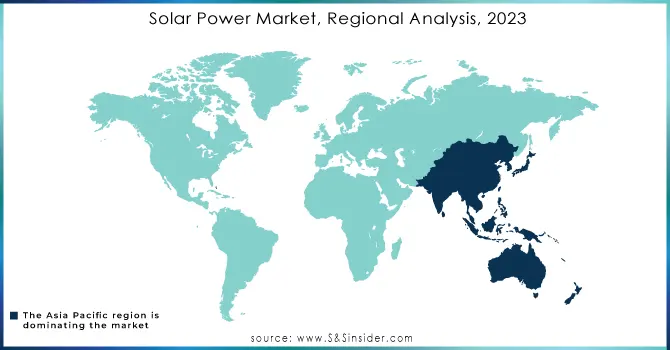
Asia Pacific region dominated the solar power market in 2021 and is expected to show dominance during the forecast period. Presence of a large population base, top countries such as China, India, and Japan utilize solar power in abundance. The rapidly growing urbanization, increase in per-capita income and increasing adoption of renewable energy sources are some of the macroeconomic factors that drive the solar power market in the Asia-Pacific region. Moreover, increasing demand for energy from various sectors, and rising awareness regarding greenhouse gas emission drives the solar power market in this region.

North America region is also estimated to grow significantly during the forecast period owing to the high consumption of solar power, increasing purchasing capacity, rising adoption of smart devices and digital technologies, and increasing adoption of renewable energy resources from the countries of the North American region.

REGIONAL COVERAGE:

  • North America

    • USA

    • Canada

    • Mexico

  • Europe

    • Germany

    • UK

    • France

    • Italy

    • Spain

    • The Netherlands

    • Rest of Europe

  • Asia-Pacific

    • Japan

    • south Korea

    • China

    • India

    • Australia

    • Rest of Asia-Pacific

  • The Middle East & Africa

    • Israel

    • UAE

    • South Africa

    • Rest of the Middle East & Africa

  • Latin America

    • Brazil

    • Argentina

    • Rest of Latin America

Key Players

The major key players are Abengoa Se, Acciona S.A., Canadian Solar, Inc., Esolar, Inc., United Renewable Energy Co. Ltd., Sunpower Corporation, Kaneka Corporation, Tata power solar systems ltd., Wuxi Suntech Power Co., Ltd., Brightsource Energy, Inc., Urja Global Limited, and other key players mentioned in the final report.

Acciona S.A-Company Financial Analysis

Company Landscape Analysis

Solar Power Market Report Scope:
Report Attributes Details
Market Size in 2022  US$ 236.25 Bn
Market Size by 2030  US$ 399.89 Bn
CAGR   CAGR of 6.8% From 2023 to 2030
Base Year 2022
Forecast Period  2023-2030
Historical Data  2020-2021
Report Scope & Coverage Market Size, Segments Analysis, Competitive  Landscape, Regional Analysis, DROC & SWOT Analysis, Forecast Outlook
Key Segments • By Technology (Photovoltaic Systems and Concentrated Solar Power Systems)
• By Solar Module (Monocrystalline, Polycrystalline, Cadmium Telluride, Amorphous Silicon Cells, and Others)
• By End-use (Electricity Generation, Heating, Charging, and Lighting)
• By Application (Residential, Commercial and Industrial)
Regional Analysis/Coverage North America (USA, Canada, Mexico), Europe
(Germany, UK, France, Italy, Spain, Netherlands,
Rest of Europe), Asia-Pacific (Japan, South Korea,
China, India, Australia, Rest of Asia-Pacific), The
Middle East & Africa (Israel, UAE, South Africa,
Rest of Middle East & Africa), Latin America (Brazil, Argentina, Rest of Latin America)
Company Profiles Abengoa Se, Acciona S.A., Canadian Solar, Inc., Esolar, Inc., United Renewable Energy Co. Ltd., Sunpower Corporation, Kaneka Corporation, Tata power solar systems ltd., Wuxi Suntech Power Co., Ltd., Brightsource Energy, Inc., Urja Global Limited
Key Drivers • Increasing greenhouse gas emission
• Reducing dependency on the fossil fuel due to its harmful effects
Market Opportunities • Increasing investment in the solar power sector
• Rising government initiative to adopt renewable energy resources to curb the carbon footprint


Frequently Asked Questions

The expected market size of the Solar Power Market is USD 399.89 billion in 2030.

The expected CAGR of the global Solar Power Market during the forecast period is 6.8%

The major key players are Abengoa Se, Acciona S.A., Canadian Solar, Inc., Esolar, Inc., United Renewable Energy Co. Ltd., Sunpower Corporation, Kaneka Corporation, Tata power solar systems ltd., Wuxi Suntech Power Co., Ltd., Brightsource Energy, Inc., Urja Global Limited.

Asia-Pacific contributes major to the Solar Power Market.

Increasing greenhouse gas emissions, reducing dependency on fossil fuel due to its harmful effects, rising demand for green energy from the population, the rise in the usage of electricity in houses, public institutions, and businesses are the key driving factors of Solar Power Market globally.

Table of Contents

1. Introduction
1.1 Market Definition
1.2 Scope
1.3 Research Assumptions

2. Research Methodology

3. Market Dynamics
3.1 Drivers
3.2 Restraints
3.3 Opportunities
3.4 Challenges

4. Impact Analysis
4.1 COVID-19 Impact Analysis
4.2 Impact of Ukraine- Russia War
4.3 Impact of Ongoing Recession
4.3.1 Introduction
4.3.2 Impact on major economies
4.3.2.1 US
4.3.2.2 Canada
4.3.2.3 Germany
4.3.2.4 France
4.3.2.5 United Kingdom
4.3.2.6 China
4.3.2.7 Japan
4.3.2.8 South Korea
4.3.2.9 Rest of the World

5. Value Chain Analysis

6. Porter’s 5 forces model

7. PEST Analysis

8. Solar Power Market Segmentation, By Technology
8.1    Photovoltaic Systems
8.2    Concentrated Solar Power Systems

9. Solar Power Market Segmentation, By Solar Module
9.1    Monocrystalline
9.2    Polycrystalline
9.3    Cadmium Telluride
9.4    Amorphous Silicon Cells
9.5    Others

10. Solar Power Market Segmentation, By End-use
10.1 Electricity Generation
10.2 Heating
10.3 Charging
10.4 Lighting

11. Solar Power Market Segmentation, By Application
11.1 Residential
11.2 Commercial
11.3 Industrial

12. Regional Analysis
12.1 Introduction
12.2 North America
12.2.1 North America Solar Power Market by Country
12.2.2North America Solar Power Market by Technology
12.2.3 North America Solar Power Market by Solar Module
12.2.4 North America Solar Power Market by End-use
12.2.5 North America Solar Power Market by Application
12.2.6 USA
12.2.6.1 USA Solar Power Market by Technology
12.2.6.2 USA Solar Power Market by Solar Module
12.2.6.3 USA Solar Power Market by End-use
12.2.6.4 USA Solar Power Market by Application
12.2.7 Canada
12.2.7.1 Canada Solar Power Market by Technology
12.2.7.2 Canada Solar Power Market by Solar Module
12.2.7.3 Canada Solar Power Market by End-use
12.2.7.4 Canada Solar Power Market by Application
12.2.8 Mexico
12.2.8.1 Mexico Solar Power Market by Technology
12.2.8.2 Mexico Solar Power Market by Solar Module
12.2.8.3 Mexico Solar Power Market by End-use
12.2.8.4 Mexico Solar Power Market by Application
12.3 Europe
12.3.1 Europe Solar Power Market by country
12.3.2 Europe Solar Power Market by Technology
12.3.3 Europe Solar Power Market by Solar Module
12.3.4 Europe Solar Power Market by End-use
12.3.5 Europe Solar Power Market by Application
12.3.6 Germany
12.3.6.1 Germany Solar Power Market by Technology
12.3.6.2 Germany Solar Power Market by Solar Module
12.3.6.3 Germany Solar Power Market by End-use
12.3.6.4 Germany Solar Power Market by Application
12.3.7 UK
12.3.7.1 UK Solar Power Market by Technology
12.3.7.2 UK Solar Power Market by Solar Module
12.3.7.3 UK Solar Power Market by End-use
12.3.7.4 UK Solar Power Market by Application
12.3.8 France
12.3.8.1 France Solar Power Market by Technology
12.3.8.2 France Solar Power Market by Solar Module
12.3.8.3 France Solar Power Market by End-use
12.3.8.4 France Solar Power Market by Application
12.3.9 Italy
12.3.9.1 Italy Solar Power Market by Technology
12.3.9.2 Italy Solar Power Market by Solar Module
12.3.9.3 Italy Solar Power Market by End-use
12.3.9.4 Italy Solar Power Market by Application
12.3.10 Spain
12.3.10.1 Spain Solar Power Market by Technology
12.3.10.2 Spain Solar Power Market by Solar Module
12.3.10.3 Spain Solar Power Market by End-use
12.3.10.4 Spain Solar Power Market by Application
12.3.11 The Netherlands
12.3.11.1 Netherlands Solar Power Market by Technology
12.3.11.2 Netherlands Solar Power Market by Solar Module
12.3.11.3 Netherlands Solar Power Market by End-use
12.3.11.4 Netherlands Solar Power Market by Application
12.3.12 Rest of Europe
12.3.12.1 Rest of Europe Solar Power Market by Technology
12.3.12.2 Rest of Europe Solar Power Market by Solar Module
12.3.12.3 Rest of Europe Solar Power Market by End-use
12.3.12.4 Rest of Europe Solar Power Market by Application
12.4 Asia-Pacific
12.4.1 Asia Pacific Solar Power Market by country
12.4.2 Asia Pacific Solar Power Market by Technology
12.4.3 Asia Pacific Solar Power Market by Solar Module
12.4.4Asia Pacific Solar Power Market by End-use
12.4.5Asia Pacific Solar Power Market by Application
12.4.6 Japan
12.4.6.1 Japan Solar Power Market by Technology
12.4.6.2 Japan Solar Power Market by Solar Module
12.4.6.3 Japan Solar Power Market by End-use
12.4.6.4 Japan Solar Power Market by Application
12.4.7 South Korea
12.4.7.1 South Korea Solar Power Market by Technology
12.4.7.2 South Korea Solar Power Market by Solar Module
12.4.7.3 South Korea Solar Power Market by End-use
12.4.7.4 South Korea Solar Power Market by Application
12.4.8 China
12.4.8.1 China Solar Power Market by Technology
12.4.8.2 China Solar Power Market by Solar Module
12.4.8.3 China Solar Power Market by End-use
12.4.8.4 China Solar Power Market by Application
12.4.9 India
12.4.9.1 India Solar Power Market by Technology
12.4.9.2 India Solar Power Market by Solar Module
12.4.9.3 India Solar Power Market by End-use
12.4.9.4 India Solar Power Market by Application
12.4.11 Australia
12.4.10.1 Australia Solar Power Market by Technology
12.4.10.2 Australia Solar Power Market by Solar Module
12.4.10.3 Australia Solar Power Market by End-use
12.4.10.4 Australia Solar Power Market by Application
12.4.11 Rest of Asia-Pacific
12.4.11.1 APAC Solar Power Market by Technology
12.4.11.2 APAC Solar Power Market by Solar Module
12.4.11.3 APAC Solar Power Market by End-use
12.4.11.4 APAC Solar Power Market by Application
12.5 The Middle East & Africa
12.5.1 The Middle East & Africa Solar Power Market by country
12.5.2 The Middle East & Africa Solar Power Market by Technology
12.5.3 The Middle East & Africa Solar Power Market by Solar Module
12.5.4The Middle East & Africa Solar Power Market by End-use
12.5.5 The Middle East & Africa Solar Power Market by Application
12.5.6 Israel
12.5.6.1 Israel Solar Power Market by Technology
12.5.6.2 Israel Solar Power Market by Solar Module
12.5.6.3 Israel Solar Power Market by End-use
12.5.6.4 Israel Solar Power Market by Application
12.5.7 UAE
12.5.7.1 UAE Solar Power Market by Technology
12.5.7.2 UAE Solar Power Market by Solar Module
12.5.7.3 UAE Solar Power Market by End-use
12.5.7.4 UAE Solar Power Market by Application
12.5.8South Africa
12.5.8.1 South Africa Solar Power Market by Technology
12.5.8.2 South Africa Solar Power Market by Solar Module
12.5.8.3 South Africa Solar Power Market by End-use
12.5.8.4 South Africa Solar Power Market by Application
12.5.9 Rest of Middle East & Africa
12.5.9.1 Rest of Middle East & Asia Solar Power Market by Technology
12.5.9.2 Rest of Middle East & Asia Solar Power Market by Solar Module
12.5.9.3 Rest of Middle East & Asia Solar Power Market by End-use
12.5.9.4 Rest of Middle East & Asia Solar Power Market by Application
12.6 Latin America
12.6.1 Latin America Solar Power Market by Country
12.6.2 Latin America Solar Power Market by Technology
12.6.3 Latin America Solar Power Market by Solar Module
12.6.4 Latin America Solar Power Market by End-use
12.6.5 Latin America Solar Power Market by Application
12.6.6 Brazil
12.6.6.1 Brazil Solar Power Market by Technology
12.6.6.2 Brazil Africa Solar Power Market by Solar Module
12.6.6.3 Brazil Solar Power Market by End-use
12.6.6.4 Brazil Solar Power Market by Application
12.6.7 Argentina
12.6.7.1 Argentina Solar Power Market by Technology
12.6.7.2 Argentina Solar Power Market by Solar Module
12.6.7.3 Argentina Solar Power Market by End-use
12.6.7.4 Argentina Solar Power Market by Application
12.6.8 Rest of Latin America
12.6.8.1 Rest of Latin America Solar Power Market by Technology
12.6.8.2 Rest of Latin America Solar Power Market by Solar Module
12.6.8.3 Rest of Latin America Solar Power Market by End-use
12.6.8.4 Rest of Latin America Solar Power Market by Application

13. Company Profile
13.1 Abengoa Se
13.1.1 Market Overview
13.1.2 Financials
13.1.3 Product/Services/Offerings
13.1.4 SWOT Analysis
13.1.5 The SNS View
13.2 Acciona S.A.
13.2.1 Market Overview
13.2.2 Financials
13.2.3 Product/Services/Offerings
13.2.4 SWOT Analysis
13.2.5 The SNS View
13.3 Canadian Solar, Inc.
13.3.1 Market Overview
13.3.2 Financials
13.3.3 Product/Services/Offerings
13.3.4 SWOT Analysis
13.3.5 The SNS View
13.4 Esolar, Inc.
13.4.1 Market Overview
13.4.2 Financials
13.4.3 Product/Services/Offerings
13.4.4 SWOT Analysis
13.4.5 The SNS View
13.5 United Renewable Energy Co. Ltd.
13.5.1 Market Overview
13.5.2 Financials
13.5.3 Product/Services/Offerings
13.5.4 SWOT Analysis
13.5.5 The SNS View
13.6 Sunpower Corporation
13.6.1 Market Overview
13.6.2 Financials
13.6.3 Product/Services/Offerings
13.6.4 SWOT Analysis
13.6.5 The SNS View
13.7 Kaneka Corporation
13.7.1 Market Overview
13.7.2 Financials
13.7.3 Product/Services/Offerings
13.7.4 SWOT Analysis
13.7.5 The SNS View
13.8 Tata power solar systems ltd.
13.8.1 Market Overview
13.8.2 Financials
13.8.3 Product/Services/Offerings
13.8.4 SWOT Analysis
13.8.5 The SNS View
13.9 Wuxi Suntech Power Co., Ltd.
13.9.1 Market Overview
13.9.2 Financials
13.9.3 Product/Services/Offerings
13.9.4 SWOT Analysis
13.9.5 The SNS View
13.10 Brightsource Energy, Inc.
13.10.1 Market Overview
13.10.2 Financials
13.10.3 Product/Services/Offerings
13.10.4 SWOT Analysis
13.10.5 The SNS View
13.13.5 The SNS View
13.11 Urja Global Limited
13.11.1 Market Overview
13.11.2 Financials
13.11.3 Product/Services/Offerings
13.11.4 SWOT Analysis
13.11.5 The SNS View

14. Competitive Landscape
14.1 Competitive Benchmarking
14.2 Market Share Analysis
14.3 Recent Developments

15. USE Cases And Best Practices

16. Conclusion
 

An accurate research report requires proper strategizing as well as implementation. There are multiple factors involved in the completion of good and accurate research report and selecting the best methodology to compete the research is the toughest part. Since the research reports we provide play a crucial role in any company’s decision-making process, therefore we at SNS Insider always believe that we should choose the best method which gives us results closer to reality. This allows us to reach at a stage wherein we can provide our clients best and accurate investment to output ratio.

Each report that we prepare takes a timeframe of 350-400 business hours for production. Starting from the selection of titles through a couple of in-depth brain storming session to the final QC process before uploading our titles on our website we dedicate around 350 working hours. The titles are selected based on their current market cap and the foreseen CAGR and growth.


The 5 steps process:

Step 1: Secondary Research:

Secondary Research or Desk Research is as the name suggests is a research process wherein, we collect data through the readily available information. In this process we use various paid and unpaid databases which our team has access to and gather data through the same. This includes examining of listed companies’ annual reports, Journals, SEC filling etc. Apart from this our team has access to various associations across the globe across different industries. Lastly, we have exchange relationships with various university as well as individual libraries.

Secondary Research

Step 2: Primary Research

When we talk about primary research, it is a type of study in which the researchers collect relevant data samples directly, rather than relying on previously collected data.  This type of research is focused on gaining content specific facts that can be sued to solve specific problems. Since the collected data is fresh and first hand therefore it makes the study more accurate and genuine.

We at SNS Insider have divided Primary Research into 2 parts.

Part 1 wherein we interview the KOLs of major players as well as the upcoming ones across various geographic regions. This allows us to have their view over the market scenario and acts as an important tool to come closer to the accurate market numbers. As many as 45 paid and unpaid primary interviews are taken from both the demand and supply side of the industry to make sure we land at an accurate judgement and analysis of the market.

This step involves the triangulation of data wherein our team analyses the interview transcripts, online survey responses and observation of on filed participants. The below mentioned chart should give a better understanding of the part 1 of the primary interview.

Primary Research

Part 2: In this part of primary research the data collected via secondary research and the part 1 of the primary research is validated with the interviews from individual consultants and subject matter experts.

Consultants are those set of people who have at least 12 years of experience and expertise within the industry whereas Subject Matter Experts are those with at least 15 years of experience behind their back within the same space. The data with the help of two main processes i.e., FGDs (Focused Group Discussions) and IDs (Individual Discussions). This gives us a 3rd party nonbiased primary view of the market scenario making it a more dependable one while collation of the data pointers.

Step 3: Data Bank Validation

Once all the information is collected via primary and secondary sources, we run that information for data validation. At our intelligence centre our research heads track a lot of information related to the market which includes the quarterly reports, the daily stock prices, and other relevant information. Our data bank server gets updated every fortnight and that is how the information which we collected using our primary and secondary information is revalidated in real time.

Data Bank Validation

Step 4: QA/QC Process

After all the data collection and validation our team does a final level of quality check and quality assurance to get rid of any unwanted or undesired mistakes. This might include but not limited to getting rid of the any typos, duplication of numbers or missing of any important information. The people involved in this process include technical content writers, research heads and graphics people. Once this process is completed the title gets uploader on our platform for our clients to read it.

Step 5: Final QC/QA Process:

This is the last process and comes when the client has ordered the study. In this process a final QA/QC is done before the study is emailed to the client. Since we believe in giving our clients a good experience of our research studies, therefore, to make sure that we do not lack at our end in any way humanly possible we do a final round of quality check and then dispatch the study to the client.

Start a Conversation

Hi! Click one of our member below to chat on Phone