High-Speed Interconnects Market Report Scope & Overview:
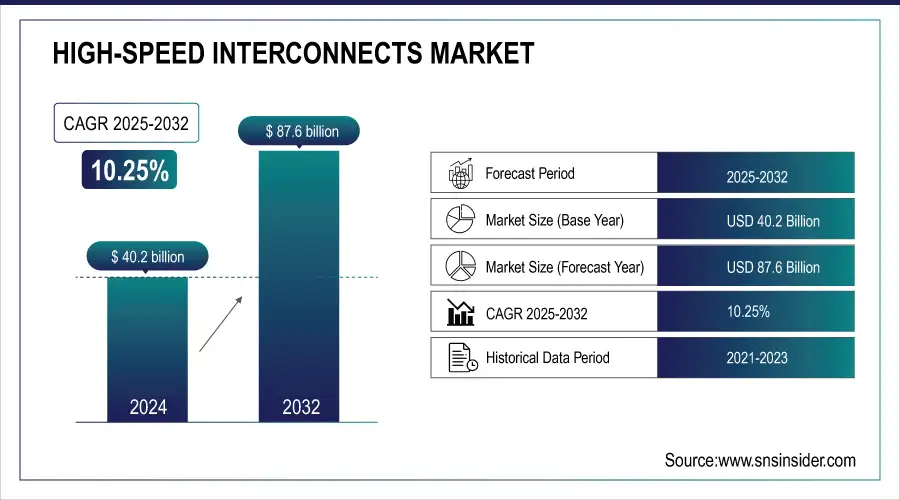
The High-Speed Interconnects Market size was valued at USD 40.2 billion in 2024 and is expected to reach USD 87.6 billion by 2032, growing at a CAGR of 10.25% during 2025-2032.
The high-speed interconnects market growth is fueled by increasing demand for high-performance computing, data centers, and cloud services. Even the rising adoption of AI, IoT, and 5G technologies gives market growth another push. High-speed interconnects market trend includes the demand for high-speed interconnects is often determined by a shift toward optical interconnect, increased bandwidth requirements, technological advancement connectivity solutions for a hyperscale data center. Similarly, it is also driven by the increasing demand for low-latency and high-throughput communication systems. North America and Asia-Pacific are at the forefront of adoption owing to robust IT infrastructure and industrial digitalization. The high-speed interconnects market analysis showcases a trending CAGR over the forecast period due to players investing in R&D for innovative solutions. Future predictions indicate continued momentum, as sectors such as automotive, aerospace healthcare, which are reliant on high-speed and dependable data, offer expansive expansion opportunities.
High-Speed Interconnects Market Size and Forecast
-
Market Size in 2024: USD 40.2 Billion
-
Market Size by 2032: USD 87.6 Billion
-
CAGR: 10.25% from 2025 to 2032
-
Base Year: 2024
-
Forecast Period: 2025–2032
-
Historical Data: 2020–2023
To Get more information on High-speed Interconnects Market - Request Free Sample Report
High-Speed Interconnects Market Trends (with stats):
-
Surging data center and cloud traffic is driving adoption of high-speed interconnects, with global data traffic growing at 25%+ annually, accelerating demand for 400G and 800G connectivity.
-
Rapid growth of AI/ML workloads is increasing need for low-latency, high-bandwidth interconnects, as AI servers require 2–3× higher bandwidth than traditional servers.
-
Expansion of 5G networks is boosting demand for high-speed optical and electrical interconnects, with over 60% of telecom infrastructure upgrades relying on fiber-based links.
-
Rising deployment of PCIe Gen5/Gen6 and CXL interfaces is enhancing server and storage performance, improving data transfer speeds by 50–100% over previous generations.
-
Increasing adoption of co-packaged optics (CPO) and silicon photonics is improving power efficiency, reducing interconnect power consumption by 30–40% in hyperscale data centers.
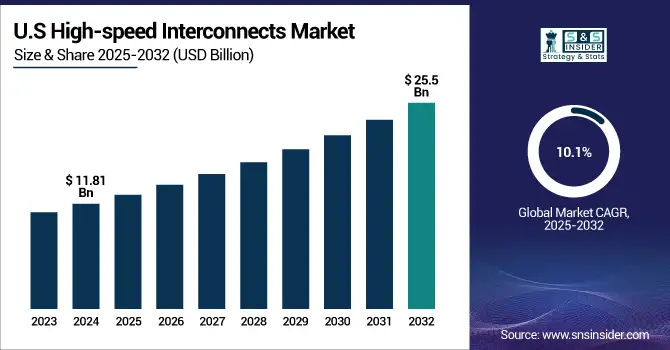
The U.S. market for high-speed interconnects will witness soaring growth due to the expansion of data centers, proliferation of 5G networks, and the demand for high-bandwidth applications. The market size in 2024 is estimated to be around USD 11.81 billion and is projected to reach USD 25.5 billion by 2032, growing at a strong CAGR of 10.1% during the period between 2024 to 2032. Factors driving the growth of this market include the ramping up of artificial intelligence and internet of things technologies, along with the higher adoption of optical interconnects, and the emergence of standards such as Compute Express Link and Universal Chiplet Interconnect Express.
High-Speed Interconnects Market Dynamics:
Drivers:
-
Rising Demand for Data-Intensive Applications Is Driving the Adoption of High-Speed Interconnects
Growing demand for data-intensive applications such as AI, machine learning, cloud computing, and 4K/8K Video streaming. Traditional interconnects are not able to provide the level of efficiency required for ultra-fast data transmission with minimal latency, as is needed in the data centers and enterprise networks. To counter this, organizations must adopt advanced interconnect technologies, including optical cables, InfiniBand, and PCIe. The deployment of 5G networks and edge computing solutions adds fuel to this fire. High-speed interconnect acts as an essential element of the infrastructure, providing a marketplace for appliance builders to improve performance and deliver real-time data upon which businesses rely, ensuring that the global marketplace continues to grow.
The number of hyperscale data centers was raised to around 1,136 in 2024, reflecting the growing infrastructure supporting data-intensive operations.
Restraints:
-
High Implementation Costs Are Restraining Widespread Adoption Across Smaller Enterprises
High-speed interconnects, while enticing from a performance perspective, often come with a heavy upfront cost that limits their adoption, at least by small and mid-sized companies. This cost encompasses not only high-end hardware but its integration and upkeep, and the need for specialized professionals. Moreover, obsolete infrastructure would need to be heavily overhauled, entirely re-wired to handle high-speed systems. For organizations that might have tighter budgets, these costs can be a barrier to the commercial rollout. Consequently, although demand continues to increase, its pace of uptake in particular emerging markets is hampered by price sensitivity and budget limitations.
The certification for high-speed I/O connectors costs between USD 50,000 and USD 500,000 per cycle, covering tests like bandwidth and signal integrity. These high costs often delay adoption, especially for SMEs with limited budgets.
Opportunity:
-
Growth of Hyperscale Data Centers Is Creating Significant Opportunities for High-Speed Interconnect Deployment
Hyperscale data centers are one of the high-speed interconnects market, which witnessed significant growth in recent years. Search engines are an extreme example, as companies like Google, Microsoft, and Amazon invest billions into massive data infrastructures that, to work, need interconnections that are fast, low-latency, and high-capacity. They serve essential functions such as AI model training, cloud storage, and real-time analytics, where data flow speed is the most important. Interconnects that enable high speeds make it easy for the data to be transferred internally across the switches and storage units, and servers. With the uptick in cloud adoption and digital transformation across industries, the need for interconnect solutions, both high-performing and scalable, for data centers will significantly increase.
For instance, the number of hyperscale data centers worldwide increased to 1,136 in 2024, nearly doubling over the past five years.
Challenge:
-
Lack of Interoperability and Standardization Is Challenging Seamless Integration Across Systems
There is another challenge for the high-speed interconnects market, which comes with the absence of uniform standards and interoperability between different systems and vendors. The market is changing fast with new technologies emerging, such as CXL, UCIe, and silicon photomics, and it is becoming more and more challenging to ensure that devices from different manufacturers can talk to each other. This is especially true in heterogeneous environments, and can lead to compatibility problems, integration delays, and more complexity in the overall system. This leads organizations to rely on proprietary solutions, cutting down flexibility and limiting scale. Some of these barriers must be overcome by the industry as a whole, so common standards enable seamless adoption for diverse use cases.
In 2023, a supplier diverted 15% of its R&D budget to handle 23 certification processes, delaying PCIe 6.0-compliant connector release by six months.
High-Speed Interconnects Market Segmentation Analysis:
By Type
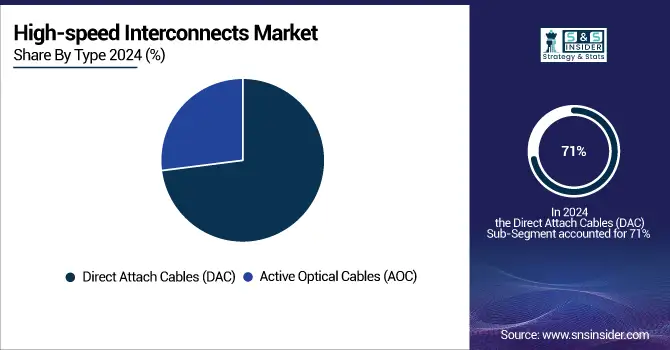
The direct attach cables segment dominated the market and accounted for 71% of the high-speed interconnects market share in 2024. As it is more cost-effective than other alternatives, and can be deployed more easily in short-distance data center applications. Designed for high-speed server-to-switch connections with low latency and high reliability. Lastly, hyperscale data centers and cloud infrastructure will continue to demand the market to remain high through 2032.
For instance, in September 2024, FS introduced 1.6T OSFP DAC cables delivering up to 1600 Gbps throughput with ultra-low power consumption. These cables are designed for hyperscale data centers, machine learning, and high-performance computing applications, featuring superior mechanical durability and excellent shielding.
The active optical cables segment is expected to register the fastest CAGR during the forecast period, As Rising demand for data centers and telecom networks which requires high-bandwidth, long-distance interconnects. Key growth drivers consist of higher optical technology, low electricity consumption as well as 5G infrastructure; the excessive growth is anticipated by using 2032.
By Application
The data centers segment dominated the high-speed interconnects market and accounted for 42% of revenue share in 2023. The increased growth of hyperscale facilities and demand for low-latency, high-bandwidth connections. As the segment is expected to retain its market share as a result of continual global digital transformation, as well as infrastructure upgrades through 2032, with growing investments in AI, cloud computing, and virtualization.
In April 2025, Researchers have developed neuromorphic optical signal processors enabling 1.6 Tbit/s data center interconnects over 5 km without using DSPs. These OSPs cut latency by 10,000× and energy use by 1,000×, making them ideal for next-gen AI infrastructure.
The telecom segment is anticipated to have fastest CAGR during the forecast period, induced by 5G deployment, edge computing and IoT explosion. The increasing need for high speed data transfer in mobile networks and low latency is driving the adoption of high speed interconnect in mobile networks, especially in developing regions. The growth is expected remain high until 2032.
High-Speed Interconnects Market Regional Outlook:
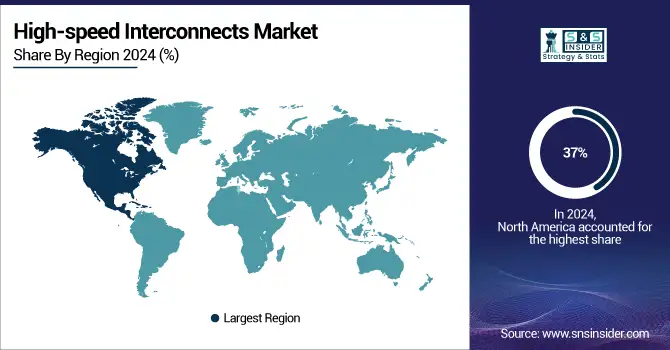
North America dominated the high-speed interconnects market in 2024 and accounted for 37% of revenue share, driven by a mature IT infrastructure, high levels of large-scale data center implementation, and higher speed of AI and cloud technology adoption. Continued investment by tech giants like Google, Meta, and AWS, and trends in 5G rollout and edge computing will keep it dominant until 2032.
Get Customized Report as per Your Business Requirement - Enquiry Now
The Asia-Pacific market is anticipated to register the fastest CAGR, due to modernization, a rise in the data center across China, India, and Singapore, and government initiatives for prompt infrastructure development. RTG states that growing demand for enhanced speed connectivity along with augmented adoption of AI, IoT, and 5G technology will accelerate regional market growth over the forecast timeline.
The Asia-Pacific high-speed interconnects market is significantly dominated by China as it has initiated hyperscale data center investments, extremely fast 5G deployment, and digital infrastructure schemes with the support of its government. China is forecast to continue its strengthening and tech-leading growth until 2032, with the increasing AI and cloud adoption.
Growing need for localization of data, green data centers, and development of AI and quantum computing is demanding high-speed interconnects in Europe. The rise in regulatory support and investments in the digital infrastructure is anticipated to accelerate digital adoption, while comprehensive growth of major economies is projected to be steady until 2032.
The German market is the largest in Europe because of its industrial strength, growing adoption of cloud services and early implementation of Industry 4.0 technologies. Endeavoring and continued focus toward 5G, edge computing, and smart manufacturing are anticipated to drive the demand for high-speed interconnects in enterprise and telecom industries.
Key Players
The major high-speed interconnects market companies are Broadcom, Intel, Cisco Systems, NVIDIA (Mellanox), Amphenol, TE Connectivity, Molex, Samtec, Huawei Technologies, Leoni AG, and others
Recent Developments
-
In March 2025, at OFC 2025, Broadcom showcased advancements in co-packaged optics (CPO), 200G/lane DSP and SerDes, and PCIe Gen6 over optics, highlighting a roadmap towards 200T optical interconnect solutions for AI infrastructure.
-
In April 2025, Broadcom introduced the Sian3 and Sian2M AI networking chips, utilizing 3nm process technology to enhance performance and power efficiency, crucial for scaling AI and machine learning clusters.
|
Report Attributes |
Details |
|
Market Size in 2024 |
USD 40.2 Billion |
|
Market Size by 2032 |
USD 87.6 Billion |
|
CAGR |
CAGR of 10.25 % From 2025 to 2032 |
|
Base Year |
2024 |
|
Forecast Period |
2025-2032 |
|
Historical Data |
2021-2023 |
|
Report Scope & Coverage |
Market Size, Segments Analysis, Competitive Landscape, Regional Analysis, DROC & SWOT Analysis, Forecast Outlook |
|
Key Segments |
• By Type (Direct Attach Cables (DAC), Active Optical Cables (AOC)) |
|
Regional Analysis/Coverage |
North America (US, Canada, Mexico), Europe (Germany, France, UK, Italy, Spain, Poland, Turkey, Rest of Europe), Asia Pacific (China, India, Japan, South Korea, Singapore, Australia, Rest of Asia Pacific), Middle East & Africa (UAE, Saudi Arabia, Qatar, South Africa, Rest of Middle East & Africa), Latin America (Brazil, Argentina, Rest of Latin America) |
|
Company Profiles |
Broadcom, Intel, Cisco Systems, NVIDIA (Mellanox), Amphenol, TE Connectivity, Molex, Samtec, Huawei Technologies, Leoni AG. and others in report. |
Get in Touch
