Hydrographic Survey Equipment Market Report Scope & Overview:
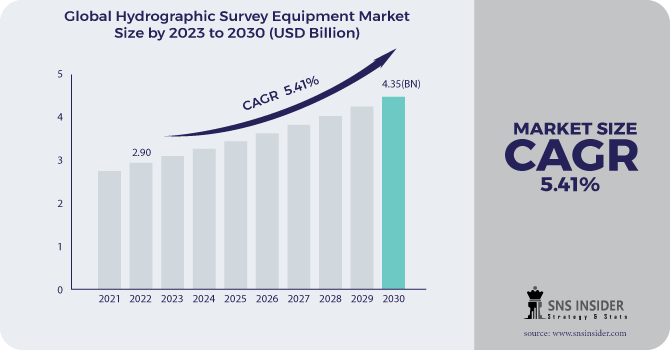
The Hydrographic Survey Equipment Market Size was valued at USD 2.90 billion in 2022 and is expected to reach USD 4.35 billion by 2030 with a growing CAGR of 5.41% over the forecast period 2023-2030.
A hydrographic survey, also known as a bathymetric survey, is the process of measuring several elements beneath the surface of the water. The survey can be carried out in both still and moving water. The basic goals of hydrographic survey equipment are tidal measurements for sea coasts, with applications ranging from marine defence works to harbour building. Data can also be used for the construction of levelling dams to reduce sounds and for determining bed depth.
To get more information on Hydrographic Survey Equipment Market - Request Free Sample Report
The hydrographic survey can also identify navigational soundings, the placement of rocks and sand bars, and the volume of underwater excavation. Hydrographic survey equipment is used in irrigation and land drainage schemes for determining the direction of current in relation to the site of the sewer, measuring the quantity of water and flow of water in relation to water schemes, and flood controls.
MARKET DYNAMICS
KEY DRIVERS
-
Increase in Maritime Commerce and Transportation
-
Offshore Renewable Wind Energy Projects are Growing
RESTRAINTS
-
Hydrographic Survey Equipment Sales Affected by High Investment Costs and Seasonal Demand
-
Inadequate Professionals to Operate Hydrographic Survey Equipment
OPPORTUNITIES
-
Hydrographic Survey Equipment Technological Advancements
-
Increase in Offshore Oil and Gas Exploration Spending
CHALLENGES
-
Oil and gas industry fluctuations
IMPACT OF COVID-19
The COVID-19 epidemic has had a negative impact on the overall marine industry, including the hydrographic survey equipment industry. Global travel limitations, as well as the prohibition of commercial and logistics trade routes around the world, had a substantial influence on enterprises operating in the hydrographic survey equipment sector. Furthermore, inadequate logistics support as a result of trade restrictions disturbed the manufacturing industry, resulting in higher overhead costs and pushing enterprises to book losses within the timeframe. Companies with worldwide supply chains may need to assess crucial components that are in limited supply and consider alternative sourcing techniques to deal with the supply-demand mismatch. the bulk of hydrographic survey equipment makers rely on China for underwater cameras and temperature, pressure, and other sensors. Furthermore, strong social distancing standards are expected to enhance the global deployment of unmanned vehicles, such as ROVs and AUVs, for conducting hydrographic surveys. The risks connected with viral dissemination have been lessened as the use of autonomous vehicles has increased.
System of Sensing During the forecast period, the segment dominated the Hydrographic Survey Equipment Market. because of increased marine commerce activities in underdeveloped economies Furthermore, various sensing systems are employed at the shore to provide increased marine security and maintain safe commerce activities between countries, which is projected to raise demand for the segment.
Positioning Techniques The category is predicted to expand due to the growing demand for reliable nautical charts. Sensors for the Sea Hydrographic surveys precisely assess the seafloor's topography and identify anchoring zones and best pathways, which is likely to enhance demand for subsea sensors.
Software: Software provides advantages such as simplicity of deployment, accuracy, and lower ownership costs, propelling the segment's growth.
Unmanned Aerial Vehicles During the projection period, the unmanned vehicles segment is expected to have the greatest CAGR. The commercial sector is increasing its need for unmanned vehicles. These vehicles are used in deep sea exploration and production, drilling support and pipeline inspection, and hydrographic surveys, which are projected to boost the segment's expansion.
Water that is shallow The market was controlled by this segment. Shallow water basins in North America, Europe, Asia-Pacific, and the Middle East are projected to drive the hydrographic survey equipment market.
Water at a Depth The segment is predicted to expand due to increased business demand for unmanned vehicles. Deepwater exploration and production activities benefit from the use of unmanned vehicles.
Charting of the Seas Navigation is made easier using nautical and hydrographic maps. This is becoming increasingly important as commercial shipping, recreational boating, and fishing activities increase, which will boost the hydrographic charting market. Survey of Offshore Oil and Gas The segment led the market in 2021 and is predicted to grow at the fastest rate during the forecast period. Rising investments in offshore oil and gas exploration by growing economies such as India, China, South Korea, and Brazil are propelling the market forward.
Port and Harbor Administration Port management entails overseeing the numerous components of the shipping industry in order to ensure effective and organised operations. Warehouses, vessels, and freight and loading docks are all part of a port. The increased development of new ports in the Middle East is also predicted to drive category expansion.
Commercial This market was driven by the commercial segment, which is predicted to increase at the fastest CAGR over the forecast period. This category is predicted to grow due to increased demand from commercial firms for dredging operations, oil and gas exploration, pipeline and cable laying, drilling activities, and offshore surveys. Increased initiatives by government organisations to supply improved survey equipment are projected to support the segment's growth. Hydrographic survey equipment provides advantages such as precision, ease of implementation, and enhanced scheduling to the research segment, which will drive the segment during the forecast period.
Defense Various countries' rising adoption of hydrographic survey equipment to provide greater safety to military personnel is expected to fuel the segment's expansion over the study period.
KEY MARKET SEGMENTATION
By Platform
-
Surface Vessels
-
USVs And UUVs
-
Aircraft
By Application
-
Hydrographic Or Bathymetry Survey
-
Port And Harbor Management
-
Offshore Oil And Gas Survey
-
Cable Or Pipeline Route Survey
-
Others
By End User
-
Commercial
-
Research
-
Defense
By Type
-
Sensing Systems
-
Subsea Sensors
-
Software
-
Unmanned Vehicles
-
Others
By Depth
-
Shallow Water
-
Deep Water
.png)
Need any customization research on Hydrographic Survey Equipment Market - Enquiry Now
REGIONAL ANALYSIS
Because of the presence of important technology businesses such as Teledyne Technologies Inc. and Mitcham Industries Inc., North America dominated the worldwide hydrographic survey equipment market in 2021. The presence of key hydrographic survey equipment providers such as Innomar Technologie GmbH and Ixblue SAS is projected to promote regional market growth.
Asia-Pacific This region's Hydrographic Survey Equipment Market is expected to grow at the fastest rate during the forecast period. The region's market growth is being driven by increased marine trade with developing countries such as India and China.
Africa and the Middle East Increased investments in hydrographic survey equipment by major oil and gas firms are likely to boost market expansion in the region.
South America The region's demand for hydrographic survey equipment is likely to rise as the number of deep water activities increases in nations such as Brazil and Mexico.
REGIONAL COVERAGE:
-
North America
-
USA
-
Canada
-
Mexico
-
-
Europe
-
Germany
-
UK
-
France
-
Italy
-
Spain
-
The Netherlands
-
Rest of Europe
-
-
Asia-Pacific
-
Japan
-
south Korea
-
China
-
India
-
Australia
-
Rest of Asia-Pacific
-
-
The Middle East & Africa
-
Israel
-
UAE
-
South Africa
-
Rest of Middle East & Africa
-
-
Latin America
-
Brazil
-
Argentina
-
Rest of Latin America
-
KEY PLAYERS
The Major Players are Edgetech, Ixblue SAS, XYLEM, Teledyne Technologies Inc., Innomar Technologie GmbH, Sonardyne International Ltd., Tritech International Ltd, Syqwest Inc., Valeport Ltd., KONSBERG GRUPPEN ASA, and other players.
Edgetech-Company Financial Analysis
| Report Attributes | Details |
|---|---|
| Market Size in 2022 | US$ 2.90 Billion |
| Market Size by 2030 | US$ 4.35 Billion |
| CAGR | CAGR of 5.41% From 2023 to 2030 |
| Base Year | 2022 |
| Forecast Period | 2023-2030 |
| Historical Data | 2020-2021 |
| Report Scope & Coverage | Market Size, Segments Analysis, Competitive Landscape, Regional Analysis, DROC & SWOT Analysis, Forecast Outlook |
| Key Segments | • By Platform (Surface Vessels, USVs And UUVs, Aircraft) • By Application (Hydrographic Or Bathymetry Survey, Port And Harbor Management, Offshore Oil And Gas Survey, Cable Or Pipeline Route Survey, Others) • By End User (Commercial, Research, Defense) • By Type (Sensing Systems, Positioning Systems, Subsea Sensors, Software, Unmanned Vehicles, Others) • By Depth (Shallow Water, Deep Water) |
| Regional Analysis/Coverage | North America (USA, Canada, Mexico), Europe (Germany, UK, France, Italy, Spain, Netherlands, Rest of Europe), Asia-Pacific (Japan, South Korea, China, India, Australia, Rest of Asia-Pacific), The Middle East & Africa (Israel, UAE, South Africa, Rest of Middle East & Africa), Latin America (Brazil, Argentina, Rest of Latin America) |
| Company Profiles | Edgetech, Ixblue SAS, XYLEM, Teledyne Technologies Inc., Innomar Technologie GmbH, Sonardyne International Ltd., Tritech International Ltd, Syqwest Inc., Valeport Ltd., KONSBERG GRUPPEN ASA, and other players. |
| DRIVERS | • Increase in Maritime Commerce and Transportation • Offshore Renewable Wind Energy Projects are Growing |
| RESTRAINTS | • Hydrographic Survey Equipment Sales Affected by High Investment Costs and Seasonal Demand • Inadequate Professionals to Operate Hydrographic Survey Equipment |
Frequently Asked Questions
Manufacturers/Service provider, Consultant, Association, Research institute, private and universities libraries, Suppliers and Distributors of the product.
The sample for the Hydrographic Survey Equipment Market report is available on the website upon request. To obtain the sample report, you can also use the 24*7 chat support and direct call services.
The COVID-19 epidemic has had a negative impact on the overall marine industry, including the hydrographic survey equipment industry. Global travel limitations, as well as the prohibition of commercial and logistics trade routes around the world, had a substantial influence on enterprises operating in the hydrographic survey equipment sector.
North America dominated the worldwide hydrographic survey equipment market in 2021 and Asia-Pacific This region's Hydrographic Survey Equipment Market is expected to grow at the fastest rate during the forecast period.
According to SNS insiders, the Hydrographic Survey Equipment Market size was USD 2.71 billion in 2021 and is expected to reach USD 3.98 billion by 2028 with a CAGR of 5.41% over the forecasted period.
Oil and gas industry fluctuations
Financial, Products/ Services Offered, SWOT Analysis, The SNS view
North America dominated the worldwide hydrographic survey equipment market in 2021.
Hydrographic Survey Equipment Sales Affected by High Investment Costs and Seasonal Demand and Inadequate Professionals to Operate Hydrographic Survey Equipment
According to SNS insiders, the Global Hydrographic Survey Equipment Market size was USD 2.71 billion in 2021 and is expected to reach USD 3.98 billion by 2028 with a CAGR of 5.41% over the forecasted period.
Get in Touch
