Industrial Wastewater Treatment Chemicals Market Report Scope and Overview:
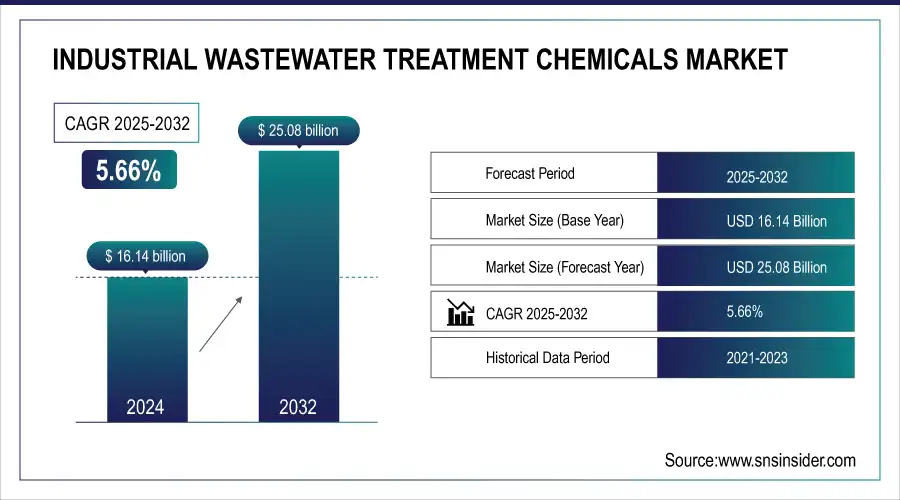
The Industrial Wastewater Treatment Chemicals Market Size was valued at USD 16.14 Billion in 2024 and is expected to reach USD 25.08 billion by 2032 and grow at a CAGR of 5.66% over the forecast period 2025-2032.
To Get more information on Industrial Wastewater Treatment Chemicals Market - Request Free Sample Report
The growing shortage of clean water sources is a major factor contributing to the expansion of the industrial wastewater treatment chemicals market. Industries are pressured to find new solutions to meet their water needs as freshwater availability decreases because of factors such as population growth, climate change, and over-extraction of water sources. Utilizing advanced treatment technologies to recycle and reuse wastewater has become crucial.
Industries can use technologies like membrane filtration, reverse osmosis, and advanced oxidation processes to treat and purify wastewater produced during their operations. This processed water can be recycled for different industrial purposes, decreasing the need for new water sources. Utilizing these advanced treatment systems not only aids industries in meeting environmental regulations but also promotes sustainable water management practices. By reusing wastewater, industries can save precious water resources, reduce costs, and decrease their environmental impact, ultimately promoting sustainability and resource efficiency.
For instance, in 2023, the United Arab Emirates launched a large-scale desalination plant using advanced reverse osmosis technology, aiming to boost water supply while reducing energy consumption and environmental impact.
Industrial Wastewater Treatment Chemicals Market Size and Forecast:
-
Market Size in 2024: USD 16.14 Billion
-
Market Size by 2032: USD 25.08 Billion
-
CAGR from 2025 to 2032: 5.66%
-
Base Year: 2024
-
Forecast Period: 2025–2032
-
Historical Data: 2021–2023
Industrial Wastewater Treatment Chemicals Market Highlights:
-
Growing awareness among industries and the public about the environmental impact of untreated wastewater is driving demand for improved wastewater management and sustainability practices.
-
The U.S. EPA’s 2023 Water Reuse Action Plan promotes advanced water reuse technologies and sustainable water management across industries.
-
Increasing demand for chemically treated water in industrial, municipal, and agricultural applications is a major market growth driver.
-
Regulatory frameworks, such as the EU Water Framework Directive, are enforcing strict water quality standards, boosting investment in chemical treatment infrastructure.
-
Companies are expanding product portfolios, e.g., Dow Chemical’s 2022 launch of advanced ion exchange resins for industrial water treatment.
-
High costs of sophisticated water treatment methods (membrane filtration, reverse osmosis, chemical treatment) pose significant market restraints, especially for SMEs and developing regions.
-
Additional financial challenges include energy consumption, skilled labor costs, and limited government subsidies, which can hinder adoption of advanced wastewater treatment solutions.
Moreover, Increased awareness within industries and the public about the environmental effects of untreated wastewater is causing an increase in the need for improved wastewater management procedures. Companies are placing more emphasis on sustainability and corporate social responsibility, particularly regarding adequate wastewater treatment.
In 2023, the U.S. Environmental Protection Agency partnered with private industries to launch the Water Reuse Action Plan, focusing on enhancing water reuse technologies and promoting sustainable water management practices across various sectors.
Industrial Wastewater Treatment Chemicals Market Drivers:
- Increasing demand for chemical-treated water in various applications will drive market growth
The rising need for water treated with chemicals in different applications is a major factor driving market expansion. Chemical treatment plays a vital role in maintaining water quality in industrial processes, municipal water treatment, and agricultural uses. In industry, treated water is crucial for cooling, boiler feed, and manufacturing processes to avoid equipment corrosion, scaling, and fouling, which can lower operational efficiency and raise maintenance expenses.
Furthermore, the Water Framework Directive of the European Union enforces strict water quality standards, leading to the implementation of chemical treatment methods in member countries. In 2023, the European Commission indicated a 15% rise in investments for chemical treatment infrastructure in order to comply with these regulations.
Additionally, the companies are focused on launching new products in the market to increase their product portfolio in a particular line. Dow Chemical 2022 launched advanced ion exchange resins for industrial water treatment, enhancing the removal of contaminants and extending the lifespan of treatment systems.
Industrial Wastewater Treatment Chemicals Market Restraints:
- The high cost associated with water treatment hamper the market growth.
The considerable expense of water treatment is a major hindrance to market expansion. Sophisticated water treatment methods like membrane filtration, reverse osmosis, and chemical treatment demand significant financial commitment for equipment and maintenance. Small and medium-sized enterprises in less developed areas frequently face challenges in funding these technologies, which hinders their ability to utilize them effectively. In addition, the financial burden is increased by energy consumption costs, skilled labor expenses, and strict environmental regulations, making it difficult for numerous sectors to rationalize the investment. Government subsidies and financial incentives do not always provide enough support to cover these costs, which also limits market growth. The significant obstacle posed by the expensive water treatment costs particularly affects industries and regions with limited financial resources, which hinders the overall market growth.
Industrial Wastewater Treatment Chemicals Market Segment Analysis:
By Type
The coagulants & flocculants held the largest market share in the type segment around 37.12% in 2024. These substances are vital for efficiently eliminating suspended solids, colloidal particles, and impurities from water, a crucial stage in municipal and industrial water treatment. Coagulants cancel out particle charges, making them stick together, while flocculants help clumps become bigger flocs that can be removed easily through sedimentation, filtration, or flotation. The prevalent use of coagulants and flocculants in different sectors such as municipal water treatment, industrial wastewater management, and process water treatment in industries like paper and pulp, mining, and food and beverages, contributes to their market dominance. Furthermore, the ongoing improvement of more effective and environmentally friendly formulations has increased their efficacy and expanded their range of uses, thus strengthening their position in the market.
By End-User Industry
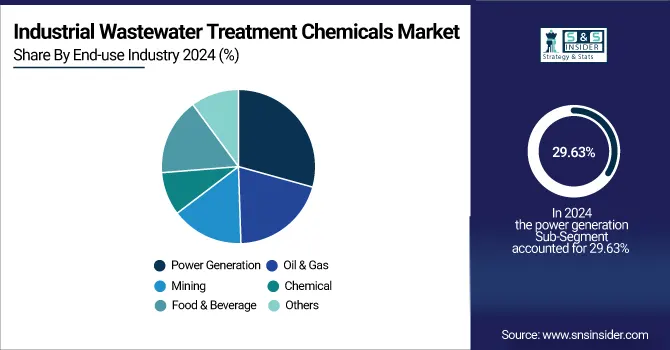
In the end-user industry segment power generation held the largest market share around 29.63% in 2024. Power plants, such as coal, nuclear, gas, or renewable ones, need significant amounts of water for different important activities like cooling, generating steam, and cleaning. The strong demand for water in these activities requires effective treatment options to guarantee that water quality complies with operational and regulatory requirements. Water is necessary for cooling systems in coal and nuclear power plants to regulate turbine heat and avoid overheating. The necessity of regular treatment is required for these plants to keep water clean and prevent issues like scaling, corrosion, and fouling, which can decrease efficiency and raise maintenance expenses.
Industrial Wastewater Treatment Chemicals Market Regional Analysis:
North America Industrial Wastewater Treatment Chemicals Market Trends:
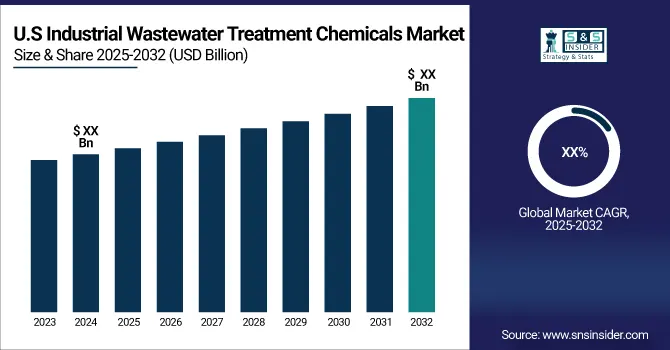
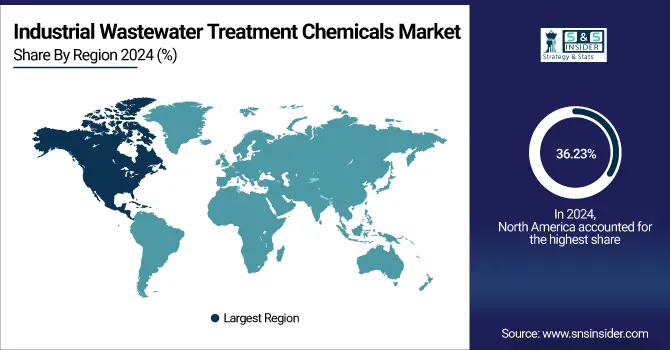
North America dominated the industrial wastewater treatment chemicals market with the highest revenue share of about 36.23% in 2023. Due to advanced infrastructure, strict regulations, and high industrial activity levels. The strong industrial foundation in the area, which consists of important industries like manufacturing, pharmaceuticals, and energy, generates a significant need for efficient wastewater treatment methods. Stringent environmental regulations in North America, like the U.S. Clean Water Act and Canada's similar regulations, require strict treatment standards and encourage the development of advanced technologies through investment. Furthermore, the region's emphasis on sustainability and innovation encourages the utilization of advanced treatment options such as smart technology and environmentally friendly chemicals. Major water treatment companies and continuous investments in infrastructure bolster North America's dominant status in the global industrial wastewater treatment chemicals market.
Get Customized Report as per Your Business Requirement - Enquiry Now
Europe Industrial Wastewater Treatment Chemicals Market Trends:
Europe held a significant share in the industrial wastewater treatment chemicals market due to the presence of numerous industrial hubs, including chemical, automotive, and pharmaceutical sectors. Strict environmental regulations, such as the EU Water Framework Directive, drive the adoption of advanced wastewater treatment solutions. The region emphasizes sustainability and eco-friendly chemical usage, encouraging innovations in green and efficient treatment technologies. Investments by major water treatment companies and growing industrial modernization support Europe’s strong position in the global market.
Asia-Pacific Industrial Wastewater Treatment Chemicals Market Trends:
Asia-Pacific is witnessing rapid growth in the industrial wastewater treatment chemicals market, driven by expanding industrialization, urbanization, and population growth. Countries like China, India, and Japan are investing heavily in wastewater treatment infrastructure to meet environmental standards. The rise of chemical, textile, and pharmaceutical industries increases demand for advanced treatment chemicals. Government initiatives promoting sustainable water management and the adoption of smart treatment technologies further accelerate market growth in the region.
Latin America Industrial Wastewater Treatment Chemicals Market Trends:
Latin America shows steady growth in the industrial wastewater treatment chemicals market due to industrial expansion in sectors like mining, manufacturing, and agriculture. Growing environmental awareness and implementation of regulations encourage industries to adopt efficient wastewater treatment solutions. Investments in water treatment infrastructure and partnerships with global chemical companies contribute to market development. Focus on sustainability and modernization of wastewater systems supports the market’s upward trajectory.
Middle East & Africa Industrial Wastewater Treatment Chemicals Market Trends:
The Middle East & Africa market is expanding due to industrial development in oil & gas, petrochemicals, and energy sectors. Water scarcity and stringent environmental standards drive the adoption of efficient and sustainable wastewater treatment solutions. Investments in advanced treatment technologies, such as desalination and chemical treatment, are increasing. Government initiatives to enhance water reuse and recycling, along with rising awareness of environmental sustainability, bolster the market’s growth in the region.
Industrial Wastewater Treatment Chemicals Market Key Players:
-
Veolia Water Technologies
-
Suez Water Technologies
-
Ecolab Inc.
-
Kemira Oyj
-
Kurita Water Industries Ltd.
-
BASF SE
-
Dow Inc.
-
SNF Floerger
-
Solenis LLC
-
IXOM
-
Fluence Corporation Limited
-
Aquatech International Corporation
-
GE Water & Process Technologies
-
Calgon Carbon Corporation
-
Napier Reid Ltd.
-
Corix Water System
-
WPL Limited
-
Triveni Engineering & Industries Ltd.
-
Thermax Limited
-
Accepta Water Treatment
Industrial Wastewater Treatment Chemicals Market Competitive Landscape:
Veolia Water Technologies, established in 1853, is a global leader in water and wastewater treatment solutions. The company provides innovative and sustainable technologies for industrial, municipal, and commercial clients, focusing on water purification, resource recovery, and environmental protection. Veolia emphasizes digitalization, smart solutions, and eco-friendly chemicals to optimize operations and support global water sustainability initiatives.
-
In 2023, Veolia introduced its latest system, "Actiflo™ Turbo," in the Asia Pacific region. The system aims to improve water and wastewater treatment effectiveness through enhanced flocculation and sedimentation features. This technology is designed to enhance performance in situations with high turbidity levels and assist industries dealing with fast wastewater production.
SUEZ, established in 1858, is a global leader in water and waste management solutions. The company offers advanced industrial wastewater treatment, water purification, and resource recovery services, focusing on sustainability and environmental protection. Leveraging innovative technologies and digital solutions, SUEZ helps industries optimize water use, reduce environmental impact, and implement efficient, eco-friendly wastewater treatment processes worldwide.
-
In 2023, SUEZ launched the Actiflo Turbo, an advanced water treatment solution that integrates enhanced flocculation and filtration technologies to improve the efficiency of industrial wastewater treatment chemical processes.
Pentair, established in 1966, is a global provider of water treatment and fluid management solutions. The company specializes in advanced filtration, purification, and wastewater treatment technologies for industrial, commercial, and residential applications. Pentair focuses on sustainability, energy efficiency, and innovative solutions to optimize water use, improve operational performance, and support environmentally responsible water management practices worldwide.
-
In 2022, Pentair introduced the Everpure Claris Ultra, a new water filtration system designed for industrial applications, which offers enhanced filtration efficiency and cost savings in wastewater treatment.
| Report Attributes | Details |
|---|---|
| Market Size in 2024 | USD 16.14 Billion |
| Market Size by 2032 | USD 25.08 Billion |
| CAGR | CAGR of 5.66% From 2025 to 2032 |
| Base Year | 2024 |
| Forecast Period | 2025-2032 |
| Historical Data | 2021-2023 |
| Report Scope & Coverage | Market Size, Segments Analysis, Competitive Landscape, Regional Analysis, DROC & SWOT Analysis, Forecast Outlook |
| Key Segments | • By Type (Corrosion inhibitors, Scale inhibitors, Coagulants & flocculants, Biocides & disinfectants, Chelating agents, Anti-foaming agents, pH adjusters and stabilizers, Others) • By End-use industry (Power Generation, Oil & Gas, Mining, Chemical, Food & Beverage, Others) |
| Regional Analysis/Coverage | North America (USA, Canada, Mexico), Europe (Germany, UK, France, Italy, Spain, Netherlands, Rest of Europe), Asia-Pacific (Japan, South Korea, China, India, Australia, Rest of Asia-Pacific), The Middle East & Africa (Israel, UAE, South Africa, Rest of Middle East & Africa), Latin America (Brazil, Argentina, Rest of Latin America) |
| Company Profiles | Veolia Water Technologies, Suez Water Technologies, Ecolab Inc., Kemira Oyj, Kurita Water Industries Ltd., BASF SE, Dow Inc., SNF Floerger, Solenis LLC, IXOM, Fluence Corporation Limited, Aquatech International Corporation, GE Water & Process Technologies, Calgon Carbon Corporation, Napier Reid Ltd., Corix Water System, WPL Limited, Triveni Engineering & Industries Ltd., Thermax Limited, Accepta Water Treatment. |
Get in Touch
