Inorganic Chemical Packaging Market Report Scope And Overview:
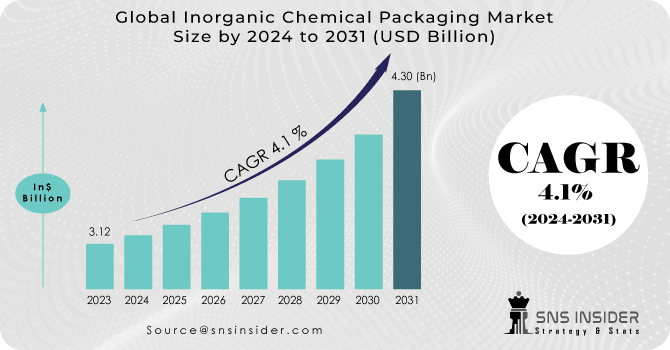
The Inorganic Chemical Packaging Market Size was valued at USD 3.12 billion in 2023 and is expected to reach USD 4.30 billion by 2031 and grow at a CAGR of 4.1 % over the forecast period 2024-2031.
The Inorganic Chemical Packaging Market provides specialized packaging solutions for the storage, transportation, and handling of non-carbon-based chemicals. These chemicals are vital across industries like manufacturing, agriculture, healthcare, and construction. Proper packaging is crucial to ensure safety, regulatory compliance, and product integrity throughout the supply chain. It involves containers, drums, totes, and specialized materials designed to resist corrosion, prevent leakage, and protect against external factors like moisture and temperature changes. Inorganic chemical packaging is essential in the chemical industry for safeguarding human health, the environment, and chemical quality. Tailored packaging solutions are necessary to accommodate diverse chemical properties, ensuring safe and optimal transport. Compliance with strict regulations is crucial for risk management and responsible chemical handling practices.
Get More Information on Inorganic Chemical Packaging Market - Request Sample Report
Packaging inorganic chemicals poses significant challenges due to the variety of compounds and potential risks involved. Inadequate packaging can render chemicals useless, harm the environment, or endanger users and warehouse staff. Proper packaging plays a crucial role in ensuring the safe handling and storage of these chemicals, preventing accidents and fatalities such as fire explosions. Inorganic chemicals, which lack carbon and may include elements like carbon monoxide and carbon dioxide, drive market growth, particularly in the fertilizers sector. China and India, known for low labor costs, attract international production hubs, reducing overall manufacturing costs. Increasing environmental awareness and stricter regulations drive companies to adopt eco-friendly technologies and products.
MARKET DYNAMICS
KEY DRIVERS:
-
The demand for shrink drum liners in the packaging of inorganic chemicals is on the rise.
-
Expansion of production capacities across different end-use sectors like food and beverages and chemical processing.
The surge in production capacities across several end-use industries, such as food and beverage production and chemical processing, has led to a significant rise in demand for industrial chemical packaging. This is further fueled by various new industrial applications for chemicals in sectors like cosmetics, personal care products, automotive, and research and development (R&D) services.
RESTRAIN:
-
Key hindrances to market growth include rising R&D expenses and fluctuations in packaging raw material costs.
-
Complex and strict regulations on hazardous material packaging and transportation present challenges for industry players, necessitating investment in compliant packaging designs and materials.
OPPORTUNITY:
-
Demand for safe packaging solutions is growing.
Driven by innovation, the packaging industry continuously advances solutions more efficient than traditional options. Demand for safe packing of expensive items has surged recently. Innovative bulk packaging, like intermediate bulk containers, ensures secure packaging of hazardous chemicals for various applications. Flexible containers aid in chemical transfer in powder form, while rigid ones handle liquid and granulated chemicals.
CHALLENGES:
-
The Inorganic Chemical Packaging market faces supply chain disruptions due to its reliance on materials sourced globally, vulnerable to geopolitical tensions and natural disasters.
-
Market challenges include intense competition among packaging providers, resulting in price wars and margin pressures.
Impact of Russia Ukraine War
The Russia-Ukraine crisis has reverberated across global industries, notably impacting the Inorganic Chemical Packaging Market in multifaceted ways. Supply chain disruptions have emerged as a key challenge, with both Russia and Ukraine serving as significant suppliers of raw materials integral to packaging production, including metals and petrochemicals. Sanctions on Russia and the regional conflict have disrupted these supplies, leading to shortages and escalating costs. Logistical challenges have further compounded the issue, affecting shipping routes through the Black Sea and Eastern Europe, thereby impeding the timely delivery of raw materials and finished goods.
The crisis has induced cost volatility within the market, driving up prices for packaging materials, particularly those reliant on petrochemicals and metals. Additionally, the surge in energy prices, particularly in Europe, has contributed to elevated production costs for these materials. Regulatory and market uncertainty have also taken center stage, as sanctions and trade restrictions between Western countries and Russia introduce ambiguity in trade routes and material availability. This uncertainty extends to market demand for inorganic chemicals and their packaging, as industries grapple with economic uncertainties and potential disruptions in the supply chain, influencing production decisions and timelines.
Impact of Economic Slowdown
An economic slowdown significantly impacts the Inorganic Chemical Packaging Market, reducing demand due to decreased industrial activity and shifting consumer behavior. This leads to decreased production in key industries like manufacturing, construction, and automotive, resulting in deferred or canceled projects that typically require inorganic chemicals.
Operational challenges in the supply chain prompt cost-cutting measures as companies face tighter margins. While reduced congestion may improve logistics efficiency, heightened price sensitivity among consumers and businesses fosters a competitive environment where cost-effective packaging solutions are essential. As a result, companies may prioritize innovative packaging solutions to enhance value and performance, establishing differentiation in the market. The economic slowdown prompts market shifts, possibly driving consolidation as stronger companies acquire struggling counterparts, reshaping competition. Geographical variations in the downturn's impact may create new opportunities in less-affected regions.
KEY MARKET SEGMENTS
By Packaging Format
-
Drums
-
Intermediate Bulk Containers
-
Flexitanks
-
Pails & Jerry Cans
-
Bags & Sacks
-
Others
The Intermediate Bulk Containers segment dominated the Inorganic Chemical Packaging market, holding approximately 22.5% of the market share. Manufacturers globally produce a diverse array of intermediate bulk containers, including both plastic and stainless steel rigid intermediate bulk containers. The most common type of intermediate bulk containers, ranging in capacity from 800 to 1,250 liters, comprises roughly half of all supplied intermediate bulk containers.
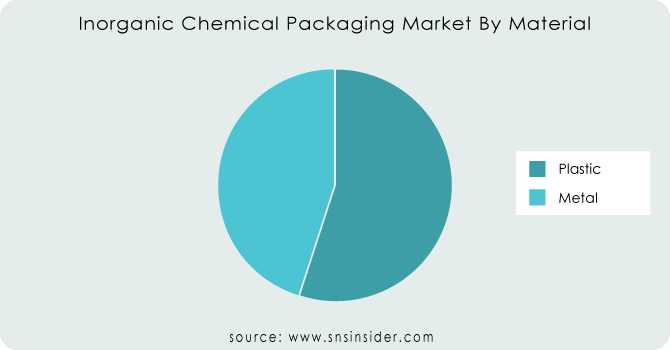
By Material
-
Metal
-
Plastic
The Plastic segment dominated the Inorganic Chemical Packaging market, holding approximately 58.8% of the market share. Plastic has emerged as the preferred material for industrial chemical packaging manufacturers, according to FMI. Recyclable plastics like high-density polyethylene (HDPE), low-density polyethylene (LDPE), polypropylene (PP), and polyvinyl chloride (PVC) are popular due to their strength and durability, essential for safe handling of industrial chemicals. Extensive research and development investments have led to the development of metallized polyethylene terephthalate (MET-PET), which is moisture-resistant and fully recyclable, making it ideal for transporting hazardous and valuable chemicals to remote areas.
Get Customized Report as per Your Business Requirement - Request For Customized Report
By Capacity
-
100-250 litres
-
250-500 litres
-
Over 500 Litres
By Application
-
Petrochemicals
-
Polymers
-
Consumer Chemicals
-
Speciality Chemicals
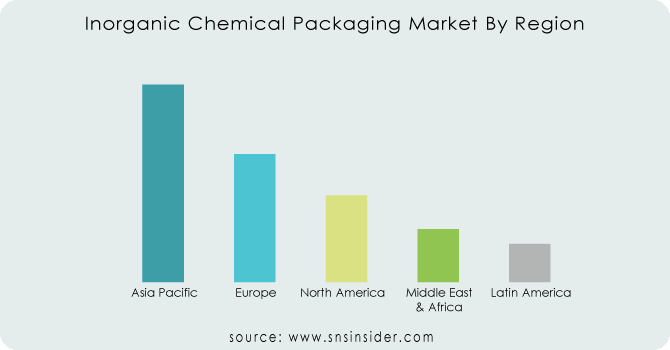
REGIONAL ANALYSIS
The Asia Pacific region dominated the Inorganic Chemical Packaging market, accounting for 42% of the market revenue. The Asia Pacific region observed a substantial share. Intermediate bulk containers (IBCs) and steel drums are regarded as secure packaging choices for such materials, thus it is predicted that the increasing occurrences of hazardous chemical storage and transportation would promote their usage. The market is expanding in the region due to health risks posed by chemical leaks and leaching, as well as the growing demand for solutions that minimize exposure to the external environment.
Europe is expected to witness significant growth during the projection. European regulatory bodies have implemented specific quantitative restrictions on the packaging of hazardous chemicals during domestic and international transit. Chemical manufacturers must comply with classification, labelling, and packaging (CLP) regulations aimed at ensuring the safe and efficient transport of hazardous products worldwide. North America is expected to be the fastest-growing region due to the strong presence of key market players and continuous technological advancements in packaging solutions, reflecting the region's dynamic market landscape and commitment to innovation. This positions it for significant growth in the evolving petrochemical packaging industry.
REGIONAL COVERAGE:
North America
-
US
-
Canada
-
Mexico
Europe
-
Eastern Europe
-
Poland
-
Romania
-
Hungary
-
Turkey
-
Rest of Eastern Europe
-
-
Western Europe
-
Germany
-
France
-
UK
-
Italy
-
Spain
-
Netherlands
-
Switzerland
-
Austria
-
Rest of Western Europe
-
Asia Pacific
-
China
-
India
-
Japan
-
South Korea
-
Vietnam
-
Singapore
-
Australia
-
Rest of Asia Pacific
Middle East & Africa
-
Middle East
-
UAE
-
Egypt
-
Saudi Arabia
-
Qatar
-
Rest of Middle East
-
-
Africa
-
Nigeria
-
South Africa
-
Rest of Africa
-
Latin America
-
Brazil
-
Argentina
-
Colombia
-
Rest of Latin America
Key players
Some of the major players in the Inorganic Chemical Packaging Market are Berry Global, TPL Plastech, The Cary Company, Hoover Ferguson Group, Milford Barrel, International Paper, Orlando Drum & Container Corporation, DS Smith, Snyder Industries, Sealed Air and other players.
Berry Global-Company Financial Analysis
RECENT DEVELOPMENTS
-
During April 2021, ProAmpac acquired IG Industries PLC and Brayford Plastics Ltd., both UK-based companies, with the objective of manufacturing recyclable packaging.
-
In October 2020, Myers Industries, Inc. acquired Elkhart Plastics, Inc., the fifth-largest rotational molder in the United States. As part of its long-term strategy to become a high-growth producer of engineered plastic solutions, this acquisition is viewed as a pivotal step towards realizing that goal.
| Report Attributes | Details |
|---|---|
| Market Size in 2023 | US$ 3.12 Billion |
| Market Size by 2031 | US$ 4.30 Billion |
| CAGR | CAGR of 4.1 % From 2024 to 2031 |
| Base Year | 2023 |
| Forecast Period | 2024-2031 |
| Historical Data | 2020-2022 |
| Report Scope & Coverage | Market Size, Segments Analysis, Competitive Landscape, Regional Analysis, DROC & SWOT Analysis, Forecast Outlook |
| Key Segments | • By Packaging Format (Drums, Intermediate Bulk Containers, Flexitanks, Pails & Jerry Cans, Bags & Sacks, Others) • By Material (Metal, Plastic) • By Capacity (100-250 Litres, 250-500 Litres, Over 500 Litres) • By Application (Petrochemicals, Polymers, Consumer Chemicals, Speciality Chemicals) |
| Regional Analysis/Coverage | North America (US, Canada, Mexico), Europe (Eastern Europe [Poland, Romania, Hungary, Turkey, Rest of Eastern Europe] Western Europe] Germany, France, UK, Italy, Spain, Netherlands, Switzerland, Austria, Rest of Western Europe]), Asia Pacific (China, India, Japan, South Korea, Vietnam, Singapore, Australia, Rest of Asia Pacific), Middle East & Africa (Middle East [UAE, Egypt, Saudi Arabia, Qatar, Rest of Middle East], Africa [Nigeria, South Africa, Rest of Africa], Latin America (Brazil, Argentina, Colombia, Rest of Latin America) |
| Company Profiles | Berry Global, TPL Plastech, The Cary Company, Hoover Ferguson Group, Milford Barrel, International Paper, Orlando Drum & Container Corporation, DS Smith, Snyder Industries, Sealed Air |
| Key Drivers | • The demand for shrink drum liners in the packaging of inorganic chemicals is on the rise. • Expansion of production capacities across different end-use sectors like food and beverages and chemical processing. |
| Restraints | • Key hindrances to market growth include rising R&D expenses and fluctuations in packaging raw material costs. • Complex and strict regulations on hazardous material packaging and transportation present challenges for industry players, necessitating investment in compliant packaging designs and materials. |
Get in Touch
