Linerless Labels Market Report Scope & Overview:
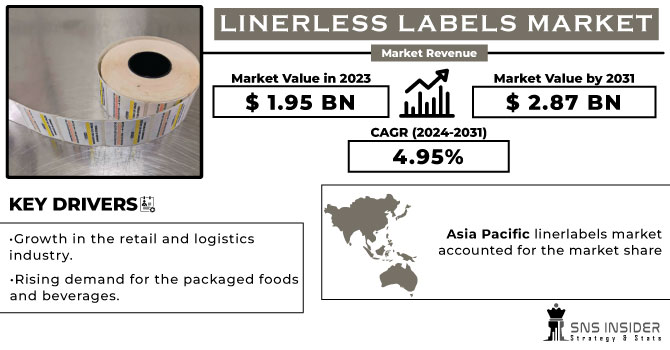
The Linerless Labels Market size was USD 1.95 billion in 2023 and is expected to Reach USD 2.87 billion by 2031 and grow at a CAGR of 4.95 % over the forecast period of 2024-2031.
The requirement for linerless labels, which is leading to increased demand in the packaging sector and thereby facilitating growth of the market, has also seen a significant increase. The demand for linerless labels has also been driven by a series of government policy guidelines in the packaging sector. The FDA requires that nutritional labels be provided for packaged and processed food products, which makes it important to label them.
Get Sample Copy of Linerless Labels Market - Request Sample Report
The market for Alcoholic Beverage with linerless labels is underpinned by increased off trade sales, a growing tourism and hospitality sector, rising disposable incomes of an expanding middle class in developing countries. Demand from the North American region is also growing on the market. For example, according to StatCan in 2022, consumers living in Canada's Quebec Province drink the most frequently and approximately 57% of respondents said they drank at least once a week. In Atlantic Canada, the rate is reduced to 28%. It appears that political party preference also affects alcohol intake, with those supporting the Liberal party most likely to drink at least once a week.
The market study in the region is driven by an increase in consumption of packaged, processed food due to rapid urbanization and industrial development. In fact, China's national statistics office says that in 2022, there are about 68.8% of the total population living in cities. Consequently, China became the world's biggest food and beverage sector due to increased demand.
Linerless labelling has been used mainly in the case of meat, fish and retail poultry packaging as it is coming into use in various categories such as chilled, convenience or products. According to Eastspring, in 2022, the food and beverage (F&B) sector in China was expected to be rapidly expanding. It is estimated that, in 2022, sales will exceed US$ 179 billion and represent 66% of global F&B revenue. Annual revenue growth of 8.38% is projected for the forecast period.
MARKET DYNAMICS
KEY DRIVERS:
-
Growth in the retail and logistics industry
Linerless labels are widely used in the retail and logistics sector because of their suitability for variable information printing and barcode labelling. The demand for effective labelling solutions is also growing, as E-commerce and Retail continue to grow.
-
Rising demand for the packaged foods and beverages.
RESTRAIN:
-
The market for linersless labels may be hampered by stringent government regulations
To require businesses to comply with difficult requirements, provide adequate space for mandatory information on labels and invest in labelling technologies that are compatible with the evolution of legislation which may have a significant impact on operating efficiency and innovation.
OPPORTUNITY:
-
Rising Technological advancements in printing technology
Technological advances allow high quality printing, barcode integration, and variable data capabilities to be used to meet the specific labelling needs of the industry.
CHALLENGES:
-
Linerless labelling faces a challenge in having substitutes available on the market.
There are viable options for enterprises, e.g. existing labels with liners or printing directly on the packaging and digital labelling technologies. In order to maintain market share in a competitive environment, transparent labels need to distinguish themselves by making their distinct benefits such as sustainability, efficiency and brand potential more obvious.
IMPACT OF RUSSIAN UKRAINE WAR:
The war caused disruption in supply routes, with the cost of raw materials such as paper and adhesives rising. Since the beginning of the war, the cost of paper has increased by 10%. Since the beginning of the war, the price of adhesives has increased by 5%. The paper imports, which were priced at about INR 70,000 per tonne before the war, had risen to over INR 1 00,000 per tonne by now. Since the start of the war, the average price of linerless labels has increased by 3%. Europe could fall into recession as a result of sanctions imposed on Russia, leading to reduced demand for linerless packaging.
IMPACT OF ONGOING RECESSION:
The global linerless labelling market is projected to increase at a compound annual growth rate of 4.8% during the forecast period. However, this growth is expected to slow down as a result of the ongoing recession. Business costs could also increase as a result of the recession, which might make it difficult for companies to raise their expenditure on Linerless Labelling. Depending on the Region, the effects of the recession will vary between linersless labelling markets. It is therefore anticipated that the market in North America will have a greater impact than Asia Pacific. North America is, for instance, more advanced and has a greater level of consumer spending.
KEY MARKET SEGMENTS
By Composition
-
Adhesive
-
Facestock
-
Topcoat
By Product
-
Variable Imaged
-
Primary
By Printing Ink
-
UV Curable
-
Water-Based
-
Solvent-Based
-
Others
By Adhesion
-
Removable
-
Permanent
-
Repositionable
By Printing Technology
-
Digital
-
Letterpress
-
Flexographic
-
Offset
-
Others
By End Use
-
Food & Beverages
-
Pharmaceuticals
-
Retail
-
Logistics
-
Others
REGIONAL ANALYSIS
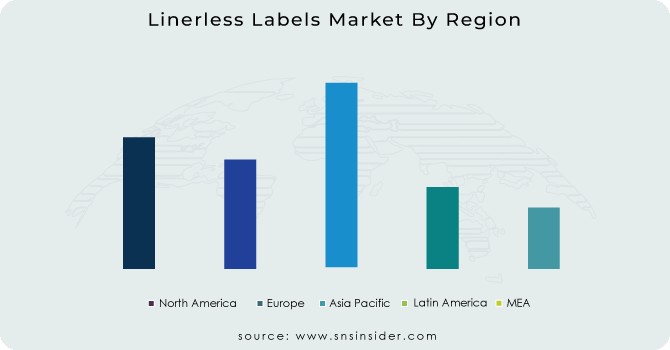
Asia Pacific linerlabels market accounted for the market share of USD 1025.35 million in terms of revenue, in the year 2022. This is due to the expansion of retail end use industry. The growth of e-commerce sector has also given market growth in the region. Over the forecast period, the Asia Pacific region is expected to grow at the fastest rate. Due to the rise in disposable income the market in this region will expand quicky.
Europe is the largest market for the linerless labels. More than 40% of market share is acquired by European region. The technological development has given rise to the market in this region. The rise of packaging sector in France, along with the increase in food and beverages consumption is driving the demand for the market.
North American market is expected to be the second largest market due to the adoption of advanced printing technologies in industry. US will be dominating the market with the highest market share followed by Canada over the forecast period.
Get Customized Report as per Your Business Requirement - Request For Customized Report
REGIONAL COVERAGE:
North America
-
US
-
Canada
-
Mexico
Europe
-
Eastern Europe
-
Poland
-
Romania
-
Hungary
-
Turkey
-
Rest of Eastern Europe
-
-
Western Europe
-
Germany
-
France
-
UK
-
Italy
-
Spain
-
Netherlands
-
Switzerland
-
Austria
-
Rest of Western Europe
-
Asia Pacific
-
China
-
India
-
Japan
-
South Korea
-
Vietnam
-
Singapore
-
Australia
-
Rest of Asia Pacific
Middle East & Africa
-
Middle East
-
UAE
-
Egypt
-
Saudi Arabia
-
Qatar
-
Rest of Middle East
-
-
Africa
-
Nigeria
-
South Africa
-
Rest of Africa
-
Latin America
-
Brazil
-
Argentina
-
Colombia
-
Rest of Latin America
Key Players
Some major key players in the Linerless Labels market are Coveris, Avery Dennison Corporation, Hub Labels, 3M Company, General Data Company Inc, Cenveo Corporation, Reflex Labels, Constantia Flexibles Group GmbH, CCL Industries Inc, Gipako and other players.
Avery Dennison Corporation-Company Financial Analysis
RECENT DEVELOPMENT
-
In August 2023, Elkem SILCOLEAS UV POLY 126, a new, ready to use, UV acrylate formulation specifically designed for the application of self-rolling thermal labels without the use of a separate primer, has been launched. This has also ensured that the required level of efficiency in manufacturing, cutting, converting and printing process is attained with a view to developing a durable thermal label system which can create a circular economy.
-
In September 2022, Packaging materials and labelling The Avery Dennison has launched a Linerless Direct Thermal Information Label Platform for different label formats used in e.g. Internet shopping, delivery and pick up, quick service restaurant, weighing of shipments and logistics applications.
| Report Attributes | Details |
| Market Size in 2023 | US$ 1.95 Bn |
| Market Size by 2031 | US$ 2.87 Bn |
| CAGR | CAGR of 4.95 % From 2024 to 2031 |
| Base Year | 2023 |
| Forecast Period | 2024-2031 |
| Historical Data | 2020-2022 |
| Report Scope & Coverage | Market Size, Segments Analysis, Competitive Landscape, Regional Analysis, DROC & SWOT Analysis, Forecast Outlook |
| Key Segments | • by Composition (Adhesive, Facestock, Topcoat) • by Product (Variable Imaged, Primary) • by Printing Ink (UV Curable, Water-Based, Solvent-Based, Others) • by Adhesion (Removable, Permanent, Repositionable) • by Printing Technology (Digital, Letterpress, Flexographic, Offset, Others) • by End Use (Food & Beverages, Pharmaceuticals, Retail, Logistics, Others) |
| Regional Analysis/Coverage | North America (US, Canada, Mexico), Europe (Eastern Europe [Poland, Romania, Hungary, Turkey, Rest of Eastern Europe] Western Europe] Germany, France, UK, Italy, Spain, Netherlands, Switzerland, Austria, Rest of Western Europe]), Asia Pacific (China, India, Japan, South Korea, Vietnam, Singapore, Australia, Rest of Asia Pacific), Middle East & Africa (Middle East [UAE, Egypt, Saudi Arabia, Qatar, Rest of Middle East], Africa [Nigeria, South Africa, Rest of Africa], Latin America (Brazil, Argentina, Colombia Rest of Latin America) |
| Company Profiles | Coveris, Avery Dennison Corporation, Hub Labels, 3M Company, General Data Company Inc, Cenveo Corporation, Reflex Labels, Constantia Flexibles Group GmbH, CCL Industries Inc, Gipako |
| Key Drivers | • Growth in the retail and logistics industry • Rising demand for the packaged foods and beverages |
| Key Restraints | • The market for linersless labels may be hampered by stringent government regulations |
Get in Touch
