In-Store Analytics Market Size & Overview
Get more information on In-Store Analytics Market - Request Free Sample Report
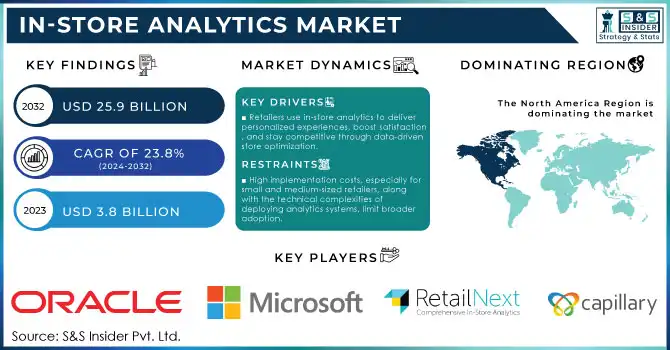
The In-Store Analytics Market Size was valued at USD 3.8 billion in 2023 and is expected to reach USD 25.9 billion by 2032, growing at a CAGR of 23.8% over the forecast period of 2024-2032.
The increasing penetration of advanced technologies as well as the technological initiatives taken by the government to promote modernization in the retail sector are propelling the in-store analytics market growth. According to the U.S. Department of Commerce, retail sales in 2023 showed a 7% year-over-year increase, underscoring the resilience and growth potential of brick-and-mortar establishments in an increasingly digital world. Furthermore, according to a survey by Google, 80% of shoppers like to visit physical shops to collect their orders as soon as possible, showing that physical retail stores still have their place in this economy. Global governments are investing in digital infrastructure and providing subsidies to adopt data-driven practices in the retail domain for improved operational efficiencies. An example includes AI-driven analytics tools used in stores to gain insights into consumer movement in the store as well as consumer buying patterns, helping retailers determine solutions regarding inventory and staffing. This not only reduces operational costs but also provides personalized experiences for shoppers, ultimately driving higher customer satisfaction and loyalty.
In-store analytics technologies provide immediate insights into customer behaviour, including product interactions and navigation patterns within stores. Harnessing such insights, using machine learning and algorithms on advanced platforms, drive major process revisions, including where to stock items within a store, how to plan item inventory, and how to tailor marketing plans. These tools can help you improve the efficiency of operations and enable a customized shopping experience, thus increasing customer satisfaction and loyalty. The proliferation in the market is propelled by the need to deliver customized customer experiences and integrated online and offline channels. Retailers leverage these insights for targeted offers and services, leading to higher customer engagement and conversions. In-store analytics help in unifying strategies such as simplified click-and-collect services and personalized in-store engagement by merging data from different retail touch points. This comprehensive approach meets the expectations of tech-savvy consumers and gives retailers a competitive edge in the evolving retail landscape.
In-Store Analytics Market Dynamics
Drivers
-
Retailers are leveraging in-store analytics to provide personalized shopping experiences and improve customer satisfaction. This approach helps them stay competitive against e-commerce platforms by using data-driven insights to optimize store layouts and promotions.
-
The adoption of AI, machine learning, and blockchain enhances in-store analytics. These technologies enable real-time data management, predictive insights, and improved supply chain operations, fostering better decision-making and operational efficiency.
A key technological trend in the market is the use of advanced technologies such as artificial intelligence (AI), machine learning (ML), and blockchain, which is mainly fuelling the growth of the in-store analytics market. These technologies give retailers the ability to have real-time insights that can lead to personalized interaction with customers and smart functioning of operations. AI-driven applications, for instance, are leveraging customer behaviour data to anticipate preferences, fine-tune inventory, and improve the customer experience. Predictive analytics allow retailers to anticipate customer needs, reducing stockouts or overstock scenarios. A more recent survey showed that 73% of retailers who were using AI for their in-store operations saw better customer engagement.
Additionally, Internet of Things (IoT) devices are transforming the in-store experience. Smart sensors and cameras track foot traffic patterns, monitor shelf activity, and gather heat maps of customer movement within stores. For example, Walmart has implemented IoT and AI-enabled technologies in many of its stores to detect items that are low in stock levels and automatically restock certain items to minimize human errors and maximize operational efficiency. Blockchain also adds value by enhancing transparency and security in data handling. With integrated loyalty program functionality, customers can redeem and track rewards seamlessly, and retailers will gain secure insight into transactional data that will help them understand who their customers are. Such innovations not only simplify store management but also help brick-and-mortar retailers position themselves more strongly against data-driven e-commerce platforms. These integrations are transforming traditional retail into agile, consumer-centric environments.
Restraints
-
High implementation costs, especially for small and medium-sized retailers, along with the technical complexities of deploying analytics systems, limit broader adoption.
-
A shortage of skilled professionals capable of analyzing and interpreting retail data effectively poses a significant challenge, hindering the ability to fully leverage in-store analytics solutions.
Implementation complexities as well as security concerns are the major restraints in the in-store analytics market. In-store analytics solution integrations typically demand considerable infrastructural alterations such as IoT devices, sensors, and cloud-based platform deployments. However, installations like these can be complex from a technical standpoint, requiring a lot of customization to accommodate different store layouts and operational processes. Furthermore, the handling of vast amounts of customer data raises serious security and privacy concerns. Strict regulations imposed by GDPR and other local data protection laws force retailers to comply with them which increases the operational burden. Data breaches also continue to be a key concern, since any breach could damage consumer trust and lead to fines. All these factors combined make in-store analytics a complicated and resource-demanding process for retailers, and many small-size merchants who do not have enough expertise and capital to overcome these challenges to adopt.
In-Store Analytics Market Segment Analysis
By Solution Type
The shopper traffic analysis segment held 27% of the total revenue of the global market in 2023 and has become an important tool for retailers looking to make the right decisions regarding store layout and resource allocation. The trend towards dominance here relates to how much we are reliant on data-driven insights to track movement and limit break in flow, tracking foot traffic, measure dwell times, and identify bottlenecks. According to a recent retail analytics survey, stores using real-time shopper traffic tools reported up to 12% enhanced conversion rates. This information allows retailers to make important changes, including rearranging the store layout to direct customers toward higher-margin goods, or staffing departments with more foot traffic to better serve customers. By making such adjustments, the measures are in sync with larger consumer behaviour trends that prioritize ease and frictionless shopping. Additionally, governments in developed economies, including the U.S. and the U.K., have introduced grants to support retail technology adoption, further propelling the growth of this segment.
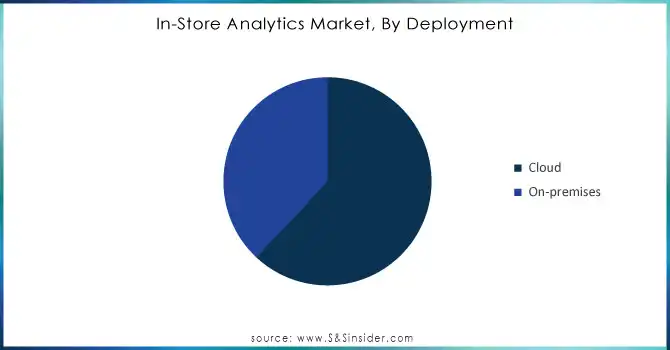
By Deployment
In 2023, the cloud segment led the market with the largest revenue share 61%, supported by the growing demand for flexibility, scalability, and the ability to integrate with various systems. Since most data activity in a retail environment tends to be quite dynamic, cloud-based retail solutions enable the retail stakeholders to gather, process, and analyze data are in real-time. The complex, ever-evolving system of tax incentives from the U.S. government to adopt the cloud as a mechanism for expediting digital transformation across sectors has certainly made this trend more pronounced. In addition, flexibility in the operation is another great benefit that cloud solutions give retailers increase their business scale without the need for heavy initial investment in IT infrastructure. This is especially attractive for small and medium-sized enterprises ready to deploy other analytics technologies. As per several industry reports, analytics in the cloud increases data accuracy by 25%, allowing for better decision-making. Cloud platforms also often come with advanced cyber security features for maximum protection of data which is a government-mandated requirement for retailers.
Need any customization research on In-Store Analytics Market - Enquiry Now
By Application
In 2023, the merchandising analysis represented the highest revenue-generating segment, as retailers have increasingly realized the need for maximizing product displays, inventory management, and consumer preference alignment. The U.S. Census Bureau reported a 15% increase in retail revenues for businesses implementing analytics-driven merchandising strategies. Utilizing AI and machine learning, these tools can predict demand trends, minimize stockouts, and maximize visibility for fast-moving products. For instance, promotional campaigns can be evaluated with merchandising analytics, which can be used to implement corresponding methodologies for inventory. Data-driven merchandising remains critical to staying ahead of the competition and is further emphasized by government-funded initiatives, namely grants giving money to AI research focused on retail. As a result, retailers adopting these technologies reported a 20% reduction in inventory costs and a 10% increase in sales efficiency, solidifying this segment’s market leadership.
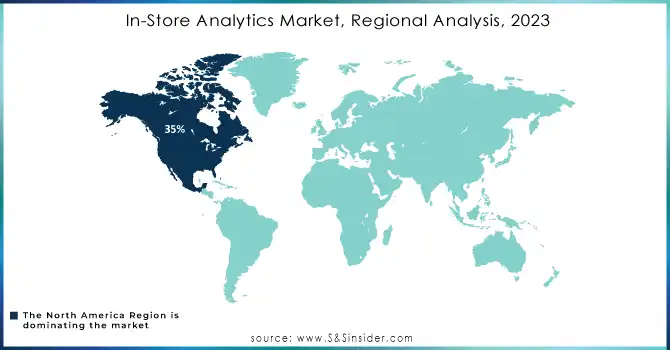
In-Store Analytics Market Regional Analysis
North America accounted for 35% of the global revenue in the in-store analytics market in 2023. This dominance derives from a well-established technological ecosystem, a mature retail environment, and a culture that is quick to adopt emerging technologies such as artificial intelligence (AI) and the Internet of Things (IoT). All over the U.S. retailers have adopted these technologies to interpret customer behaviour, manage inventory, and improve in-store experience. This innovation is buoyed by government policy, with initiatives in the form of tax credits and funding programs encouraging digital transformation in retail. As an example, federal efforts to kickstart AI and IoT research have spurred the development and implementation of in-store analytics solutions.
On the other hand, the Asia-Pacific region is the fastest-growing market due to urbanization, the increase in retail chains, and government incentives. The expansion is primarily driven by India's National Retail Policy, which has been instrumental towards the modernization of the sector and digitalization. In-store analytics is playing a crucial role in bridging the gap between traditional and modern retail operations. Southeast Asian governments are also fostering the adoption of smart technologies through grants and partnerships, making the region a hub of innovation. The growing consumer demand for predominantly installed devices and improved policies coupled with technological advancements positions Asia-Pacific as the most dynamic growth region for in-store analytics.
Recent Developments in the In-Store Analytics Market
-
In January 2024, Microsoft launched new retail solutions, including a new retail solution in Microsoft Fabric and Azure OpenAI Service templates. Designed to advance personalized shopping experiences and in-store operations, these features are powered by enhanced Microsoft Dynamics 365 Customer Insights. They tackle issues like employee churn and changing shopping preferences.
-
In March 2024, Honeywell partnered with Tompkins Robotics to bring flexible automation to distribution and fulfillment. The partnership unites Tompkins Autonomous Mobile Robots (AMRs) with Honeywell’s software capabilities It leads to modular solutions, which make businesses faster, more efficient, and help them scale better.
Key Players
Key Service Providers
-
RetailNext Inc. (RetailNext Platform, ShopperTrak)
-
Microsoft Corporation (Azure Synapse Analytics, Power BI)
-
Oracle Corporation (Oracle Retail Analytics, Oracle BI)
-
SAP SE (SAP Analytics Cloud, SAP HANA)
-
IBM Corporation (IBM Cognos Analytics, Watson AI)
-
Happiest Minds Technologies (Smart Retail Solutions, Customer Analytics Services)
-
Capillary Technologies (InTouch CRM+, VisitorMetrix)
-
Scanalytics Inc. (Floor Sensor Systems, Foot Traffic Analytics)
-
Thinkin (Smart Shelf, Analytics Dashboard)
-
Stratacache (Walkbase Analytics, ActiVia Video Analytics)
Key Users
-
Walmart
-
Amazon (Physical Stores)
-
Nike
-
Starbucks
-
Target
-
The Home Depot
-
Costco Wholesale
-
Best Buy
-
Kroger Co.
-
IKEA
| Report Attributes | Details |
|---|---|
| Market Size in 2023 | US$ 3.8 billion |
| Market Size by 2032 | US$ 25.9 billion |
| CAGR | CAGR of 23.8% from 2024 to 2032 |
| Base Year | 2023 |
| Forecast Period | 2024-2032 |
| Historical Data | 2020-2022 |
| Report Scope & Coverage | Market Size, Segments Analysis, Competitive Landscape, Regional Analysis, DROC & SWOT Analysis, Forecast Outlook |
| Key Segments | • By Solution Type (Shopper Traffic Analysis, Queue Management, Planogram Compliance, Inventory Management, In-Store Navigation) • By Organization Size (SMEs, Large Enterprises) • By Applications (Customer Management, Marketing Management, Merchandising Analysis, Store Operations Management, Risk and Compliance Management, Others) • By Deployment (On-premises, Cloud) |
| Regional Analysis/Coverage | North America (US, Canada, Mexico), Europe (Eastern Europe [Poland, Romania, Hungary, Turkey, Rest of Eastern Europe] Western Europe] Germany, France, UK, Italy, Spain, Netherlands, Switzerland, Austria, Rest of Western Europe]), Asia Pacific (China, India, Japan, South Korea, Vietnam, Singapore, Australia, Rest of Asia Pacific), Middle East & Africa (Middle East [UAE, Egypt, Saudi Arabia, Qatar, Rest of Middle East], Africa [Nigeria, South Africa, Rest of Africa], Latin America (Brazil, Argentina, Colombia, Rest of Latin America) |
| Company Profiles | RetailNext Inc., Microsoft Corporation, Oracle Corporation, SAP SE, IBM Corporation, Happiest Minds Technologies, Capillary Technologies, Scanalytics Inc., Thinkin, Stratacache |
| Key Drivers | • Retailers are leveraging in-store analytics to provide personalized shopping experiences and improve customer satisfaction. This approach helps them stay competitive against e-commerce platforms by using data-driven insights to optimize store layouts and promotions. • The adoption of AI, machine learning, and blockchain enhances in-store analytics. These technologies enable real-time data management, predictive insights, and improved supply chain operations, fostering better decision-making and operational efficiency. |
| Restraints | • High implementation costs, especially for small and medium-sized retailers, along with the technical complexities of deploying analytics systems, limit broader adoption. • A shortage of skilled professionals capable of analyzing and interpreting retail data effectively poses a significant challenge, hindering the ability to fully leverage in-store analytics solutions. |
Get in Touch
