To Get More Information on Intellectual Property Management Software Market - Request Sample Report
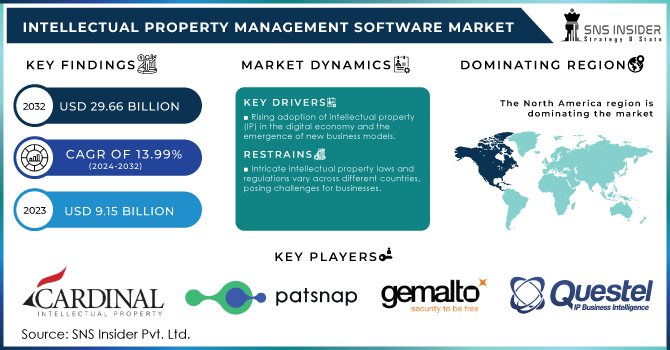
The Intellectual Property Management Software Market size was valued at USD 9.15 billion in 2023 and is expected to reach USD 29.66 billion in 2032 with a growing CAGR of 13.99% from 2024 to 2032.
The intellectual property management software market is growing significantly due to the increasing awareness about need to protect companies' intellectual property while developing and raising their investment in research and development in the market. Consequently, higher investment leads to an increased volume of IP in the market, which demands better and more sophisticated software that could solve the problem as the old one does not scale. Moreover, the business has gotten more global, and therefore the expansion of the already complicated intellectual property challenge across various jurisdictions has become more and more a must-have for businesses. In addition, as intellectual ownership becomes more and more the only way to sustain itself properly, companies will have to implement a well-documented and correctly developed system that will evolve within the company as required.
On the other hand, the government has begun to make it obligatory to follow strict regulatory compliance rules, and the requirement of risk management and lowered litigation costs will drive companies towards the software to escape any possible legal problems. Furthermore, the $140 million, that The White House has invested in AI, gives companies clear incentives to buy the software, especially with the contracts, as the IP rights of the provider will be explicitly written in the hundreds of contracts. This, in combination with AI and automation possible through it, will allow companies to make fewer mistakes in allocating patents and trademarks and in tracking the company IP. It will, in turn, allow software developers to provide more efficient software while being easier to use. The second driver is the increase in mergers and acquisitions in IT companies, which allows some big IT companies to acquire the IP of other companies. As a consequence, the IP of such companies becomes more complicated, and the software is required to integrate them smoothly into their IT portfolio. In addition, to monetizing their large IT assets, companies will look more to monetize their smaller IPs, which will require them to properly manage a system of copyright licenses, and other sources of income from the IPs. For example, on Feb 2, 2024, MaxVal Group struck a strategic partnership with the AI-driven patent analytics developer Relecura. In this partnership, Relecura will also sell its data to MaxVal, which will also have an opportunity to integrate it into MaxVal’s Symphony, the flagship IP management platform.
Market Dynamics
Drivers
Growing focus on managing and safeguarding intellectual property.
Rising adoption of intellectual property (IP) in the digital economy and the emergence of new business models.
The growing use of intellectual property in the digital economy is driven by the rapid development of technology, e-commerce, and digital platforms. As per the research, in 2023, world e-commerce sales became $5.5 trillion, and digital platforms continue to take an increasing share of the global economy. The increased use of online resources by a larger number of businesses has made it more critical to protect digital assets, such as software, trademarks, and intellectual property rights to proprietary algorithms. Therefore, with this situation, the use of intellectual property has grown, and digital patents and trademarks have gained a new dimension. More specifically, the fact that in 2023, the number of software patents registered in the world amounted to 8%. However, the growing use of intellectual property is connected not only with the increasing number of online businesses.
Another reason is the emergence of new business models, primarily those that are based on digital technologies, such as artificial intelligence, blockchain, and the Internet of Things. These technologies enable businesses to develop new products and services, and as a result, the number of intellectual property assets grows. In turn, companies should register more patents and trademarks to protect these assets and preserve their competitive advantage in the market. More specifically, the fact that between 2020 and 2022, 1,90,000 AI patents were registered. Altogether, the growing number of digital assets results in the growing complexity of managing patents and trademarks, which is facilitated with such tools as advanced IP management software.
Restrains
Intricate intellectual property laws and regulations vary across different countries, posing challenges for businesses.
The high costs and complexity associated with IP systems
Considering that IP laws and regulations can significantly differ from one country to another, this aspect can be seen as one of the main legal considerations. In the United States, IP law is regulated by a number of federal statutes such as the Copyright Act, Patent Act, and the Lanham Act. The U.S. system of IP legislation is built upon providing strong protection. On the one hand, it is an encouraging approach that supports innovative activities and ensures creators are protected; on the other hand, this strong protection entails a necessary understanding of these laws for businesses because they have to remain extra cautious and avoid any form of infringement or piracy. UK IP laws “are derived from multiple sources, including both domestic legislation and international agreements.” Some of the key statutes are the Copyright, Designs, and Patents Act 1988 and the Trade Marks Act 1994. In reality, U.K. laws are even more standardized and regulated within the context of the European Union. Thus, post-Brexit businesses should not expect less protection and a more liberal approach. What this all means is that Intellectual Property Management Software should be versatile, adapted to the specifics of various jurisdictions, and sufficiently advanced to manage cross-border IP. Businesses should also recognize this diversity and number of distinct requirements to ensure they remain compliant and their IP is protected globally to the best extent possible.
Opportunities
The shift towards digital business models generates new forms of IP, requiring specialized management solutions.
By Type
By Type, patent intellectual property management held a significant revenue share of more than 32% in 2023. In the United Kingdom, there were 19,943 patent applications in 2023, which is an increase of about 2.4% from the previous year. However, this does not explain the 20.8% decrease in granted patents which also indicates the complexity of the task required to achieve patent protection. The increase in applications in the UK is seen as a company’s rush to the UK Intellectual Property Office to secure their ideas before they are legally patented, or many are in the examination stage, and others have not been granted. The United States has equal experience with the patent landscape being active the same. The United States has been consistent in having the highest applications for patent globally. This data helps in explaining the share of the “patent management” in the IP management software market’s revenue. The substantial share of revenue attributed to patent management in the IP software market aligns with the increasing need for businesses to protect and manage their innovations effectively in a competitive global market.
By Deployment
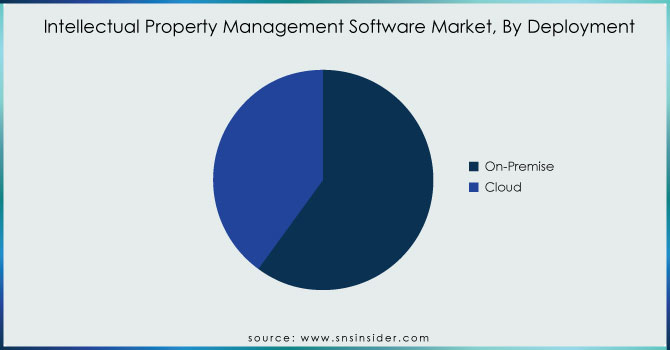
The on-premise segment dominated the intellectual property management software market by deployment with the highest revenue share of more than 52.3% in 2023. Companies’ need for improved control over highly valuable intellectual property data has enabled this trend. In addition to that, the pharmaceuticals, technology, and manufacturing industries are largely in need of on-premise deployment because of relatively strict industry compliance and security requirements. The extensive use of the on-premise deployment is also justified by the complex nature of IP data management, and smaller companies that have fewer features and their patents, trademarks, and innovations are still manageable by relatively simple cloud-based solutions that are no longer in existence. The relatively customizable on-premise solutions are required to gain the necessary control and full features of highly compartmentalized IP data, which has prompted the dominance of this deployment in 2023, despite the growing adoption of the cloud-based solution method.
Hence, the dominance of on-premise deployment was one of the most expected findings of the forecast, and the trend described above has been observed for a long time. Therefore, the necessity to adhere to the relevant industry regulations has been keeping the on-premise deployment in power. Furthermore, the challenges related to data breaches and an increasingly stringent level of data security measures also contribute to this trend.
Do You Need any Customization Research on Intellectual Property Management Software Market - Enquire Now
By End-Use Industry
For the end-use industry, the BFSI industry led the intellectual property management software market in 2023 with a revenue share of over 36.5%. The rapid pace of digital transformation, as well as the adoption of innovative technologies, are expected to drive this dominance. Notably, as banks and the finance industry shift to digital banking, providing a personalized experience and advanced analytics have necessitated the protection and management of their intellectual property such as proprietary algorithms as well as the fintech solution. Similarly, the sector’s increasing dependence on digital channels and AI to engage its customers through the most accurate, relevant, and valuable information requires management and protection software to ensure their intellectual property is secure. Moreover, besides the growing number of mobile applications, blockchain, and IoT deployments, the emergence of open banking in line with third-party implementations through APIs has bolstered the importance of management and protection. Perhaps most relevant is the BFSI's objective to generate customer insights by utilizing big data and AI, in addition to safeguarding its innovations against fraud and hacking. The significant investment in digital innovation and the growing complexity of managing these assets have positioned the BFSI sector as the largest market for IP management software in 2023.
Regional Analysis
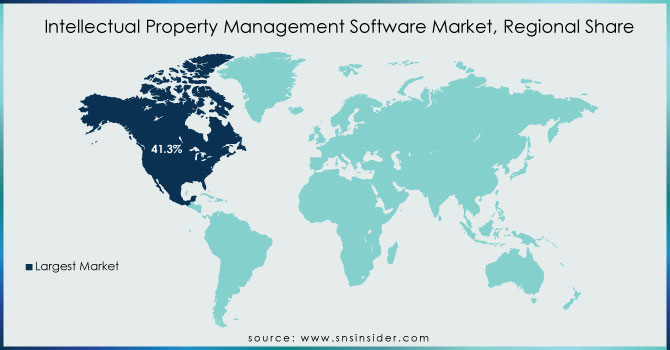
In 2023, North America led the intellectual property management software market, accounting for over 41.3% of the global revenue. In particular, the region’s dominance is associated with a high level of its IP activity – in the US, 418,262 patent applications were filed. It is worth noting that the figure is slightly higher than the parameter of 418,116 applications in 2022, reflecting consistent growth over the past few years. High volumes of patenting underline the urgent demand for effective IP management solutions due to the need for the firm to protect and commercialize its innovations in such a competitive industry. In addition, the growth of patent applications, which applies to such sectors as technology or pharmaceuticals, should also be noted. These firms develop a variety of innovations, and the business processes of many North American companies are based on the effective use of these assets.
Asia Pacific is expected to grow at the highest CAGR during the forecast period from 2024-2032. This growth is driven by the region's rapidly expanding IP activity, particularly in China. In 2023, China alone registered an impressive 4.383 million trademark applications, reflecting the country's strong emphasis on innovation and technological advancement. This surge in IP filings is creating a significant demand for robust IP management solutions to protect and manage these valuable assets effectively. Also, China continues to dominate global patent filings which increase the need for sophisticated IP management software, driving the market's expansion in the Asia Pacific region. The region's focus on innovation, coupled with increasing investments in R&D and the digital economy, positions it as a key growth area for IP management solutions. This expected growth aligns with the broader trend of Asia Pacific emerging as a global leader in innovation and IP protection.
The prominent players in the market are Cardinal Intellectual Property, Patsnap, Gemalto NV, Innovation Asset Group, Inc., Questel, Alt Legal, Inc., IP Checkups, Inc., TM Cloud, LexisNexis, Clarivate plc, Anaqua, Inc., patrix ab, Wellspring Worldwide., and others in the final report.
Clarivate Plc., a prominent global provider of transformative intelligence, unveiled the IP Collaboration Hub™ at the 2024 Clarivate Ignite conference in San Diego, U.S. in June 2024.
Questel, a world leader in intellectual property (IP) management solutions, is excited to announce its strategic partnership with the innovative Swiss-based company, ipQuants, in March 2024.
Clarivate Plc., a global leader in delivering trusted intelligence to individuals and organizations to drive global transformation, revealed in June 2023 that Mitsubishi Electric Corporation has selected IPfolio™ from Clarivate to streamline its intellectual property (IP) operations.
Wellspring, a leading provider of software solutions for R&D and Innovation Management, announced the acquisition of IP Pragmatics, one of the world's top consulting and services companies for Tech Transfer and Intellectual Property Management, in February 2023.
Anaqua, a premier provider of innovation and intellectual property management technology, disclosed in December 2022 that it is collaborating with innovation intelligence platform PatSnap.
Report Attributes | Details |
Market Size in 2023 | US$ 9.15 Billion |
Market Size by 2032 | US$ 29.66 Billion |
CAGR | CAGR of 13.99% From 2024 to 2032 |
Base Year | 2023 |
Forecast Period | 2024-2032 |
Historical Data | 2020-2022 |
Report Scope & Coverage | Market Size, Segments Analysis, Competitive Landscape, Regional Analysis, DROC & SWOT Analysis, Forecast Outlook |
Key Segments | • By Type(Patent Intellectual Property Management, Trademark Intellectual Property Management, Copyright Intellectual Property Management, Design Intellectual Property Management, and Others) • By Component(Software and Service) • By Deployment(On-premises and Cloud) • By End-Use Industry (BFSI, Healthcare, Automotive, IT and Telecom, Research Institutes, and Others) |
Regional Analysis/Coverage | North America (US, Canada, Mexico), Europe (Eastern Europe [Poland, Romania, Hungary, Turkey, Rest of Eastern Europe] Western Europe] Germany, France, UK, Italy, Spain, Netherlands, Switzerland, Austria, Rest of Western Europe]), Asia Pacific (China, India, Japan, South Korea, Vietnam, Singapore, Australia, Rest of Asia Pacific), Middle East & Africa (Middle East [UAE, Egypt, Saudi Arabia, Qatar, Rest of Middle East], Africa [Nigeria, South Africa, Rest of Africa], Latin America (Brazil, Argentina, Colombia Rest of Latin America) |
Company Profiles | Cardinal Intellectual Property, Patsnap, Gemalto NV, Innovation Asset Group, Inc., Questel, Alt Legal, Inc., IP Checkups, Inc., TM Cloud, LexisNexis, Clarivate plc, Anaqua, Inc., patrix ab, Wellspring Worldwide. |
Key Drivers | • The intellectual property software is projected to experience significant growth in the coming years, driven by a growing focus on managing and safeguarding intellectual property. • Rising adoption of intellectual property (IP) in the digital economy and the emergence of new business models. |
Market Restraints | • The global intellectual property software market is expected to face challenges in its growth due to low awareness regarding IP systems. • The high costs and complexity associated with IP systems are also expected to impede the growth of the global intellectual property software market. |
Ans: The market is expected to grow to USD 16.60 billion by the forecast period of 2030.
Ans. The CAGR of the Intellectual Property Management Software Market for the forecast period 2022-2030 is 10.21%.
Ans: Yes, you can buy reports in bulk quantity as per your requirements. Check Here for more details.
Ans: The North America region dominate the Intellectual Property Management Software Market?
Ans:
1. Introduction
1.1 Market Definition
1.2 Scope (Inclusion and Exclusions)
1.3 Research Assumptions
2. Executive Summary
2.1 Market Overview
2.2 Regional Synopsis
2.3 Competitive Summary
3. Research Methodology
3.1 Top-Down Approach
3.2 Bottom-up Approach
3.3. Data Validation
3.4 Primary Interviews
4. Market Dynamics Impact Analysis
4.1 Market Driving Factors Analysis
4.1.1 Drivers
4.1.2 Restraints
4.1.3 Opportunities
4.1.4 Challenges
4.2 PESTLE Analysis
4.3 Porter’s Five Forces Model
5. Statistical Insights and Trends Reporting
5.1 Feature Analysis, 2023
5.2 User Demographics, 2023
5.3 Integration Capabilities, by Software, 2023
5.4 Impact on Decision-making
6. Competitive Landscape
6.1 List of Major Companies, By Region
6.2 Market Share Analysis, By Region
6.3 Product Benchmarking
6.3.1 Product specifications and features
6.3.2 Pricing
6.4 Strategic Initiatives
6.4.1 Marketing and promotional activities
6.4.2 Distribution and Supply Chain Strategies
6.4.3 Expansion plans and new product launches
6.4.4 Strategic partnerships and collaborations
6.5 Technological Advancements
6.6 Market Positioning and Branding
7. Intellectual Property Management Software Market Segmentation, by Type
7.1 Chapter Overview
7.2 Patent Intellectual Property Management
7.2.1 Patent Intellectual Property Management Market Trends Analysis (2020-2032)
7.2.2 Patent Intellectual Property Management Market Size Estimates and Forecasts to 2032 (USD Billion)
7.3 Trademark Intellectual Property Management
7.3.1 Trademark Intellectual Property Management Market Trends Analysis (2020-2032)
7.3.2 Trademark Intellectual Property Management Market Size Estimates and Forecasts to 2032 (USD Billion)
7.4 Copyright Intellectual Property Management
7.4.1 Copyright Intellectual Property Management Market Trends Analysis (2020-2032)
7.4.2 Copyright Intellectual Property Management Market Size Estimates and Forecasts to 2032 (USD Billion)
7.5 Design Intellectual Property Management
7.5.1 Design Intellectual Property Management Market Trends Analysis (2020-2032)
7.5.2 Design Intellectual Property Management Market Size Estimates and Forecasts to 2032 (USD Billion)
7.6 Others
7.6.1 Others Market Trends Analysis (2020-2032)
7.6.2 Others Market Size Estimates and Forecasts to 2032 (USD Billion)
8. Intellectual Property Management Software Market Segmentation, by Component
8.1 Chapter Overview
8.2 Software
8.2.1 Software Market Trends Analysis (2020-2032)
8.2.2 Software Market Size Estimates and Forecasts to 2032 (USD Billion)
8.3 Service
8.3.1 Service Market Trends Analysis (2020-2032)
8.3.2 Service Market Size Estimates and Forecasts to 2032 (USD Billion)
9. Intellectual Property Management Software Market Segmentation, by Deployment
9.1 Chapter Overview
9.2 On-premises
9.2.1 On-premises Market Trends Analysis (2020-2032)
9.2.2 On-premises Market Size Estimates and Forecasts to 2032 (USD Billion)
9.3 Cloud
9.3.1 Cloud Market Trends Analysis (2020-2032)
9.3.2 Cloud Market Size Estimates and Forecasts to 2032 (USD Billion)
10. Intellectual Property Management Software Market Segmentation, by End-Use Industry
10.1 Chapter Overview
10.2 BFSI
10.2.1 BFSI Market Trends Analysis (2020-2032)
10.2.2 BFSI Market Size Estimates and Forecasts to 2032 (USD Billion)
10.3 Healthcare
10.3.1 Healthcare Market Trends Analysis (2020-2032)
10.3.2 Healthcare Market Size Estimates and Forecasts to 2032 (USD Billion)
10.4 Automotive
10.4.1 Automotive Market Trends Analysis (2020-2032)
10.4.2 Automotive Market Size Estimates and Forecasts to 2032 (USD Billion)
10.5 IT and Telecom
10.5.1 IT and Telecom Market Trends Analysis (2020-2032)
10.5.2 IT and Telecom Market Size Estimates and Forecasts to 2032 (USD Billion)
10.6 Research Institutes
10.6.1 Research Institutes Market Trends Analysis (2020-2032)
10.6.2 Research Institutes Market Size Estimates and Forecasts to 2032 (USD Billion)
10.7 Others
10.7.1 Others Market Trends Analysis (2020-2032)
10.7.2 Others Market Size Estimates and Forecasts to 2032 (USD Billion)
11. Regional Analysis
11.1 Chapter Overview
11.2 North America
11.2.1 Trends Analysis
11.2.2 North America Intellectual Property Management Software Market Estimates and Forecasts, by Country (2020-2032) (USD Billion)
11.2.3 North America Intellectual Property Management Software Market Estimates and Forecasts, by Type (2020-2032) (USD Billion)
11.2.4 North America Intellectual Property Management Software Market Estimates and Forecasts, by Component (2020-2032) (USD Billion)
11.2.5 North America Intellectual Property Management Software Market Estimates and Forecasts, by Deployment (2020-2032) (USD Billion)
11.2.6 North America Intellectual Property Management Software Market Estimates and Forecasts, by End-Use Industry (2020-2032) (USD Billion)
11.2.7 USA
11.2.7.1 USA Intellectual Property Management Software Market Estimates and Forecasts, by Type (2020-2032) (USD Billion)
11.2.7.2 USA Intellectual Property Management Software Market Estimates and Forecasts, by Component (2020-2032) (USD Billion)
11.2.7.3 USA Intellectual Property Management Software Market Estimates and Forecasts, by Deployment (2020-2032) (USD Billion)
11.2.7.4 USA Intellectual Property Management Software Market Estimates and Forecasts, by End-Use Industry (2020-2032) (USD Billion)
11.2.8 Canada
11.2.8.1 Canada Intellectual Property Management Software Market Estimates and Forecasts, by Type (2020-2032) (USD Billion)
11.2.8.2 Canada Intellectual Property Management Software Market Estimates and Forecasts, by Component (2020-2032) (USD Billion)
11.2.8.3 Canada Intellectual Property Management Software Market Estimates and Forecasts, by Deployment (2020-2032) (USD Billion)
11.2.8.4 Canada Intellectual Property Management Software Market Estimates and Forecasts, by End-Use Industry (2020-2032) (USD Billion)
11.2.9 Mexico
11.2.9.1 Mexico Intellectual Property Management Software Market Estimates and Forecasts, by Type (2020-2032) (USD Billion)
11.2.9.2 Mexico Intellectual Property Management Software Market Estimates and Forecasts, by Component (2020-2032) (USD Billion)
11.2.9.3 Mexico Intellectual Property Management Software Market Estimates and Forecasts, by Deployment (2020-2032) (USD Billion)
11.2.9.4 Mexico Intellectual Property Management Software Market Estimates and Forecasts, by End-Use Industry (2020-2032) (USD Billion)
11.3 Europe
11.3.1 Eastern Europe
11.3.1.1 Trends Analysis
11.3.1.2 Eastern Europe Intellectual Property Management Software Market Estimates and Forecasts, by Country (2020-2032) (USD Billion)
11.3.1.3 Eastern Europe Intellectual Property Management Software Market Estimates and Forecasts, by Type (2020-2032) (USD Billion)
11.3.1.4 Eastern Europe Intellectual Property Management Software Market Estimates and Forecasts, by Component (2020-2032) (USD Billion)
11.3.1.5 Eastern Europe Intellectual Property Management Software Market Estimates and Forecasts, by Deployment (2020-2032) (USD Billion)
11.3.1.6 Eastern Europe Intellectual Property Management Software Market Estimates and Forecasts, by End-Use Industry (2020-2032) (USD Billion)
11.3.1.7 Poland
11.3.1.7.1 Poland Intellectual Property Management Software Market Estimates and Forecasts, by Type (2020-2032) (USD Billion)
11.3.1.7.2 Poland Intellectual Property Management Software Market Estimates and Forecasts, by Component (2020-2032) (USD Billion)
11.3.1.7.3 Poland Intellectual Property Management Software Market Estimates and Forecasts, by Deployment (2020-2032) (USD Billion)
11.3.1.7.4 Poland Intellectual Property Management Software Market Estimates and Forecasts, by End-Use Industry (2020-2032) (USD Billion)
11.3.1.8 Romania
11.3.1.8.1 Romania Intellectual Property Management Software Market Estimates and Forecasts, by Type (2020-2032) (USD Billion)
11.3.1.8.2 Romania Intellectual Property Management Software Market Estimates and Forecasts, by Component (2020-2032) (USD Billion)
11.3.1.8.3 Romania Intellectual Property Management Software Market Estimates and Forecasts, by Deployment (2020-2032) (USD Billion)
11.3.1.8.4 Romania Intellectual Property Management Software Market Estimates and Forecasts, by End-Use Industry (2020-2032) (USD Billion)
11.3.1.9 Hungary
11.3.1.9.1 Hungary Intellectual Property Management Software Market Estimates and Forecasts, by Type (2020-2032) (USD Billion)
11.3.1.9.2 Hungary Intellectual Property Management Software Market Estimates and Forecasts, by Component (2020-2032) (USD Billion)
11.3.1.9.3 Hungary Intellectual Property Management Software Market Estimates and Forecasts, by Deployment (2020-2032) (USD Billion)
11.3.1.9.4 Hungary Intellectual Property Management Software Market Estimates and Forecasts, by End-Use Industry (2020-2032) (USD Billion)
11.3.1.10 Turkey
11.3.1.10.1 Turkey Intellectual Property Management Software Market Estimates and Forecasts, by Type (2020-2032) (USD Billion)
11.3.1.10.2 Turkey Intellectual Property Management Software Market Estimates and Forecasts, by Component (2020-2032) (USD Billion)
11.3.1.10.3 Turkey Intellectual Property Management Software Market Estimates and Forecasts, by Deployment (2020-2032) (USD Billion)
11.3.1.10.4 Turkey Intellectual Property Management Software Market Estimates and Forecasts, by End-Use Industry (2020-2032) (USD Billion)
11.3.1.11 Rest of Eastern Europe
11.3.1.11.1 Rest of Eastern Europe Intellectual Property Management Software Market Estimates and Forecasts, by Type (2020-2032) (USD Billion)
11.3.1.11.2 Rest of Eastern Europe Intellectual Property Management Software Market Estimates and Forecasts, by Component (2020-2032) (USD Billion)
11.3.1.11.3 Rest of Eastern Europe Intellectual Property Management Software Market Estimates and Forecasts, by Deployment (2020-2032) (USD Billion)
11.3.1.11.4 Rest of Eastern Europe Intellectual Property Management Software Market Estimates and Forecasts, by End-Use Industry (2020-2032) (USD Billion)
11.3.2 Western Europe
11.3.2.1 Trends Analysis
11.3.2.2 Western Europe Intellectual Property Management Software Market Estimates and Forecasts, by Country (2020-2032) (USD Billion)
11.3.2.3 Western Europe Intellectual Property Management Software Market Estimates and Forecasts, by Type (2020-2032) (USD Billion)
11.3.2.4 Western Europe Intellectual Property Management Software Market Estimates and Forecasts, by Component (2020-2032) (USD Billion)
11.3.2.5 Western Europe Intellectual Property Management Software Market Estimates and Forecasts, by Deployment (2020-2032) (USD Billion)
11.3.2.6 Western Europe Intellectual Property Management Software Market Estimates and Forecasts, by End-Use Industry (2020-2032) (USD Billion)
11.3.2.7 Germany
11.3.2.7.1 Germany Intellectual Property Management Software Market Estimates and Forecasts, by Type (2020-2032) (USD Billion)
11.3.2.7.2 Germany Intellectual Property Management Software Market Estimates and Forecasts, by Component (2020-2032) (USD Billion)
11.3.2.7.3 Germany Intellectual Property Management Software Market Estimates and Forecasts, by Deployment (2020-2032) (USD Billion)
11.3.2.7.4 Germany Intellectual Property Management Software Market Estimates and Forecasts, by End-Use Industry (2020-2032) (USD Billion)
11.3.2.8 France
11.3.2.8.1 France Intellectual Property Management Software Market Estimates and Forecasts, by Type (2020-2032) (USD Billion)
11.3.2.8.2 France Intellectual Property Management Software Market Estimates and Forecasts, by Component (2020-2032) (USD Billion)
11.3.2.8.3 France Intellectual Property Management Software Market Estimates and Forecasts, by Deployment (2020-2032) (USD Billion)
11.3.2.8.4 France Intellectual Property Management Software Market Estimates and Forecasts, by End-Use Industry (2020-2032) (USD Billion)
11.3.2.9 UK
11.3.2.9.1 UK Intellectual Property Management Software Market Estimates and Forecasts, by Type (2020-2032) (USD Billion)
11.3.2.9.2 UK Intellectual Property Management Software Market Estimates and Forecasts, by Component (2020-2032) (USD Billion)
11.3.2.9.3 UK Intellectual Property Management Software Market Estimates and Forecasts, by Deployment (2020-2032) (USD Billion)
11.3.2.9.4 UK Intellectual Property Management Software Market Estimates and Forecasts, by End-Use Industry (2020-2032) (USD Billion)
11.3.2.10 Italy
11.3.2.10.1 Italy Intellectual Property Management Software Market Estimates and Forecasts, by Type (2020-2032) (USD Billion)
11.3.2.10.2 Italy Intellectual Property Management Software Market Estimates and Forecasts, by Component (2020-2032) (USD Billion)
11.3.2.10.3 Italy Intellectual Property Management Software Market Estimates and Forecasts, by Deployment (2020-2032) (USD Billion)
11.3.2.10.4 Italy Intellectual Property Management Software Market Estimates and Forecasts, by End-Use Industry (2020-2032) (USD Billion)
11.3.2.11 Spain
11.3.2.11.1 Spain Intellectual Property Management Software Market Estimates and Forecasts, by Type (2020-2032) (USD Billion)
11.3.2.11.2 Spain Intellectual Property Management Software Market Estimates and Forecasts, by Component (2020-2032) (USD Billion)
11.3.2.11.3 Spain Intellectual Property Management Software Market Estimates and Forecasts, by Deployment (2020-2032) (USD Billion)
11.3.2.11.4 Spain Intellectual Property Management Software Market Estimates and Forecasts, by End-Use Industry (2020-2032) (USD Billion)
11.3.2.12 Netherlands
11.3.2.12.1 Netherlands Intellectual Property Management Software Market Estimates and Forecasts, by Type (2020-2032) (USD Billion)
11.3.2.12.2 Netherlands Intellectual Property Management Software Market Estimates and Forecasts, by Component (2020-2032) (USD Billion)
11.3.2.12.3 Netherlands Intellectual Property Management Software Market Estimates and Forecasts, by Deployment (2020-2032) (USD Billion)
11.3.2.12.4 Netherlands Intellectual Property Management Software Market Estimates and Forecasts, by End-Use Industry (2020-2032) (USD Billion)
11.3.2.13 Switzerland
11.3.2.13.1 Switzerland Intellectual Property Management Software Market Estimates and Forecasts, by Type (2020-2032) (USD Billion)
11.3.2.13.2 Switzerland Intellectual Property Management Software Market Estimates and Forecasts, by Component (2020-2032) (USD Billion)
11.3.2.13.3 Switzerland Intellectual Property Management Software Market Estimates and Forecasts, by Deployment (2020-2032) (USD Billion)
11.3.2.13.4 Switzerland Intellectual Property Management Software Market Estimates and Forecasts, by End-Use Industry (2020-2032) (USD Billion)
11.3.2.14 Austria
11.3.2.14.1 Austria Intellectual Property Management Software Market Estimates and Forecasts, by Type (2020-2032) (USD Billion)
11.3.2.14.2 Austria Intellectual Property Management Software Market Estimates and Forecasts, by Component (2020-2032) (USD Billion)
11.3.2.14.3 Austria Intellectual Property Management Software Market Estimates and Forecasts, by Deployment (2020-2032) (USD Billion)
11.3.2.14.4 Austria Intellectual Property Management Software Market Estimates and Forecasts, by End-Use Industry (2020-2032) (USD Billion)
11.3.2.15 Rest of Western Europe
11.3.2.15.1 Rest of Western Europe Intellectual Property Management Software Market Estimates and Forecasts, by Type (2020-2032) (USD Billion)
11.3.2.15.2 Rest of Western Europe Intellectual Property Management Software Market Estimates and Forecasts, by Component (2020-2032) (USD Billion)
11.3.2.15.3 Rest of Western Europe Intellectual Property Management Software Market Estimates and Forecasts, by Deployment (2020-2032) (USD Billion)
11.3.2.15.4 Rest of Western Europe Intellectual Property Management Software Market Estimates and Forecasts, by End-Use Industry (2020-2032) (USD Billion)
11.4 Asia Pacific
11.4.1 Trends Analysis
11.4.2 Asia Pacific Intellectual Property Management Software Market Estimates and Forecasts, by Country (2020-2032) (USD Billion)
11.4.3 Asia Pacific Intellectual Property Management Software Market Estimates and Forecasts, by Type (2020-2032) (USD Billion)
11.4.4 Asia Pacific Intellectual Property Management Software Market Estimates and Forecasts, by Component (2020-2032) (USD Billion)
11.4.5 Asia Pacific Intellectual Property Management Software Market Estimates and Forecasts, by Deployment (2020-2032) (USD Billion)
11.4.6 Asia Pacific Intellectual Property Management Software Market Estimates and Forecasts, by End-Use Industry (2020-2032) (USD Billion)
11.4.7 China
11.4.7.1 China Intellectual Property Management Software Market Estimates and Forecasts, by Type (2020-2032) (USD Billion)
11.4.7.2 China Intellectual Property Management Software Market Estimates and Forecasts, by Component (2020-2032) (USD Billion)
11.4.7.3 China Intellectual Property Management Software Market Estimates and Forecasts, by Deployment (2020-2032) (USD Billion)
11.4.7.4 China Intellectual Property Management Software Market Estimates and Forecasts, by End-Use Industry (2020-2032) (USD Billion)
11.4.8 India
11.4.8.1 India Intellectual Property Management Software Market Estimates and Forecasts, by Type (2020-2032) (USD Billion)
11.4.8.2 India Intellectual Property Management Software Market Estimates and Forecasts, by Component (2020-2032) (USD Billion)
11.4.8.3 India Intellectual Property Management Software Market Estimates and Forecasts, by Deployment (2020-2032) (USD Billion)
11.4.8.4 India Intellectual Property Management Software Market Estimates and Forecasts, by End-Use Industry (2020-2032) (USD Billion)
11.4.9 Japan
11.4.9.1 Japan Intellectual Property Management Software Market Estimates and Forecasts, by Type (2020-2032) (USD Billion)
11.4.9.2 Japan Intellectual Property Management Software Market Estimates and Forecasts, by Component (2020-2032) (USD Billion)
11.4.9.3 Japan Intellectual Property Management Software Market Estimates and Forecasts, by Deployment (2020-2032) (USD Billion)
11.4.9.4 Japan Intellectual Property Management Software Market Estimates and Forecasts, by End-Use Industry (2020-2032) (USD Billion)
11.4.10 South Korea
11.4.10.1 South Korea Intellectual Property Management Software Market Estimates and Forecasts, by Type (2020-2032) (USD Billion)
11.4.10.2 South Korea Intellectual Property Management Software Market Estimates and Forecasts, by Component (2020-2032) (USD Billion)
11.4.10.3 South Korea Intellectual Property Management Software Market Estimates and Forecasts, by Deployment (2020-2032) (USD Billion)
11.4.10.4 South Korea Intellectual Property Management Software Market Estimates and Forecasts, by End-Use Industry (2020-2032) (USD Billion)
11.4.11 Vietnam
11.4.11.1 Vietnam Intellectual Property Management Software Market Estimates and Forecasts, by Type (2020-2032) (USD Billion)
11.4.11.2 Vietnam Intellectual Property Management Software Market Estimates and Forecasts, by Component (2020-2032) (USD Billion)
11.4.11.3 Vietnam Intellectual Property Management Software Market Estimates and Forecasts, by Deployment (2020-2032) (USD Billion)
11.4.11.4 Vietnam Intellectual Property Management Software Market Estimates and Forecasts, by End-Use Industry (2020-2032) (USD Billion)
11.4.12 Singapore
11.4.12.1 Singapore Intellectual Property Management Software Market Estimates and Forecasts, by Type (2020-2032) (USD Billion)
11.4.12.2 Singapore Intellectual Property Management Software Market Estimates and Forecasts, by Component (2020-2032) (USD Billion)
11.4.12.3 Singapore Intellectual Property Management Software Market Estimates and Forecasts, by Deployment (2020-2032) (USD Billion)
11.4.12.4 Singapore Intellectual Property Management Software Market Estimates and Forecasts, by End-Use Industry (2020-2032) (USD Billion)
11.4.13 Australia
11.4.13.1 Australia Intellectual Property Management Software Market Estimates and Forecasts, by Type (2020-2032) (USD Billion)
11.4.13.2 Australia Intellectual Property Management Software Market Estimates and Forecasts, by Component (2020-2032) (USD Billion)
11.4.13.3 Australia Intellectual Property Management Software Market Estimates and Forecasts, by Deployment (2020-2032) (USD Billion)
11.4.13.4 Australia Intellectual Property Management Software Market Estimates and Forecasts, by End-Use Industry (2020-2032) (USD Billion)
11.4.14 Rest of Asia Pacific
11.4.14.1 Rest of Asia Pacific Intellectual Property Management Software Market Estimates and Forecasts, by Type (2020-2032) (USD Billion)
11.4.14.2 Rest of Asia Pacific Intellectual Property Management Software Market Estimates and Forecasts, by Component (2020-2032) (USD Billion)
11.4.14.3 Rest of Asia Pacific Intellectual Property Management Software Market Estimates and Forecasts, by Deployment (2020-2032) (USD Billion)
11.4.14.4 Rest of Asia Pacific Intellectual Property Management Software Market Estimates and Forecasts, by End-Use Industry (2020-2032) (USD Billion)
11.5 Middle East and Africa
11.5.1 Middle East
11.5.1.1 Trends Analysis
11.5.1.2 Middle East Intellectual Property Management Software Market Estimates and Forecasts, by Country (2020-2032) (USD Billion)
11.5.1.3 Middle East Intellectual Property Management Software Market Estimates and Forecasts, by Type (2020-2032) (USD Billion)
11.5.1.4 Middle East Intellectual Property Management Software Market Estimates and Forecasts, by Component (2020-2032) (USD Billion)
11.5.1.5 Middle East Intellectual Property Management Software Market Estimates and Forecasts, by Deployment (2020-2032) (USD Billion)
11.5.1.6 Middle East Intellectual Property Management Software Market Estimates and Forecasts, by End-Use Industry (2020-2032) (USD Billion)
11.5.1.7 UAE
11.5.1.7.1 UAE Intellectual Property Management Software Market Estimates and Forecasts, by Type (2020-2032) (USD Billion)
11.5.1.7.2 UAE Intellectual Property Management Software Market Estimates and Forecasts, by Component (2020-2032) (USD Billion)
11.5.1.7.3 UAE Intellectual Property Management Software Market Estimates and Forecasts, by Deployment (2020-2032) (USD Billion)
11.5.1.7.4 UAE Intellectual Property Management Software Market Estimates and Forecasts, by End-Use Industry (2020-2032) (USD Billion)
11.5.1.8 Egypt
11.5.1.8.1 Egypt Intellectual Property Management Software Market Estimates and Forecasts, by Type (2020-2032) (USD Billion)
11.5.1.8.2 Egypt Intellectual Property Management Software Market Estimates and Forecasts, by Component (2020-2032) (USD Billion)
11.5.1.8.3 Egypt Intellectual Property Management Software Market Estimates and Forecasts, by Deployment (2020-2032) (USD Billion)
11.5.1.8.4 Egypt Intellectual Property Management Software Market Estimates and Forecasts, by End-Use Industry (2020-2032) (USD Billion)
11.5.1.9 Saudi Arabia
11.5.1.9.1 Saudi Arabia Intellectual Property Management Software Market Estimates and Forecasts, by Type (2020-2032) (USD Billion)
11.5.1.9.2 Saudi Arabia Intellectual Property Management Software Market Estimates and Forecasts, by Component (2020-2032) (USD Billion)
11.5.1.9.3 Saudi Arabia Intellectual Property Management Software Market Estimates and Forecasts, by Deployment (2020-2032) (USD Billion)
11.5.1.9.4 Saudi Arabia Intellectual Property Management Software Market Estimates and Forecasts, by End-Use Industry (2020-2032) (USD Billion)
11.5.1.10 Qatar
11.5.1.10.1 Qatar Intellectual Property Management Software Market Estimates and Forecasts, by Type (2020-2032) (USD Billion)
11.5.1.10.2 Qatar Intellectual Property Management Software Market Estimates and Forecasts, by Component (2020-2032) (USD Billion)
11.5.1.10.3 Qatar Intellectual Property Management Software Market Estimates and Forecasts, by Deployment (2020-2032) (USD Billion)
11.5.1.10.4 Qatar Intellectual Property Management Software Market Estimates and Forecasts, by End-Use Industry (2020-2032) (USD Billion)
11.5.1.11 Rest of Middle East
11.5.1.11.1 Rest of Middle East Intellectual Property Management Software Market Estimates and Forecasts, by Type (2020-2032) (USD Billion)
11.5.1.11.2 Rest of Middle East Intellectual Property Management Software Market Estimates and Forecasts, by Component (2020-2032) (USD Billion)
11.5.1.11.3 Rest of Middle East Intellectual Property Management Software Market Estimates and Forecasts, by Deployment (2020-2032) (USD Billion)
11.5.1.11.4 Rest of Middle East Intellectual Property Management Software Market Estimates and Forecasts, by End-Use Industry (2020-2032) (USD Billion)
11.5.2 Africa
11.5.2.1 Trends Analysis
11.5.2.2 Africa Intellectual Property Management Software Market Estimates and Forecasts, by Country (2020-2032) (USD Billion)
11.5.2.3 Africa Intellectual Property Management Software Market Estimates and Forecasts, by Type (2020-2032) (USD Billion)
11.5.2.4 Africa Intellectual Property Management Software Market Estimates and Forecasts, by Component (2020-2032) (USD Billion)
11.5.2.5 Africa Intellectual Property Management Software Market Estimates and Forecasts, by Deployment (2020-2032) (USD Billion)
11.5.2.6 Africa Intellectual Property Management Software Market Estimates and Forecasts, by End-Use Industry (2020-2032) (USD Billion)
11.5.2.7 South Africa
11.5.2.7.1 South Africa Intellectual Property Management Software Market Estimates and Forecasts, by Type (2020-2032) (USD Billion)
11.5.2.7.2 South Africa Intellectual Property Management Software Market Estimates and Forecasts, by Component (2020-2032) (USD Billion)
11.5.2.7.3 South Africa Intellectual Property Management Software Market Estimates and Forecasts, by Deployment (2020-2032) (USD Billion)
11.5.2.7.4 South Africa Intellectual Property Management Software Market Estimates and Forecasts, by End-Use Industry (2020-2032) (USD Billion)
11.5.2.8 Nigeria
11.5.2.8.1 Nigeria Intellectual Property Management Software Market Estimates and Forecasts, by Type (2020-2032) (USD Billion)
11.5.2.8.2 Nigeria Intellectual Property Management Software Market Estimates and Forecasts, by Component (2020-2032) (USD Billion)
11.5.2.8.3 Nigeria Intellectual Property Management Software Market Estimates and Forecasts, by Deployment (2020-2032) (USD Billion)
11.5.2.8.4 Nigeria Intellectual Property Management Software Market Estimates and Forecasts, by End-Use Industry (2020-2032) (USD Billion)
11.5.2.9 Rest of Africa
11.5.2.9.1 Rest of Africa Intellectual Property Management Software Market Estimates and Forecasts, by Type (2020-2032) (USD Billion)
11.5.2.9.2 Rest of Africa Intellectual Property Management Software Market Estimates and Forecasts, by Component (2020-2032) (USD Billion)
11.5.2.9.3 Rest of Africa Intellectual Property Management Software Market Estimates and Forecasts, by Deployment (2020-2032) (USD Billion)
11.5.2.9.4 Rest of Africa Intellectual Property Management Software Market Estimates and Forecasts, by End-Use Industry (2020-2032) (USD Billion)
11.6 Latin America
11.6.1 Trends Analysis
11.6.2 Latin America Intellectual Property Management Software Market Estimates and Forecasts, by Country (2020-2032) (USD Billion)
11.6.3 Latin America Intellectual Property Management Software Market Estimates and Forecasts, by Type (2020-2032) (USD Billion)
11.6.4 Latin America Intellectual Property Management Software Market Estimates and Forecasts, by Component (2020-2032) (USD Billion)
11.6.5 Latin America Intellectual Property Management Software Market Estimates and Forecasts, by Deployment (2020-2032) (USD Billion)
11.6.6 Latin America Intellectual Property Management Software Market Estimates and Forecasts, by End-Use Industry (2020-2032) (USD Billion)
11.6.7 Brazil
11.6.7.1 Brazil Intellectual Property Management Software Market Estimates and Forecasts, by Type (2020-2032) (USD Billion)
11.6.7.2 Brazil Intellectual Property Management Software Market Estimates and Forecasts, by Component (2020-2032) (USD Billion)
11.6.7.3 Brazil Intellectual Property Management Software Market Estimates and Forecasts, by Deployment (2020-2032) (USD Billion)
11.6.7.4 Brazil Intellectual Property Management Software Market Estimates and Forecasts, by End-Use Industry (2020-2032) (USD Billion)
11.6.8 Argentina
11.6.8.1 Argentina Intellectual Property Management Software Market Estimates and Forecasts, by Type (2020-2032) (USD Billion)
11.6.8.2 Argentina Intellectual Property Management Software Market Estimates and Forecasts, by Component (2020-2032) (USD Billion)
11.6.8.3 Argentina Intellectual Property Management Software Market Estimates and Forecasts, by Deployment (2020-2032) (USD Billion)
11.6.8.4 Argentina Intellectual Property Management Software Market Estimates and Forecasts, by End-Use Industry (2020-2032) (USD Billion)
11.6.9 Colombia
11.6.9.1 Colombia Intellectual Property Management Software Market Estimates and Forecasts, by Type (2020-2032) (USD Billion)
11.6.9.2 Colombia Intellectual Property Management Software Market Estimates and Forecasts, by Component (2020-2032) (USD Billion)
11.6.9.3 Colombia Intellectual Property Management Software Market Estimates and Forecasts, by Deployment (2020-2032) (USD Billion)
11.6.9.4 Colombia Intellectual Property Management Software Market Estimates and Forecasts, by End-Use Industry (2020-2032) (USD Billion)
11.6.10 Rest of Latin America
11.6.10.1 Rest of Latin America Intellectual Property Management Software Market Estimates and Forecasts, by Type (2020-2032) (USD Billion)
11.6.10.2 Rest of Latin America Intellectual Property Management Software Market Estimates and Forecasts, by Component (2020-2032) (USD Billion)
11.6.10.3 Rest of Latin America Intellectual Property Management Software Market Estimates and Forecasts, by Deployment (2020-2032) (USD Billion)
11.6.10.4 Rest of Latin America Intellectual Property Management Software Market Estimates and Forecasts, by End-Use Industry (2020-2032) (USD Billion)
12. Company Profiles
12.1 Cardinal Intellectual Property
12.1.1 Company Overview
12.1.2 Financial
12.1.3 Products/ Services Offered
12.1.4 SWOT Analysis
12.2 Patsnap
12.2.1 Company Overview
12.2.2 Financial
12.2.3 Products/ Services Offered
12.2.4 SWOT Analysis
12.3 Gemalto NV
12.3.1 Company Overview
12.3.2 Financial
12.3.3 Products/ Services Offered
12.3.4 SWOT Analysis
12.4 Innovation Asset Group, Inc.
12.4.1 Company Overview
12.4.2 Financial
12.4.3 Products/ Services Offered
12.4.4 SWOT Analysis
12.5 Questel
12.5.1 Company Overview
12.5.2 Financial
12.5.3 Products/ Services Offered
12.5.4 SWOT Analysis
12.6 Alt Legal, Inc.
12.6.1 Company Overview
12.6.2 Financial
12.6.3 Products/ Services Offered
12.6.4 SWOT Analysis
12.7 IP Checkups, Inc.
12.7.1 Company Overview
12.7.2 Financial
12.7.3 Products/ Services Offered
12.7.4 SWOT Analysis
12.8 TM Cloud
12.8.1 Company Overview
12.8.2 Financial
12.8.3 Products/ Services Offered
12.8.4 SWOT Analysis
12.9 LexisNexis
12.9.1 Company Overview
12.9.2 Financial
12.9.3 Products/ Services Offered
12.9.4 SWOT Analysis
12.10 Clarivate plc
12.10.1 Company Overview
12.10.2 Financial
12.10.3 Products/ Services Offered
12.10.4 SWOT Analysis
13. Use Cases and Best Practices
14. Conclusio
An accurate research report requires proper strategizing as well as implementation. There are multiple factors involved in the completion of good and accurate research report and selecting the best methodology to compete the research is the toughest part. Since the research reports we provide play a crucial role in any company’s decision-making process, therefore we at SNS Insider always believe that we should choose the best method which gives us results closer to reality. This allows us to reach at a stage wherein we can provide our clients best and accurate investment to output ratio.
Each report that we prepare takes a timeframe of 350-400 business hours for production. Starting from the selection of titles through a couple of in-depth brain storming session to the final QC process before uploading our titles on our website we dedicate around 350 working hours. The titles are selected based on their current market cap and the foreseen CAGR and growth.
The 5 steps process:
Step 1: Secondary Research:
Secondary Research or Desk Research is as the name suggests is a research process wherein, we collect data through the readily available information. In this process we use various paid and unpaid databases which our team has access to and gather data through the same. This includes examining of listed companies’ annual reports, Journals, SEC filling etc. Apart from this our team has access to various associations across the globe across different industries. Lastly, we have exchange relationships with various university as well as individual libraries.
Step 2: Primary Research
When we talk about primary research, it is a type of study in which the researchers collect relevant data samples directly, rather than relying on previously collected data. This type of research is focused on gaining content specific facts that can be sued to solve specific problems. Since the collected data is fresh and first hand therefore it makes the study more accurate and genuine.
We at SNS Insider have divided Primary Research into 2 parts.
Part 1 wherein we interview the KOLs of major players as well as the upcoming ones across various geographic regions. This allows us to have their view over the market scenario and acts as an important tool to come closer to the accurate market numbers. As many as 45 paid and unpaid primary interviews are taken from both the demand and supply side of the industry to make sure we land at an accurate judgement and analysis of the market.
This step involves the triangulation of data wherein our team analyses the interview transcripts, online survey responses and observation of on filed participants. The below mentioned chart should give a better understanding of the part 1 of the primary interview.
Part 2: In this part of primary research the data collected via secondary research and the part 1 of the primary research is validated with the interviews from individual consultants and subject matter experts.
Consultants are those set of people who have at least 12 years of experience and expertise within the industry whereas Subject Matter Experts are those with at least 15 years of experience behind their back within the same space. The data with the help of two main processes i.e., FGDs (Focused Group Discussions) and IDs (Individual Discussions). This gives us a 3rd party nonbiased primary view of the market scenario making it a more dependable one while collation of the data pointers.
Step 3: Data Bank Validation
Once all the information is collected via primary and secondary sources, we run that information for data validation. At our intelligence centre our research heads track a lot of information related to the market which includes the quarterly reports, the daily stock prices, and other relevant information. Our data bank server gets updated every fortnight and that is how the information which we collected using our primary and secondary information is revalidated in real time.
Step 4: QA/QC Process
After all the data collection and validation our team does a final level of quality check and quality assurance to get rid of any unwanted or undesired mistakes. This might include but not limited to getting rid of the any typos, duplication of numbers or missing of any important information. The people involved in this process include technical content writers, research heads and graphics people. Once this process is completed the title gets uploader on our platform for our clients to read it.
Step 5: Final QC/QA Process:
This is the last process and comes when the client has ordered the study. In this process a final QA/QC is done before the study is emailed to the client. Since we believe in giving our clients a good experience of our research studies, therefore, to make sure that we do not lack at our end in any way humanly possible we do a final round of quality check and then dispatch the study to the client.
By Type
Patent Intellectual Property Management
Trademark Intellectual Property Management
Copyright Intellectual Property Management
Design Intellectual Property Management
Others
By Component
Software
Service
By Deployment
On-premises
Cloud
By End-Use Industry
BFSI
Healthcare
Automotive
IT and Telecom
Research Institutes
Others
Request for Segment Customization as per your Business Requirement: Segment Customization Request
REGIONAL COVERAGE:
North America
US
Canada
Mexico
Europe
Eastern Europe
Poland
Romania
Hungary
Turkey
Rest of Eastern Europe
Western Europe
Germany
France
UK
Italy
Spain
Netherlands
Switzerland
Austria
Rest of Western Europe
Asia Pacific
China
India
Japan
South Korea
Vietnam
Singapore
Australia
Rest of Asia Pacific
Middle East & Africa
Middle East
UAE
Egypt
Saudi Arabia
Qatar
Rest of the Middle East
Africa
Nigeria
South Africa
Rest of Africa
Latin America
Brazil
Argentina
Colombia
Request for Country Level Research Report: Country Level Customization Request
Available Customization
With the given market data, SNS Insider offers customization as per the company’s specific needs. The following customization options are available for the report:
Product Analysis
Criss-Cross segment analysis (e.g. Product X Application)
Product Matrix which gives a detailed comparison of product portfolio of each company
Geographic Analysis
Additional countries in any of the regions
Company Information
Detailed analysis and profiling of additional market players (Up to five)
The Decision Intelligence Market Size was valued at USD 13.20 Billion in 2023 and is expected to reach USD 90.15 Billion by 2032 and grow at a CAGR of 25.22% over the forecast period 2024-2032.
The Edge AI Software Market size was valued at USD 1.30 Billion in 2023 and is expected to reach USD 10.8 Billion by 2031 and grow at a CAGR of 30.3% over the forecast period 2024-2031.
The Geospatial Analytics Market size was valued at USD 71.89 billion in 2022 and is expected to grow to USD 186.43 billion by 2030 and grow at a CAGR of 12.65 % over the forecast period of 2023-2030.
3D Printing Market Size was valued at USD 21.1 billion in 2023 and is expected to reach USD 118.9 billion by 2032, growing at a CAGR of 21.2 % over the forecast period 2024-2032.
The Digital Education market size was valued at USD 19.0 Billion in 2023 and is expected to reach USD 180.23 Billion by 2032 and grow at a CAGR of 28.4% over the forecast period 2024-2032.
The 5G Chipset Market Size was valued at USD 39.8 Billion in 2023 and is expected to reach USD 204.59 Billion by 2032 and grow at a CAGR of 19.95% over the forecast period 2024-2032.
Hi! Click one of our member below to chat on Phone