Investment Casting Market Report Scope & Overview:

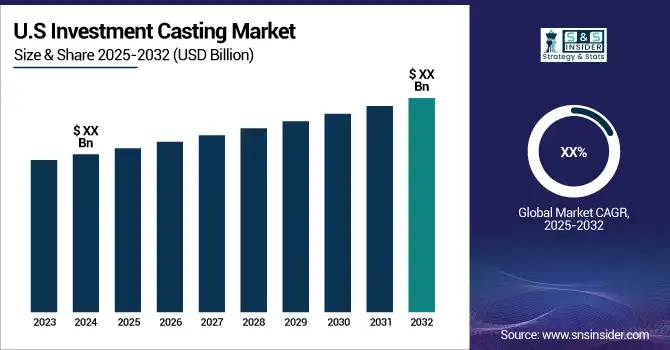
The Investment Casting Market Size was valued at USD 19.41 Billion in 2024 and is expected to reach USD 29.48 Billion by 2032, growing at a CAGR of 4.54% over the forecast period 2025-2032.

Investment casting market analysis offers several benefits, such as great surface finish and dimensional accuracy, which further eliminates the requirement for additional machining processes. This efficiency can substantially reduce manufacturing time and costs, which makes it a highly preferred solution for high-volume manufacturing. Although, the process does have limitations, and the primary tooling and mold investment can be significant, particularly for low-volume production runs. Further, several geometries, which require extreme complexity may not be suitable for this method. Nonetheless, advancements in technologies, such as 3D printing are addressing these challenges by enabling more complex designs and shortening lead times for pattern creation.
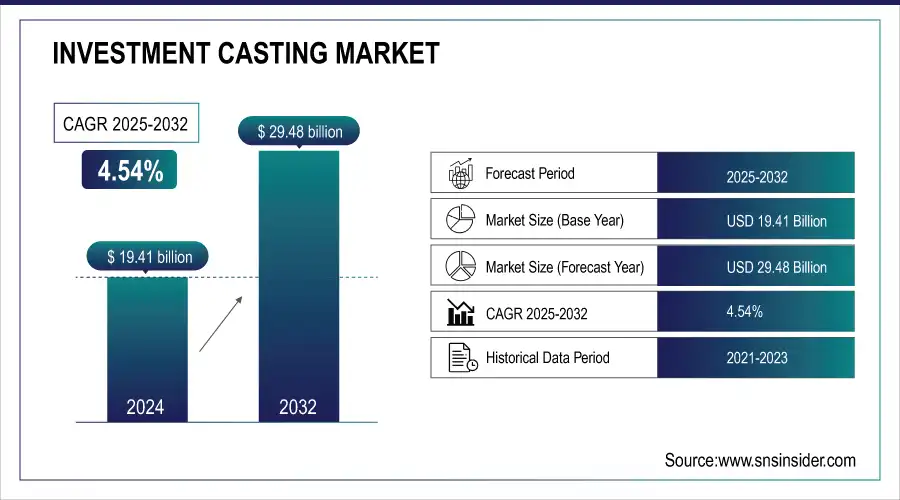
Investment Casting Market, Revenue Anaslysis

To Get More Information on Investment Casting Market - Request Sample Report

The process can achieve dimensional tolerances of up to ±0.005 inches, depending on the material and size of the component. In addition, investment casting can provide surface finish as smooth as Ra 125 microinches, which improves the aesthetic and functional characteristics of the manufactured pats. Furthermore, investment casting is environmentally friendly that boosts material usage rates as high as 98%, further highlighting its efficiency as compared to traditional casting methods. The investment casting is considered to be a reliable and efficient method for manufacturing precision metal components in the different industries.
Key Investment Casting Market Trends:
•    Automation and digital tools are enhancing precision and efficiency in casting processes.
•    Development of superalloys and advanced metals is expanding applications in aerospace and medical sectors.
•    Emerging economies in Asia-Pacific are witnessing rapid adoption of investment casting technologies.
•    Demand is rising across aerospace, defense, automotive, and energy sectors.
•    Eco-friendly processes and energy-efficient production methods are gaining prominence.

Investment Casting Market Growth Drivers:

  • Surging Need for Lightweight Materials in Industries Including Aerospace and Automotive is Boosting the Investment Casting Market

The surging lightweight materials' demand across different industries, especially automotive and aerospace, substantially propels the investment casting market growth. In different industries, the surging need for fuel efficiency, decrease emissions, and performance enhancement, has led producers seek materials that are strong and lightweight. Investment casting, known for its precision and ability to create complex geometries, is particularly well-suited for producing such components. This process allows manufacturers generation of complex shapes, in which traditional production methods often face issues to achieve, further enabling to design lightweight structures without compromising the durability and strength.

Furthermore, investment casting minimizes material waste, which is important for sustainability that is becoming highly important. With the help of investment casting, the producers can optimize material usage, further decreasing their environmental impact and costs. The leading industries are also incorporating advanced materials, such as aluminum and titanium alloys, which can be processed via investment casting in an effective way to manufacture lightweight parts. This approach meets particular requirements of industries, which demand high-performance components and aligns with trend of minimizing the overall vehicles and aircraft’s weight for improving fuel efficiency. As a result, investment casting has been a preferred choice for manufacturers looking to innovate and maintain competitiveness in a growing market, underscoring its important role in addressing the lightweight materials’ demand.

  • Technological Advancements in Casting Including Better Mold Materials and Coating Techniques, Boost Investment Casting's Efficiency and Precision

The surging technological advancements in casting technologies have changed the process of investment casting significantly, further improving its precision and efficiency. One of the key innovations is the development of improved mold materials. Presently, modern molds are produced using high-performance materials, which have the ability to sustain extreme pressures and temperatures offering better surface finish and dimensional accuracy. These advanced materials reduce the chances of defects, which include warping or cracking, further compromising final product’s veracity.

In addition, the advanced coating techniques' utilization has changed the procedure in which molds are manufactured. Coatings are utilized in molds for enhancing the release properties, decrease part sticking issues, and facilitate ejection smoothly. This method boosts the procedures of manufacturing and reduces the requirement for extensive post-processing, further decreasing the total costs.

These technological improvements in investment casting have made it a preferred option for industries looking for complex and high-quality parts, helping to achieve strict performance standards. Industries including medical devices, aerospace, and automotive, highly rely on these advanced casting technologies for manufacturing complex components, which need precise surface finishes and tolerances. As a result, the high investment casting demand continues to surge owing to the growing need for durable, lightweight, and complex geometries, which is tough for production methods to achieve. Hence, the innovations in casting technologies have put investment casting as a preferred choice for producers focusing on enhancing product performance, along with maintaining efficiency and cost-effectiveness.

Investment Casting Market Growth Restraints: 

  • High Production Costs in Investment Casting are Primarily Due to Substantial Initial Setup Expenses Hamper Market Expansion

High manufacturing costs is one of the leading restraining factors hampering large adoption of investment casting, especially for small and medium enterprises (SMEs). The investment casting process includes many stages, such as mold production, pattern creation, and finishing, and each of them need specialized equipment and materials. The primary setup for investment casting is relatively high, as they generally include high-quality patterns’ utilization, precise molds, and advanced technologies for achieving required surface finish and dimensional accuracy.

These costs affect SMEs that have limited budgets for operations and do not have flexible financial support for investing in such capital-dependent processes.
In addition, the growing requirement for skilled labor for operating sophisticated casting equipment, along with maintaining the quality control further raises the expenses. SMEs can possibly experience difficulties in competing with large-scale organizations having the ability to reduce these costs more effectively and enjoy the benefits offered by economies of scale.

As a result, many smaller manufacturers might opt for alternative production methods, such as sand casting or injection molding, which can offer lower upfront investments and faster turnaround times, despite potentially sacrificing some quality or precision. Subsequently, the high costs of manufacturing related to investment casting negatively affects its appeal for SMEs, further impeding the investment casting market expansion and innovation within the industry. These cost-related issues need to be addressed for the purpose of market expansion by boosting the advancements in technology, and process efficiency plays an important role in making investment casting market trends more accessible to a larger number of producers.

Key Investment Casting Market Segmentation Analysis:

  • By Application

The aerospace & defense segment held a dominant investment casting market share of approximately 46.02% in 2024 as these investment casting products play a substantial role in the aerospace industry, offering many different important crucial applications. The investment casting process is used to produce precision castings including cable clamps, ball bearings, fuel valves, fuel manifolds, landing gear, brake systems, pitot probes, and different sensors.
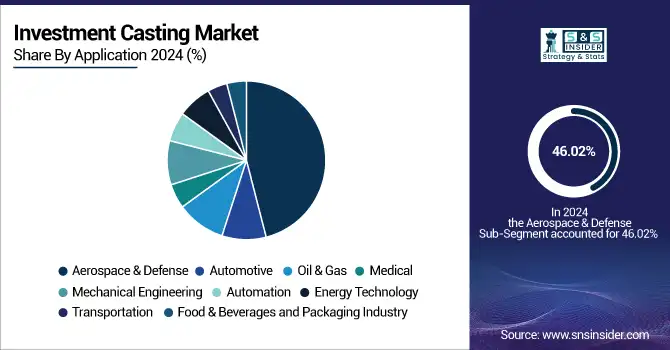
Investment Casting Market, By Application

Do You Need any Customization Research on Investment Casting Market - Inquire Now

Key Investment Casting Market Regional Analysis:

North America Investment Casting Market Insights

The North America region held a dominant position in the investment casting market in 2024, accounting for over 38.02% of the market share. This strong performance can be attributed to the widespread application of investment casting in manufacturing high-value components across several critical industries, including aerospace and defense, oil and gas, and medical sectors. Investment casting is particularly favored in these industries due to its ability to produce complex geometries with high precision, making it ideal for the production of components that require stringent quality standards.
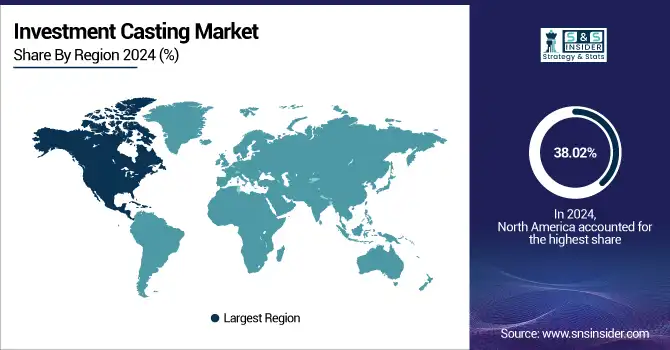
Asia Pacific Investment Casting Market Insights

The Asia Pacific region is anticipated to experience rapid growth during the forecast period. This growth is primarily driven by the sustainable expansion of the automotive, aerospace, and industrial machinery manufacturing sectors within the region. The demand for investment casting is expected to rise significantly as these industries continue to thrive. Notably, the presence of a high number of small and medium-sized manufacturers in Asia Pacific positions the region as a major source of investment cast products.

Investment-Casting-Market-Regional-Analysis-2023

Investment Casting Market Key Players:

Some of the Investment Casting Market Companies

  • Arconic, Inc. (Aluminum and titanium investment castings)

  • Doncasters Group Ltd. (Superalloy investment castings)

  • Hitachi Metals, Ltd. (Steel and non-ferrous investment castings)

  • MetalTek International (Custom investment castings in various metals)

  • Signicast (Precision investment castings in steel and stainless steel)

  • Precision Castparts Corp (Berkshire Hathaway) (Aerospace and industrial investment castings)

  • Zollern GmbH and Co. KG (Investment castings for various industries)

  • Impro Precision Industries Limited (Investment casting, machining, and assembly services)

  • Rogers Corp. (High-performance investment castings for electronics)

  • Alcoa Corporation (Aluminum investment castings)

  • Apex Foundry (Investment castings for aerospace and automotive sectors)

  • Eisenmann Corporation (Industrial and custom investment castings)

  • Castrol (Investment castings for automotive applications)

  • Lisi Aerospace (Investment castings for aerospace components)

  • Kern-Liebers Group (Precision investment castings for various applications)

  • Töddler Foundry (Investment castings in carbon steel and stainless steel)

  • Luminant Capital (Investment castings for energy applications)

  • Ferrostaal GmbH (Investment castings for engineering and manufacturing)

  • Harrison Castings Ltd. (Aluminum and zinc investment castings)

  • Shaanxi Tisky International (Investment casting services in various alloys)

Competitive Landscape for Investment Casting Market:

Texmo Industries, established in 1956 by R. Ramaswamy, is a leading Indian manufacturer specializing in electric motors and agricultural pumps. Headquartered in Coimbatore, Tamil Nadu, the company serves both domestic and international markets. It operates under the Taro Pumps brand, offering a wide range of products for various applications.

  • In 2023: Texmo Precision Castings purchased 75.1% of Feinguss Blank, a company located in Germany with facilities in Romania, for an undisclosed sum. Texmo Precision Castings, a division of the Texmo Group based in India, operates production plants in both the U.S. and India.

3D Systems, founded in 1986 and headquartered in Rock Hill, South Carolina, is a pioneer in 3D printing and additive manufacturing solutions. The company offers a comprehensive range of products, including printers, materials, software, and services, catering to industries such as healthcare, aerospace, automotive, and consumer products.

  • In September 2024: 3D Systems introduced QuickCast Air, an advanced tool for investment casting that reduces material consumption, improves burnout, and enhances pattern draining efficiency. This tool is particularly beneficial for aerospace and defense sectors, allowing for high-precision, large-volume casting patterns.

Investment Casting Market Report Scope:

Report Attributes Details
Market Size in 2024 USD 19.41 Billion 
Market Size by 2032 USD 29.48 Billion 
CAGR CAGR of 4.54% From 2025 to 2032
Base Year 2024
Forecast Period 2025-2032
Historical Data 2021-2023
Report Scope & Coverage Market Size, Segments Analysis, Competitive  Landscape, Regional Analysis, DROC & SWOT Analysis, Forecast Outlook
Key Segments • By Application (Aerospace & Defense, Automotive, Oil & Gas, Medical, Mechanical Engineering, Automation, Food & Beverages and Packaging Industry, Energy Technology, Transportation)
Regional Analysis/Coverage North America (US, Canada, Mexico), Europe (Germany, France, UK, Italy, Spain, Poland, Turkey, Rest of Europe), Asia Pacific (China, India, Japan, South Korea, Singapore, Australia, Rest of Asia Pacific), Middle East & Africa (UAE, Saudi Arabia, Qatar, South Africa, Rest of Middle East & Africa), Latin America (Brazil, Argentina, Rest of Latin America)
Company Profiles
Arconic, Inc., Doncasters Group Ltd., Hitachi Metals, Ltd., MetalTek International, Signicast, Precision Castparts Corp (Berkshire Hathaway), Zollern GmbH and Co. KG, Impro Precision Industries Limited, Rogers Corp., Alcoa Corporation, Apex Foundry, Eisenmann Corporation, Castrol, Lisi Aerospace, Kern-Liebers Group, Töddler Foundry, Luminant Capital, Ferrostaal GmbH, Harrison Castings Ltd., Shaanxi Tisky International.

Table Of Contents

1. Introduction

1.1 Market Definition & Scope

 1.2 Research Assumptions & Abbreviations

 1.3 Research Methodology

2. Executive Summary

2.1 Market Snapshot

 2.2 Market Absolute $ Opportunity Assessment & Y-o-Y Analysis, 2021–2032

 2.3 Market Size & Forecast, By Segmentation, 2021–2032

  2.3.1 Market Size By Application

 2.4 Market Share & Bps Analysis By Region, 2024

 2.5 Industry Growth Scenarios – Conservative, Likely & Optimistic

 2.6 Industry CxO’s Perspective

3. Market Overview

3.1 Market Dynamics

  3.1.1 Drivers

  3.1.2 Restraints

  3.1.3 Opportunities

  3.1.4 Key Market Trends

 3.2 Industry PESTLE Analysis

 3.3 Key Industry Forces (Porter’s) Impacting Market Growth

 3.4 Industry Supply Chain Analysis

  3.4.1 Raw Material Suppliers

  3.4.2 Manufacturers

  3.4.3 Distributors/Suppliers

  3.4.4 Customers/End-Users

 3.5 Industry Life Cycle Assessment

 3.6 Parent Market Overview

 3.7 Market Risk Assessment

4. Statistical Insights & Trends Reporting

4.1 Sustainability Practices & Compliance Standards

4.2 Advanced Product Engineering & Material Innovation

4.3 Supply Chain Risk Assessment & Raw Material Dependability

4.4 Smart Manufacturing & Automated Packaging Integration

4.5 Strategic Alliances, Mergers & Global Expansion

5. Investment Casting Market Segmental Analysis & Forecast, By Application, 2021 – 2032, Value (USD Billion)

5.1 Introduction

 5.2 Aerospace & Defense

  5.2.1 Key Trends

  5.2.2 Market Size & Forecast, 2021 – 2032

 5.3 Automotive

  5.3.1 Key Trends

  5.3.2 Market Size & Forecast, 2021 – 2032

 5.4 Oil & Gas

  5.4.1 Key Trends

  5.4.2 Market Size & Forecast, 2021 – 2032

 5.5 Medical

  5.5.1 Key Trends

  5.5.2 Market Size & Forecast, 2021 – 2032

 5.6 Mechanical Engineering

  5.6.1 Key Trends

  5.6.2 Market Size & Forecast, 2021 – 2032

 5.7 Automation

  5.7.1 Key Trends

  5.7.2 Market Size & Forecast, 2021 – 2032

 5.8 Food & Beverages and Packaging Industry

  5.8.1 Key Trends

  5.8.2 Market Size & Forecast, 2021 – 2032

 5.9 Energy Technology

  5.9.1 Key Trends

  5.9.2 Market Size & Forecast, 2021 – 2032

5.10 Transportation

  5.10.1 Key Trends

  5.10.2 Market Size & Forecast, 2021 – 2032

6. Investment Casting Market Segmental Analysis & Forecast By Region, 2021 – 2025, Value (USD Billion)

6.1 Introduction

6.2 North America

 6.2.1 Key Trends

 6.2.2 Investment Casting Market Size & Forecast, By Application, 2021 – 2032

 6.2.3 Investment Casting Market Size & Forecast, By Country, 2021 – 2032

  6.2.3.1 USA

   6.2.3.1.1 Investment Casting Market Size & Forecast, By Application, 2021 – 2032

  6.2.3.2 Canada

   6.2.3.2.1 Investment Casting Market Size & Forecast, By Application, 2021 – 2032

6.3 Europe

 6.3.1 Key Trends

 6.3.2 Investment Casting Market Size & Forecast, By Application, 2021 – 2032

 6.3.3 Investment Casting Market Size & Forecast, By Country, 2021 – 2032

  6.3.3.1 Germany

   6.3.3.1.1 Investment Casting Market Size & Forecast, By Application, 2021 – 2032

  6.3.3.2 UK

   6.3.3.2.1 Investment Casting Market Size & Forecast, By Application, 2021 – 2032

  6.3.3.3 France

   6.3.3.3.1 Investment Casting Market Size & Forecast, By Application, 2021 – 2032

  6.3.3.4 Italy

   6.3.3.4.1 Investment Casting Market Size & Forecast, By Application, 2021 – 2032

  6.3.3.5 Spain

   6.3.3.5.1 Investment Casting Market Size & Forecast, By Application, 2021 – 2032

  6.3.3.6 Russia

   6.3.3.6.1 Investment Casting Market Size & Forecast, By Application, 2021 – 2032

  6.3.3.7 Poland

   6.3.3.7.1 Investment Casting Market Size & Forecast, By Application, 2021 – 2032

  6.3.3.8 Rest of Europe

   6.3.3.8.1 Investment Casting Market Size & Forecast, By Application, 2021 – 2032

6.4 Asia-Pacific

 6.4.1 Key Trends

 6.4.2 Investment Casting Market Size & Forecast, By Application, 2021 – 2032

 6.4.3 Investment Casting Market Size & Forecast, By Country, 2021 – 2032

  6.4.3.1 China

   6.4.3.1.1 Investment Casting Market Size & Forecast, By Application, 2021 – 2032

  6.4.3.2 India

   6.4.3.2.1 Investment Casting Market Size & Forecast, By Application, 2021 – 2032

  6.4.3.3 Japan

   6.4.3.3.1 Investment Casting Market Size & Forecast, By Application, 2021 – 2032

  6.4.3.4 South Korea

   6.4.3.4.1 Investment Casting Market Size & Forecast, By Application, 2021 – 2032

  6.4.3.5 Australia

   6.4.3.5.1 Investment Casting Market Size & Forecast, By Application, 2021 – 2032

  6.4.3.6 ASEAN Countries

   6.4.3.6.1 Investment Casting Market Size & Forecast, By Application, 2021 – 2032

  6.4.3.7 Rest of Asia-Pacific

   6.4.3.7.1 Investment Casting Market Size & Forecast, By Application, 2021 – 2032

6.5 Latin America

 6.5.1 Key Trends

 6.5.2 Investment Casting Market Size & Forecast, By Application, 2021 – 2032

 6.5.3 Investment Casting Market Size & Forecast, By Country, 2021 – 2032

  6.5.3.1 Brazil

   6.5.3.1.1 Investment Casting Market Size & Forecast, By Application, 2021 – 2032

  6.5.3.2 Argentina

   6.5.3.2.1 Investment Casting Market Size & Forecast, By Application, 2021 – 2032

  6.5.3.3 Mexico

   6.5.3.3.1 Investment Casting Market Size & Forecast, By Application, 2021 – 2032

  6.5.3.4 Colombia

   6.5.3.4.1 Investment Casting Market Size & Forecast, By Application, 2021 – 2032

  6.5.3.5 Rest of Latin America

   6.5.3.5.1 Investment Casting Market Size & Forecast, By Application, 2021 – 2032

6.6 Middle East & Africa

 6.6.1 Key Trends

 6.6.2 Investment Casting Market Size & Forecast, By Application, 2021 – 2032

 6.6.3 Investment Casting Market Size & Forecast, By Country, 2021 – 2032

  6.6.3.1 UAE

   6.6.3.1.1 Investment Casting Market Size & Forecast, By Application, 2021 – 2032

  6.6.3.2 Saudi Arabia

   6.6.3.2.1 Investment Casting Market Size & Forecast, By Application, 2021 – 2032

  6.6.3.3 Qatar

   6.6.3.3.1 Investment Casting Market Size & Forecast, By Application, 2021 – 2032

  6.6.3.4 Egypt

   6.6.3.4.1 Investment Casting Market Size & Forecast, By Application, 2021 – 2032

  6.6.3.5 South Africa

   6.6.3.5.1 Investment Casting Market Size & Forecast, By Application, 2021 – 2032

  6.6.3.6 Rest of Middle East & Africa

   6.6.3.6.1 Investment Casting Market Size & Forecast, By Application, 2021 – 2032

7. Competitive Landscape

 7.1 Key Players' Positioning

 7.2 Competitive Developments

  7.2.1 Key Strategies Adopted (%), By Key Players, 2024

  7.2.2 Year-Wise Strategies & Development, 2021 – 2025

  7.2.3 Number Of Strategies Adopted By Key Players, 2024

 7.3 Market Share Analysis, 2024

 7.4 Product/Service & Application Benchmarking

  7.4.1 Product/Service Specifications & Features By Key Players

  7.4.2 Product/Service Heatmap By Key Players

  7.4.3 Application Heatmap By Key Players

 7.5 Industry Start-Up & Innovation Landscape

7.6 Key Company Profiles

 7.6.1 Arconic, Inc.

  7.6.1.1 Company Overview & Snapshot

  7.6.1.2 Product/Service Portfolio

  7.6.1.3 Key Company Financials

  7.6.1.4 SWOT Analysis

 7.6.2 Doncasters Group Ltd.

  7.6.2.1 Company Overview & Snapshot

  7.6.2.2 Product/Service Portfolio

  7.6.2.3 Key Company Financials

  7.6.2.4 SWOT Analysis

 7.6.3 Shaanxi Tisky International

  7.6.3.1 Company Overview & Snapshot

  7.6.3.2 Product/Service Portfolio

  7.6.3.3 Key Company Financials

  7.6.3.4 SWOT Analysis

 7.6.4 Hitachi Metals, Ltd.

  7.6.4.1 Company Overview & Snapshot

  7.6.4.2 Product/Service Portfolio

  7.6.4.3 Key Company Financials

  7.6.4.4 SWOT Analysis

 7.6.5 MetalTek International

  7.6.5.1 Company Overview & Snapshot

  7.6.5.2 Product/Service Portfolio

  7.6.5.3 Key Company Financials

  7.6.5.4 SWOT Analysis

 7.6.6 Signicast

  7.6.6.1 Company Overview & Snapshot

  7.6.6.2 Product/Service Portfolio

  7.6.6.3 Key Company Financials

  7.6.6.4 SWOT Analysis

 7.6.7 Precision Castparts Corp (Berkshire Hathaway)

  7.6.7.1 Company Overview & Snapshot

  7.6.7.2 Product/Service Portfolio

  7.6.7.3 Key Company Financials

  7.6.7.4 SWOT Analysis

 7.6.8 Zollern GmbH and Co. KG

  7.6.8.1 Company Overview & Snapshot

  7.6.8.2 Product/Service Portfolio

  7.6.8.3 Key Company Financials

  7.6.8.4 SWOT Analysis

 7.6.9 Impro Precision Industries Limited

  7.6.9.1 Company Overview & Snapshot

  7.6.9.2 Product/Service Portfolio

  7.6.9.3 Key Company Financials

  7.6.9.4 SWOT Analysis

 7.6.10 Rogers Corp.

  7.6.10.1 Company Overview & Snapshot

  7.6.10.2 Product/Service Portfolio

  7.6.10.3 Key Company Financials

  7.6.10.4 SWOT Analysis

 7.6.11 Alcoa Corporation

  7.6.11.1 Company Overview & Snapshot

  7.6.11.2 Product/Service Portfolio

  7.6.11.3 Key Company Financials

  7.6.11.4 SWOT Analysis

 7.6.12 Apex Foundry

  7.6.12.1 Company Overview & Snapshot

  7.6.12.2 Product/Service Portfolio

  7.6.12.3 Key Company Financials

  7.6.12.4 SWOT Analysis

 7.6.13 Eisenmann Corporation

  7.6.13.1 Company Overview & Snapshot

  7.6.13.2 Product/Service Portfolio

  7.6.13.3 Key Company Financials

  7.6.13.4 SWOT Analysis

 7.6.14 Castrol

  7.6.14.1 Company Overview & Snapshot

  7.6.14.2 Product/Service Portfolio

  7.6.14.3 Key Company Financials

  7.6.14.4 SWOT Analysis

 7.6.15 Lisi Aerospace

  7.6.15.1 Company Overview & Snapshot

  7.6.15.2 Product/Service Portfolio

  7.6.15.3 Key Company Financials

  7.6.15.4 SWOT Analysis

 7.6.16 Kern-Liebers Group

  7.6.16.1 Company Overview & Snapshot

  7.6.16.2 Product/Service Portfolio

  7.6.16.3 Key Company Financials

  7.6.16.4 SWOT Analysis

 7.6.17 Töddler Foundry

  7.6.17.1 Company Overview & Snapshot

  7.6.17.2 Product/Service Portfolio

  7.6.17.3 Key Company Financials

  7.6.17.4 SWOT Analysis

 7.6.18 Luminant Capital

  7.6.18.1 Company Overview & Snapshot

  7.6.18.2 Product/Service Portfolio

  7.6.18.3 Key Company Financials

  7.6.18.4 SWOT Analysis

 7.6.19 Ferrostaal GmbH

  7.6.19.1 Company Overview & Snapshot

  7.6.19.2 Product/Service Portfolio

  7.6.19.3 Key Company Financials

  7.6.19.4 SWOT Analysis

 7.6.20 Harrison Castings Ltd.

  7.6.20.1 Company Overview & Snapshot

  7.6.20.2 Product/Service Portfolio

  7.6.20.3 Key Company Financials

  7.6.20.4 SWOT Analysis

8. Analyst Recommendations

 8.1 SNS Insider Opportunity Map

 8.2 Industry Low-Hanging Fruit Assessment

 8.3 Market Entry & Growth Strategy

 8.4 Analyst Viewpoint & Suggestions On Market Growth

9. Assumptions

10. Disclaimer

11. Appendix

 11.1 List Of Tables

 11.2 List Of Figures

Key Segments

By Application

  • Aerospace & Defense

  • Automotive

  • Oil & Gas

  • Medical

  • Mechanical Engineering

  • Automation

  • Food & Beverages and Packaging Industry

  • Energy Technology

  • Transportation

Request for Segment Customization as per your Business Requirement: Segment Customization Request


Regional Coverage: 

North America

  • US

  • Canada

  • Mexico

Europe

  • Germany

  • France

  • UK

  • Italy

  • Spain

  • Poland

  • Turkey

  • Rest of Europe

Asia Pacific

  • China

  • India

  • Japan

  • South Korea

  • Singapore

  • Australia

  • Rest of Asia Pacific

Middle East & Africa

  • UAE

  • Saudi Arabia

  • Qatar

  • South Africa

  • Rest of Middle East & Africa

Latin America

  • Brazil

  • Argentina

  • Rest of Latin America


Request for Country Level Research Report: Country Level Customization Request


Available Customization 

With the given market data, SNS Insider offers customization as per the company’s specific needs. The following customization options are available for the report: 

  • Detailed Volume Analysis 

  • Criss-Cross segment analysis (e.g. Product X Application) 

  • Competitive Product Benchmarking 

  • Geographic Analysis 

  • Additional countries in any of the regions 

  • Customized Data Representation 

  • Detailed analysis and profiling of additional market players

An accurate research report requires proper strategizing as well as implementation. There are multiple factors involved in the completion of good and accurate research report and selecting the best methodology to compete the research is the toughest part. Since the research reports we provide play a crucial role in any company’s decision-making process, therefore we at SNS Insider always believe that we should choose the best method which gives us results closer to reality. This allows us to reach at a stage wherein we can provide our clients best and accurate investment to output ratio.

Each report that we prepare takes a timeframe of 350-400 business hours for production. Starting from the selection of titles through a couple of in-depth brain storming session to the final QC process before uploading our titles on our website we dedicate around 350 working hours. The titles are selected based on their current market cap and the foreseen CAGR and growth.


The 5 steps process:

Step 1: Secondary Research:

Secondary Research or Desk Research is as the name suggests is a research process wherein, we collect data through the readily available information. In this process we use various paid and unpaid databases which our team has access to and gather data through the same. This includes examining of listed companies’ annual reports, Journals, SEC filling etc. Apart from this our team has access to various associations across the globe across different industries. Lastly, we have exchange relationships with various university as well as individual libraries.

Secondary Research

Step 2: Primary Research

When we talk about primary research, it is a type of study in which the researchers collect relevant data samples directly, rather than relying on previously collected data.  This type of research is focused on gaining content specific facts that can be sued to solve specific problems. Since the collected data is fresh and first hand therefore it makes the study more accurate and genuine.

We at SNS Insider have divided Primary Research into 2 parts.

Part 1 wherein we interview the KOLs of major players as well as the upcoming ones across various geographic regions. This allows us to have their view over the market scenario and acts as an important tool to come closer to the accurate market numbers. As many as 45 paid and unpaid primary interviews are taken from both the demand and supply side of the industry to make sure we land at an accurate judgement and analysis of the market.

This step involves the triangulation of data wherein our team analyses the interview transcripts, online survey responses and observation of on filed participants. The below mentioned chart should give a better understanding of the part 1 of the primary interview.

Primary Research

Part 2: In this part of primary research the data collected via secondary research and the part 1 of the primary research is validated with the interviews from individual consultants and subject matter experts.

Consultants are those set of people who have at least 12 years of experience and expertise within the industry whereas Subject Matter Experts are those with at least 15 years of experience behind their back within the same space. The data with the help of two main processes i.e., FGDs (Focused Group Discussions) and IDs (Individual Discussions). This gives us a 3rd party nonbiased primary view of the market scenario making it a more dependable one while collation of the data pointers.

Step 3: Data Bank Validation

Once all the information is collected via primary and secondary sources, we run that information for data validation. At our intelligence centre our research heads track a lot of information related to the market which includes the quarterly reports, the daily stock prices, and other relevant information. Our data bank server gets updated every fortnight and that is how the information which we collected using our primary and secondary information is revalidated in real time.

Data Bank Validation

Step 4: QA/QC Process

After all the data collection and validation our team does a final level of quality check and quality assurance to get rid of any unwanted or undesired mistakes. This might include but not limited to getting rid of the any typos, duplication of numbers or missing of any important information. The people involved in this process include technical content writers, research heads and graphics people. Once this process is completed the title gets uploader on our platform for our clients to read it.

Step 5: Final QC/QA Process:

This is the last process and comes when the client has ordered the study. In this process a final QA/QC is done before the study is emailed to the client. Since we believe in giving our clients a good experience of our research studies, therefore, to make sure that we do not lack at our end in any way humanly possible we do a final round of quality check and then dispatch the study to the client.