Artificial Lift Systems Market Report Scope & Overview:
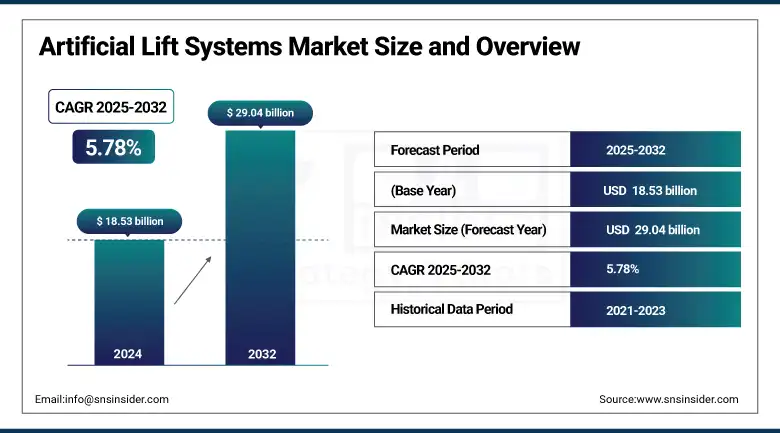
The Artificial Lift Systems Market size was valued at USD 18.53 billion in 2024 and is expected to reach USD 29.04 billion by 2032, growing at a CAGR of 5.78% over the forecast period of 2025-2032.
The Artificial Lift Systems Market is witnessing robust growth driven by the increasing demand for efficient oil extraction methods in maturing reservoirs. Although natural well pressure diminishes over the life of a well, it is usually necessary to install artificial lift to keep the wells producing. Artificial Lift Systems Market Trends, include automation technology has seen a surge in acceptance, with digital oilfield technology incorporated in the systems. Among lifting methods, rod lift, ESP, and gas lift systems are widely used for their reliability and ability to be scaled.
To Get more information On Artificial Lift Systems Market - Request Free Sample Report
Onshore Artificial Lift systems dominate the installations, primarily due to the large number of land-based wells, but Offshore Artificial Lift technologies are also being adopted despite Offshore exploration becoming more and more common. Technology innovations, including intelligent elevator solutions and predictive, real-time equipment monitoring, are helping to make systems more efficient and less prone to failure. The market is further driven by the demand for opex reduction and increased oil recovery, in particular from unconventional wells.
Globally, over 90% of producing oil wells use some form of artificial lift system, with rod lifts being used in approximately 60% of them. As the industry continues to shift towards more sustainable and data-driven operations, the Artificial Lift Systems Market Growth is expected to evolve with more customized and hybrid lift methods.
In June 2025, Levare USA introduced advanced Electric Submersible Plunger Pump (ESPP) systems using Permanent Magnet Motors to enhance artificial lift efficiency, reported World Oil. These systems reduce power use by up to 20%, eliminate surface pumpjacks, and enable deeper placements. They are ideal for complex, low-flow wells and offer real-time monitoring to optimize performance.
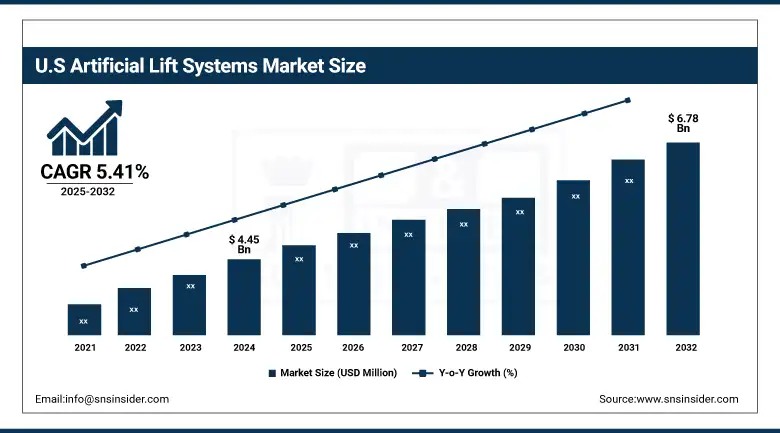
The U.S. leads the North American Artificial Lift Systems Market, valued at USD 4.45 billion in 2024 and projected to reach USD 6.78 billion by 2032, growing at a CAGR of 5.41%. Growth is driven by extensive shale oil production and enhanced recovery efforts in mature fields. The U.S. benefits from strong infrastructure, advanced technologies, and a high concentration of key industry players. Regions including the Permian and Eagle Ford basins are major contributors.
Artificial Lift Systems Market Dynamics:
Drivers:
- Rising Global Energy Demand Fuels Growth of Artificial Lift Market, With ESPs Leading the Way
The growth of the Artificial Lift Market is fuelled by the energy demand, which is continuously growing and is high owing to the global growth. Increasing population, fast urbanization, and increasing industrial activity led to a huge and growing global oil and gas consumption. With the natural depletion of pressure from conventional reservoirs, operators are turning to artificial lift systems to continue or improve hydrocarbon recovery. With expectations that global demand for oil will exceed 100 million barrels per day in 2025, the time for effective production solutions is now. Due to their capability to operate high-volume wells and deep reservoirs, Electric Submersible Pumps ESPs have become one of the most widely used technologies in this context.
These systems are critical for optimizing production from advanced/state-of-the-art and nontraditional shale plays. As production levels are sustained through increasing dependence on artificial lift technologies, they have become essential workhorses in a rapidly evolving energy sector. This demand spike will be a big driver for the implication of continued growth in artificial lift.
Restraints:
- High Capital and Operating Costs, Widespread Adoption of Advanced Artificial Lift Systems
Systems, such as electric submersible pumps (ESPs), gas lifts, and rod lifts can be capital- and opex-intensive, burdensome for small producers or low-margin projects. The total cost of ownership includes not just the equipment but what it costs to install, upgrade your infrastructure, and integrate it all into your existing operations. The costs invariably rise even more in the offshore domain, driven by logistical, marine, and engineering concerns. The financial burden is further compounded by maintenance costs, including periodic replacements, technical support, and energy consumption. An example is the cost of installing an ESP in deepwater locations, which could be as high as USD 2million, and with annual maintenance costing tens of thousands of dollars in some wells. In turbulent oil-price environments, these elevated costs frequently result in small operators deferring or forgoing deployment, restricting production and penetration of new advanced lift technologies.
Artificial Lift Systems Market Segmentation Analysis:
By Products
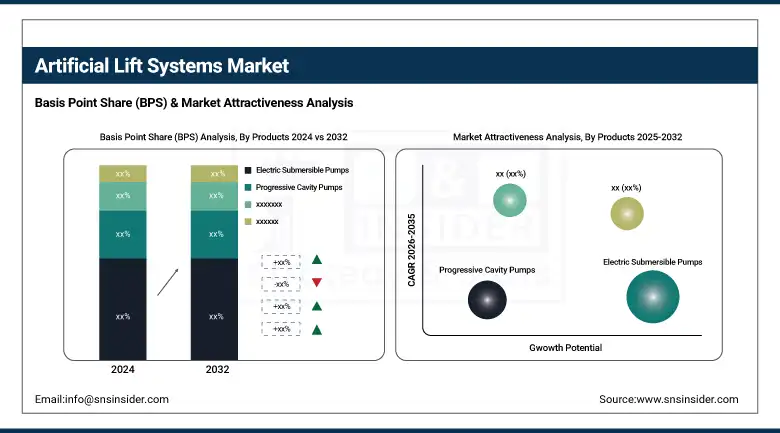
The Electric Submersible Pumps segment dominated the market, accounting for 48% of the Artificial Lift Systems market share. They are the preferred solution in high-volume oil wells, particularly offshore and deep onshore fields, where they are used to lift large volumes from considerable depths with high efficiency. Their compatibility with electronic control systems, and their stability at harsh operating conditions, will secure their position at the top of the market.
Rod Lifts are the fastest-growing segment due to their cost-effectiveness and simplicity, especially in low-to-medium depth wells. This is fast attributed to their scalability in vertical and horizontal wells, along with the ability to apply in unconventional onshore fields, which is especially prominent in North America and Asia-Pacific.
By Component
The Pump component led the market, accounting for 52% in 2024. As the core of the artificial lift system, pumps are essential across all lift types. At the centre of every artificial lift system is the pump, which is common to all forms of lift. The constant replacement, upgrades, and maintenance add to their market value, ensuring their supremacy.
The Controller segment is experiencing the fastest growth, backed by the application of integrated digital technologies, such as Internet of Things (IOT), automation, and remote monitoring. Smart controllers act as enablers of system efficiency and predictive maintenance, and downtime reduction can be critical to optimizing the modern oilfield.
By Mechanism
Pump-assisted mechanisms dominated with a 64% market share in 2024. These systems, such as ESPs and rod lifts, have better production consistency, especially in the mature fields. Their advanced technology in the production of indefinite well production from the depth and deviated air also forms a solid part of the reason for their stronghold in the market.
Gas-assisted lift systems are growing swiftly as they are particularly effective in wells with low pressure or inconsistent flow. With their rising application in shale and unconventional reservoirs, along with a lower cost of operation, they are now preferred by operators for being efficient and mobile.
By Well Type
Vertical wells held a 58% share in 2024, dominating this segment. Even with the advent of horizontal drilling, a vast majority of the oilfields are still highly dependent upon vertical wells, particularly in mature areas. Most of these aging vertical wells rely on artificial lift to continue producing, keeping them alive.
Horizontal wells are the fastest-growing due to their increased use in unconventional oil and gas plays. These wells yield higher production volumes, and artificial lift systems are essential for maintaining flow in extended lateral sections, especially in tight formations, such as shale.
By Technology
Offshore operations dominated with a 62% share in 2024, driven by the need for advanced lifting methods in deepwater and ultra-deepwater reserves. Due to challenging marine environments and the need for consistent flow rates, offshore artificial lift systems are more complex and thus command a larger portion of market investment.
Onshore artificial lift systems are growing at the fastest pace, fueled by rising exploration activities in unconventional shale reserves, particularly in North America and Asia-Pacific. The lower operational costs and quicker deployment of onshore projects compared to offshore are further accelerating market expansion in this segment.
Artificial Lift Systems Market Regional Outlook:
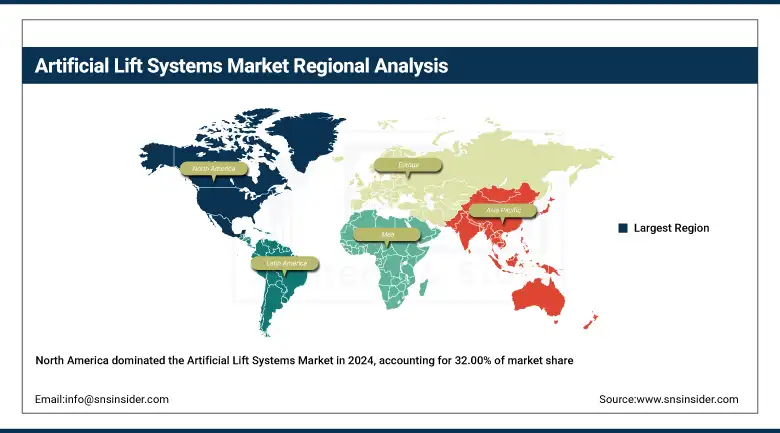
North America currently dominates the Artificial Lift Systems Market, holding the largest market share of approximately 32.00% in 2024. This dominance is primarily driven by the region’s vast shale reserves and extensive oil & gas production in areas like the Permian Basin, Eagle Ford, and Bakken. Advances in technology, along with the presence of larger artificial lift manufacturers and oilfield service companies, also bolster its foundation. Robust infrastructure, capital investment, and regulatory support for enhanced oil recovery (EOR) techniques have long been in place within the U.S. and Canada. Furthermore, mature oil wells in this region require increased artificial lift installations, especially Electric Submersible Pumps (ESPs) and Rod Lifts, leading to a continuous demand and market growth.
Get Customized Report as per Your Business Requirement - Enquiry Now
Asia Pacific is emerging as the fastest-growing region in the Artificial Lift Systems Market, driven by rising energy demand, increasing oilfield investments, and exploration in countries including China, India, Indonesia, and Australia. Increased domestic oil production is increasingly reliant on artificial lift technologies to improve output from mature wells as rapid industrialization, urbanization, and population growth pressure governments to produce more oil domestically. Moreover, favorable energy policies and foreign investments in upstream sectors accelerate technology uptake in offshore and onshore fields. Regional oilfield service companies continue to gain market share and minimize costs, creating a preferential economic environment and ensuring high CAGR throughout the region during the forecast period, reshaping the global competitive landscape.
China is the dominant country; this leadership is attributed to its large-scale oil production activities, a significant number of mature wells, and increasing adoption of artificial lift technologies to enhance production efficiency. Additionally, strong government support for energy development and the presence of major oilfield service providers further strengthens China’s position in the region.
Europe holds a significant share in the Artificial Lift Systems Market, underpinned by activities in the North Sea, Norway, and Russia. With the region at its peak of mature fields, greater advanced lift technologies, such as gas lifts and progressive cavity pumps have been implemented to achieve maximum recovery of oil. European energy companies are concentrated on enhancing the sustainability & emissions approach that stimulates the adoption of smart lift systems and automation. Even with the energy transition and a gradual move to renewables, regional energy supply needs make artificial lift demand firm. For Europe, the status quo and gradual growth within the global sector are sustained through ongoing R&D and collaborations with oilfield service providers.
Artificial Lift Systems Companies are:
Schneider Electric, Mitsubishi Electric Corporation, Cisco Systems, Inc., Emerson Electric Co., Honeywell International Inc., Siemens, Schweitzer Engineering Laboratories, Inc. (SEL), ABB, General Electric Company, and Weatherford International plc.
Recent Development
In April 2025, Mitsubishi Electric acquired Ascension Lifts, a Dublin-based elevator company, through its subsidiary Motum AB. This move aims to strengthen Mitsubishi’s maintenance and renewal services across Europe. Ascension is known for its multi-brand expertise and strong presence in Ireland. The acquisition supports Mitsubishi’s strategy to expand its building systems business in the region.
In June 2025, Mitsubishi Electric’s ME Innovation Fund invested in Archeda, Inc., a Japanese startup using satellite and AI technology for carbon credit monitoring, supporting Japan’s upcoming emissions trading system. On the same day, Mitsubishi Electric also signed an MOU with GE Vernova to strengthen collaboration on IGBT semiconductors for HVDC systems, aiming to enhance renewable energy infrastructure and U.S.-Japan energy supply chains
| Report Attributes | Details |
|---|---|
| Market Size in 2024 | USD 18.53 Billion |
| Market Size by 2032 | USD 29.04 Billion |
| CAGR | CAGR of 5.78% from 2025 to 2032 |
| Base Year | 2024 |
| Forecast Period | 2025-2032 |
| Historical Data | 2021-2023 |
| Report Scope & Coverage | Market Size, Segments Analysis, Competitive Landscape, Regional Analysis, DROC & SWOT Analysis, Forecast Outlook |
| Key Segments | • By Products (Rod Lifts, Electric Submersible Pumps, Progressive Cavity Pumps, Gas Lift, Hydraulic Pumps, Others) • By Component (Pump, Motor, Cable Systems, Controller, Others) • By Mechanism (Pump Assisted, Gas Assisted) • By Well Type (Horizontal, Vertical) • By Technology (Onshore, Offshore) |
| Regional Analysis/Coverage | North America (US, Canada, Mexico), Europe (Germany, France, UK, Italy, Spain, Poland, Turkey, Rest of Europe), Asia Pacific (China, India, Japan, South Korea, Singapore, Australia, Rest of Asia Pacific), Middle East & Africa (UAE, Saudi Arabia, Qatar, South Africa, Rest of Middle East & Africa), Latin America (Brazil, Argentina, Rest of Latin America) |
| Company Profiles | Schneider Electric, Mitsubishi Electric Corporation, Cisco Systems, Inc., Emerson Electric Co., Honeywell International Inc., Siemens, Schweitzer Engineering Laboratories, Inc. (SEL), ABB, General Electric Company, Weatherford International plc. |
Frequently Asked Questions
The North America region dominated the Artificial Lift Systems Market in 2024.
The “Electric Submersible Pumps” segment dominated the Artificial Lift Systems Market.
Rising Global Energy Demand Fuels Growth of Artificial Lift Market, With ESPs Leading the Way
The Artificial Lift Systems Market was USD 18.53 billion in 2024 and is expected to reach USD 29.04 billion by 2032.
The Artificial Lift Systems Market is expected to grow at a CAGR of 5.78% from 2025-2032.
Get in Touch
