Iodine Market Report Scope & Overview
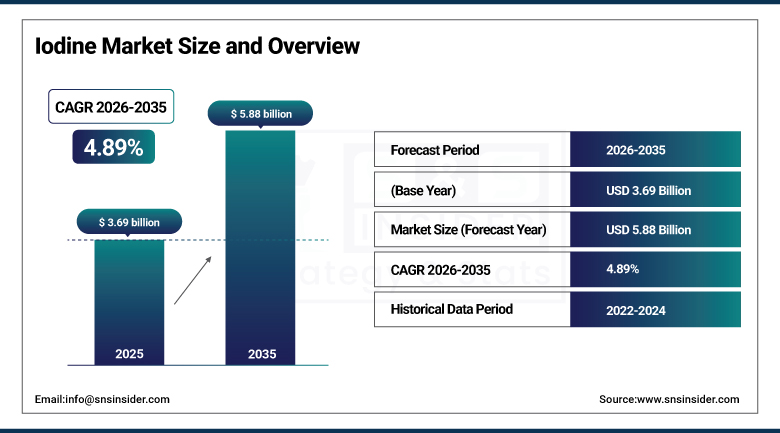
The Iodine Market was valued at USD 3.69 billion in 2025 and is expected to reach USD 5.88 billion by 2035, growing at a CAGR of 4.89% from 2026-2035.
The iodine market analysis has experienced growth due to its increased application in the chemical industry as catalysts and polarizing films. The reason behind this is that it is an extremely important element in many different applications within the growth of the chemical industry. The heaviest atom of iodine, which is stable, has many different applications and is important as a catalyst in chemical reactions, especially the production of acetic acid and other industrial chemicals. These types of catalysts are very important for achieving efficient and selective conversions, which must be accomplished during the mass production of native elements.
According to the U.S. Geological Survey USGS offers extensive data concerning the production, consumption, and trade of iodine. Their report for 2024 estimated a decline of U.S. iodine production from 2022, while iodine imports averaged USD 61/kg in 2023, 30% higher than in 2022.
Iodine Market Size and Forecast
-
Iodine Market Size in 2025: USD 3.69 Billion
-
Iodine Market Size by 2035: USD 5.88 Billion
-
CAGR: 4.89% from 2026 to 2035
-
Base Year: 2025
-
Forecast Period: 2026–2035
-
Historical Data: 2022–2024
To Get more information on Iodine Market - Request Free Sample Report
Iodine Market Trends
-
Rising demand for iodine in pharmaceuticals, medical imaging, and antiseptic applications is driving the iodine market.
-
Growing adoption in nutrition supplements and animal feed additives is boosting market growth.
-
Expansion of healthcare infrastructure and diagnostic procedures is fueling iodine consumption.
-
Increasing focus on iodine fortification programs to address nutritional deficiencies is shaping adoption trends.
-
Advancements in iodine extraction, refining, and recycling technologies are enhancing production efficiency and supply stability.
-
Rising demand from electronics, LCD displays, and industrial catalyst applications is supporting market expansion.
-
Collaborations between chemical manufacturers, healthcare providers, and industrial users are accelerating innovation and global adoption.
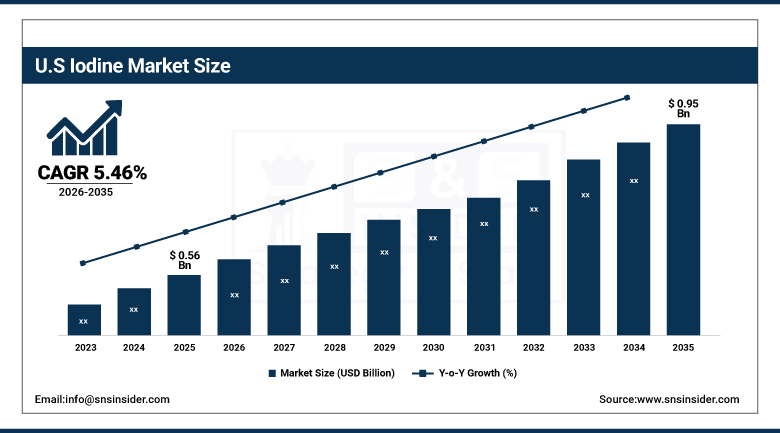
U.S. Iodine Market was valued at USD 0.56 billion in 2025 and is expected to reach USD 0.95 billion by 2035, growing at a CAGR of 5.46% from 2026-2035.
Growth in the iodine market in the United States is expected to increase on account of increasing utilization of iodine in contrast media, prevalence of chronic conditions, and development of diagnostic procedures. Growth in the market is also expected owing to applications in medicines, chemicals, and brine sources along with innovations in health care technology.
Iodine Market Segment Highlights
-
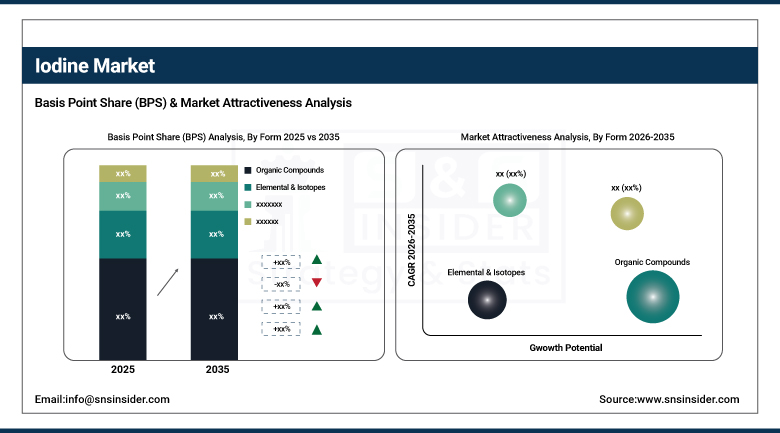
By Form, Organic Compounds segment dominated the Iodine Market in 2025 with around 62% share; Inorganic Salts & Complexes segment is the fastest growing during the forecast period.
-
By Source, Caliche Ore segment dominated the Iodine Market in 2025 with around 46% share; Underground Brines segment is the fastest growing during the forecast period.
-
By End-use Industry, Medical Imaging segment dominated the Iodine Market in 2025 with around 32% share; Pharmaceuticals segment is the fastest growing during the forecast period.
Iodine Market Segment Analysis
By Form, Organic Compounds segment dominates the Iodine Market, Inorganic Salts & Complexes segment expected to grow fastest
The Organic Compounds segment held dominance in the Iodine Market during 2025 owing to their extensive use in pharmaceutical products, agrochemicals, and the synthesis of specialty chemicals, wherein the use of iodine derivatives in organic form is essential for enhancing the efficacy of these products. High demand for healthcare applications including diagnostic agents and antiseptics also added to the dominance of this segment. Well-established production processes and popularity of these iodine derivatives in the industry have also made this segment dominate.
The Inorganic Salts & Complexes segment is projected to experience the fastest growth rate during the forecast period due to increasing consumption for advanced healthcare applications, catalysts, and as nutritional supplements. Increasing usage of these salts due to cost-effectiveness and stability makes them the preferred choice for various formulation in pharmaceuticals and chemical industry. Growing emphasis on iodine deficiency treatments, their use as animal feed additives, and application in specialty industrial processes is boosting this segment's growth rate.
By Source, Caliche Ore segment dominates the Iodine Market, Underground Brines segment expected to grow fastest
The Caliche Ore segment held a dominant position in the Iodine Market in 2025 due to the extensive availability of this mineral in significant mining areas and advanced extraction facilities. This mineral is still the most cost-effective and common feedstock for iodine production, providing a stable output and developed refining technologies. Effective logistics systems and large-scale mining activities contribute to the dominance of this segment within the global iodine market.
The Underground Brines segment is expected to register the fastest growth rate over the forecast period, driven by growing extraction operations fueled by high iodine demand and advanced brine processing techniques. This category represents an environmentally friendly and economically viable alternative to conventional mining operations, with higher efficiency and reduced ecological footprint. Developing mining initiatives and innovative technologies for the extraction process are driving the segment's growth.
By End-use Industry, Medical Imaging segment dominates the Iodine Market, Pharmaceuticals segment expected to grow fastest
Medical Imaging segment was the largest segment in the Iodine Market in 2025 owing to the critical application of iodine as a component of contrast media for X-ray and CT scanning techniques. The growing incidence rate of chronic diseases along with the escalating demand for medical diagnostic devices has increased the consumption of iodine for imaging purposes. The presence of extensive healthcare facilities and wide clinical acceptance of iodine contrast media have further propelled the market dynamics.
The Pharmaceuticals segment will exhibit the highest CAGR during the forecast period on account of the increasing use of iodine in the manufacture of drugs, antiseptics, and medical therapies. Factors such as growing research & development activities in the pharmaceutical industry, increasing expenditure on global health care, and rising demand for iodine medicines and supplements have been fueling the growth trajectory of this segment.
Iodine Market Regional Analysis
|
Region |
Major Country |
Share within Region (%) |
|---|---|---|
|
North America |
United States |
89.2% |
|
Europe |
United Kingdom |
18.6% |
|
Asia Pacific |
Australia |
6.4% |
|
Middle East & Africa |
UAE |
11.7% |
|
Latin America |
Brazil |
46.3% |
Europe Iodine Market Insights
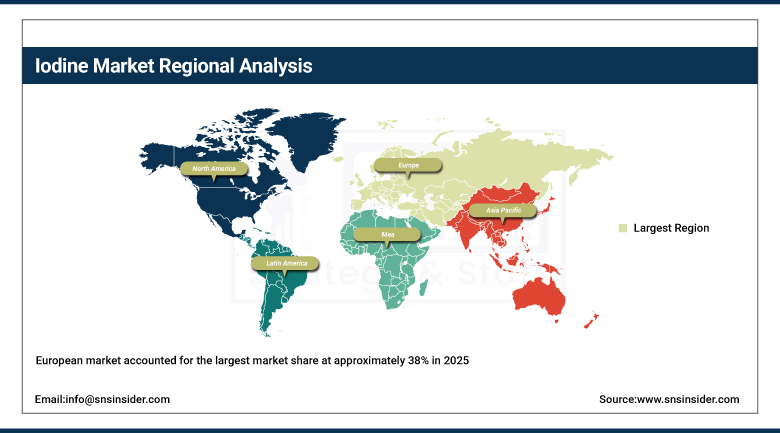
The European market accounted for the largest market share at approximately 38% in 2025. This is attributed to the developed infrastructure available in the area in addition to the highly established pharmaceutical industry as well as significant investment in technology. The presence of renowned manufacturers and research organizations within the region boosts the total demand for iodine in various industries, including the health care sector, chemical industry, and electronics industry. The stringent regulatory policies regarding public health and environmental safety in Europe have promoted the application of iodine in medical imaging, medicines, and dietary supplements.
For instance, in March 2024, the Ajay-SQM Group developed the production of pharmaceutical-grade iodine compounds. The enhanced purity and effectiveness of the iodine will facilitate better use in iodine-based medicinal throat preparations, and this is expected to revitalize iodine uptake in the high-value pharmaceutical industry sector.
Get Customized Report as per Your Business Requirement - Enquiry Now
North America Iodine Market Insights
The iodine market in North America is showing a steady rate of growth due to high demand from industries like pharmaceuticals and medical diagnostics. The growing use of iodine as a contrast agent during diagnostic tests like CT scanning and X-rays is contributing to the growth of the market in this sector. Other factors contributing to the high growth in this market include the growing prevalence of chronic conditions and improved healthcare infrastructure in the country.
Asia Pacific Iodine Market Insights
Asia Pacific accounted for a considerable share in the global market in 2025. This is attributed to the fast-growing manufacturing industry, rising demand for healthcare in the region, and availability of natural reserves of iodine. Nations such as China, Japan, and India have fueled the massive development of the pharmaceuticals, animal feed, and chemicals industries in the region, all of which are major consumers of iodine. Increased awareness about the problem of iodine deficiency and government policies have resulted in an increase in the need for iodine in dietary supplements. Additionally, Asia Pacific possesses caliche ore and brine reserves that make sure there is continuous availability of iodine production.
Middle East & Africa and Latin America Iodine Market Insights
Iodine Market Trends in Middle East & Africa and Latin America are experiencing consistent growth as a result of the increasing demand from the healthcare industry, pharmaceuticals, and various industrial applications. Rising demand for iodine as contrast agents in medical imaging, along with increased utilization of iodine in various chemical and dietary uses, is driving the market growth. Latin America is gaining advantage from the robust production operations for iodine, whereas Middle East & Africa is gaining momentum owing to better healthcare facilities and higher diagnostic tests. Some geographical areas lack domestic production capabilities, making it necessary to rely on imports.
Iodine Market Growth Drivers:
-
Rising demand for iodine-based medical imaging and pharmaceutical applications accelerating global consumption growth
The extensive use of iodine as an additive in contrast medium in the imaging techniques like X-ray, computerized tomography (CT), and angiography is greatly contributing to the expansion of the market worldwide. The rising occurrence of chronic illnesses, including those related to cardiovascular problems, cancer, and neurology, is contributing towards the growing number of procedures involved in diagnostic imaging. Apart from being used in diagnostic imaging, iodine is important in thyroid medicine and antiseptics, thus increasing the need for this chemical compound in the pharmaceuticals sector.
Iodine Market Restraints:
-
Volatile iodine prices and concentrated global supply chain limiting stable procurement and long-term contract planning across industries
The fluctuating prices of iodine, resulting from the concentration of its supply in a few producers, generate uncertainties in its procurement process for both buyers and manufacturing companies. The dependence on certain areas, such as those of Chile and Japan, exposes the market to risks related to the disruption of production and exports or any other factors related to the politics of these states. Changes in the production and/or export levels of iodine would affect the entire market and cause further fluctuations in its prices. The problem extends to the management of costs in smaller iodine-related manufacturing facilities.
Iodine Market Opportunities:
-
Growing industrial diversification into electronics, specialty chemicals, and advanced materials creating new high-value application opportunities
The increasing consumption of iodine for making LCD polarizers, catalysts, dyes, and advanced polymers means that it is becoming more important industrially than ever before. The rapid developments in electronics and displays have increased the demand for iodine compounds for the manufacturing of advanced materials. There is growing interest in the use of iodine for chemical synthesis and production of specialty chemicals. New uses in energy storage devices, coatings, and sustainable materials are making iodine even more valuable from a market point of view. All this is happening because of ongoing research and development efforts and advancements in material sciences.
Recent Developments:
-
2026: Iofina plc entered 2026 with plans to continue annual IOsorb plant expansion following strong 2025 production growth. The company focused on increasing iodine extraction capacity and supporting rising global demand from pharmaceutical and industrial customers.
-
2025: Iofina plc reported another record H1 iodine production performance in 2025 and commissioned the new IO#11 plant. The expansion increased crystalline iodine production capacity and supported long-term supply growth across specialty chemical and industrial markets.
-
2024: SQM Iodine Plant Nutrition received ISO 50001 and ISO 14001 certifications for its iodine and plant nutrition division. The certification highlighted improvements in energy efficiency, environmental management, and sustainability practices at the Coya Sur and Nueva Victoria operations.
-
2024: SQM signed a supply collaboration related to iodine-based refrigerant development with SK Enmove. The partnership supports next-generation low-global-warming refrigerants designed for electric vehicle heat pump systems and advanced thermal management applications.
Key Players
Some of the Iodine Market Companies
-
Sociedad Química y Minera de Chile (SQM)
-
Cosayach (Compañía de Salitre y Yodo)
-
Iofina plc
-
ISE Chemicals Corporation
-
GODO SHIGEN Co., Ltd.
-
Iochem Corporation
-
Nippoh Chemicals Co., Ltd.
-
Kanto Natural Gas Development Co., Ltd.
-
Toho Earthtech Co., Ltd.
-
Algorta Norte S.A.
-
Deepwater Chemicals Inc.
-
Calibre Chemicals Pvt. Ltd.
-
Samrat Pharmachem Limited
-
Eskay Iodine Pvt. Ltd.
-
Salvi Chemical Industries Ltd.
-
Glide Chem Private Limited
-
Protochem Industries Pvt. Ltd.
-
Ajay-SQM Group
-
Wengfu Group
-
Qingdao Bright Moon Seaweed Group
| Report Attributes | Details |
|---|---|
| Market Size in 2025 | USD 3.69 Billion |
| Market Size by 2035 | USD 5.88 Billion |
| CAGR | CAGR of 4.89% From 2026 to 2035 |
| Base Year | 2025 |
| Forecast Period | 2026-2035 |
| Historical Data | 2022-2024 |
| Report Scope & Coverage | Market Size, Segments Analysis, Competitive Landscape, Regional Analysis, DROC & SWOT Analysis, Forecast Outlook |
| Key Segments | •By Form (Organic Compound, Inorganic Salts & Complexes, Elemental & Isotopes) • By Source (Caliche Ore, Underground Brines, Recycling, Seaweed) • End-Use Industry (Pharmaceuticals, Animal Feed, Medical Imaging, Chemicals, Others) |
| Regional Analysis/Coverage | North America (US, Canada), Europe (Germany, UK, France, Italy, Spain, Russia, Poland, Rest of Europe), Asia Pacific (China, India, Japan, South Korea, Australia, ASEAN Countries, Rest of Asia Pacific), Middle East & Africa (UAE, Saudi Arabia, Qatar, South Africa, Rest of Middle East & Africa), Latin America (Brazil, Argentina, Mexico, Colombia, Rest of Latin America). |
| Company Profiles | Sociedad Química y Minera de Chile (SQM), Cosayach (Compañía de Salitre y Yodo), Iofina plc, ISE Chemicals Corporation, GODO SHIGEN Co., Ltd., Iochem Corporation, Nippoh Chemicals Co., Ltd., Kanto Natural Gas Development Co., Ltd., Toho Earthtech Co., Ltd., Algorta Norte S.A., Deepwater Chemicals Inc., Calibre Chemicals Pvt. Ltd., Samrat Pharmachem Limited, Eskay Iodine Pvt. Ltd., Salvi Chemical Industries Ltd., Glide Chem Private Limited, Protochem Industries Pvt. Ltd., Ajay-SQM Group, Wengfu Group, Qingdao Bright Moon Seaweed Group |
Frequently Asked Questions
Ans: Europe dominated the Iodine Market in 2025.
Ans: The Organic Compounds segment dominated the Iodine Market in 2025.
Ans: Rising demand for iodine-based medical imaging and pharmaceutical applications accelerating global consumption growth.
Ans: The Iodine Market was valued at USD 3.69 billion in 2025.
Ans: The Iodine Market is expected to grow at a CAGR of 4.89% from 2026 to 2035.
Get in Touch
