Get more information on IP Intercom Market - Request Sample Report
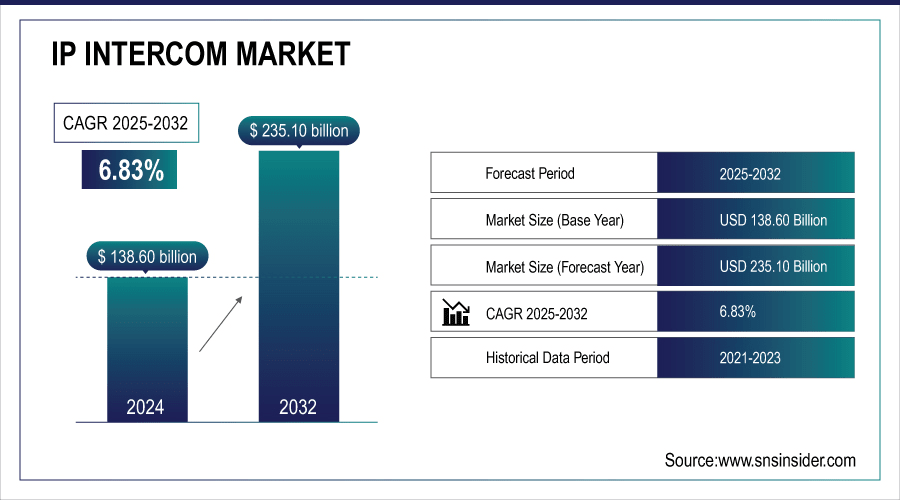
The IP Intercom Market size was valued at USD 2.04 Billion in 2023. It is estimated to reach USD 4.09 Billion by 2032, growing at a CAGR of 8.06% during 2024-2032.
The IP intercom market is quickly expanding within the communication and security sectors. The increasing need for improved connectivity, integration, and management of communication tools is driving this trend across various industry sectors. For instance, there has been a 10.6% CAGR by 2032 in the implementation of cutting-edge access control systems like biometrics and RFID in the industrial sector. A key benefit of an IP intercom is its ability to seamlessly integrate with various other IP-connected devices. IP intercoms can be integrated with other security sector solutions like surveillance cameras, access control systems, and home automation. Advancements in technology like cloud-based solutions and wireless communication are also contributing to the continued growth of the IP intercom market. Cloud-based intercom systems allow users to remotely manage and monitor security systems in various locations, providing convenience for overseeing them. Wireless IP intercoms make installation easier and more cost-effective in new and existing buildings by minimizing the need for extensive cabling.
The demand for IP intercom is driven by a variety of factors, including the growth of urbanization, the increasing need to ensure security in applications, and the further spread of smart cities. Due to a high concentration of population in urban areas, it becomes crucial for the management of both residential and commercial facilities. The IP intercom delivers real-time communication as well as convenient monitoring, which ensures safety in large-scale living environments, corporate campuses, Commercial, schools, and public facilities.
Drivers
Growing Demand for Security Systems in Residential and Commercial Sectors.
With the increasing importance of security, the need for IP intercom systems is growing in residential, commercial, and industrial sectors. One of the main factors contributing to this trend is the fast growth of urban areas in various regions worldwide, resulting in increased crime levels and the demand for efficient security measures. Security is now an essential need, particularly in busy urban areas with elevated crime rates. IP intercom systems are effective in managing access and improving security in residential and commercial buildings alike. These systems are much more sophisticated than traditional intercoms, providing video integration, high-quality audio, and connectivity to other smart devices. As smart homes and buildings are being utilized more, the incorporation of these systems into current infrastructure is becoming smoother.
Furthermore, with the growing importance of cybersecurity, IP intercom systems with encryption and secure communication protocols are becoming increasingly necessary. Government regulations and policies that promote or require strong security measures in both public and private infrastructure are increasing the growth of the IP intercom market.
Integration of IP Intercoms with Smart Home and IoT Ecosystems.
The increasing demand for IP intercoms is being fueled by the rise in popularity of smart homes and IoT devices. As connected devices become more common, consumers are more interested in finding ways to improve convenience, safety, and control. IP intercom systems are being connected with smart home devices like lights, door locks, thermostats, and even entertainment systems. The advancement of voice-activated helpers such as Amazon Alexa, Google Assistant, and Apple Siri has sped up this merger even more. These systems enable users to operate intercom features using voice commands, increasing the level of convenience. This integration not only improves user experience but also provides additional value through more effective management of home security and communications. Moreover, with the worldwide deployment of 5G networks, the IoT community will grow at a faster pace. This will enable IP intercom systems to take advantage of quicker data transfers, decreased delays, and improved connectivity. This technological development is expected to help boost the ongoing growth of the IP intercom market in residential and commercial settings.
Restraints
Internet Connectivity Dependency in Rural and Remote Areas.
IP intercoms require reliable and fast internet connections to work efficiently, unlike analog systems. In areas with weak or inadequate internet infrastructure, this reliance can pose a major constraint. Internet disruptions or slow speeds can affect IP intercom systems' performance in well-connected regions, potentially causing security risks. This limitation is particularly important for businesses or residents located in rural or remote areas where internet availability could be restricted or costly. In situations like these, the dependability of analog systems might be more important than the benefits of IP intercoms.
Technical Complexity and User Resistance of the Systems.
The advanced capabilities of IP intercom systems can be both beneficial and disadvantageous. Although these systems provide increased capabilities, they may present challenges in terms of installation and usage, especially for individuals lacking knowledge of contemporary technology. The complex nature of this technology can discourage certain users, such as older adults or small business owners, from utilizing IP intercom systems. Resistance from users towards new technologies is a frequent obstacle faced by many industries, including the IP intercom market. Certain users might choose the simplicity and familiarity of traditional analog systems, particularly if they do not need the advanced features provided by IP intercoms. The requirement for training or professional installation services can hinder the implementation of these systems, especially in residential settings.
By Type
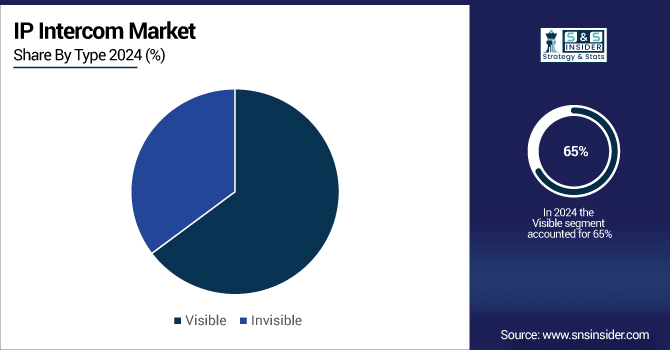
The visible IP intercom segment led the market in 2023 with a 55% market share. These systems are commonly utilized in residential, commercial, and industrial environments to improve security and convenience. Visual verification of individuals seeking access is the primary feature in areas such as apartments, offices, and gated communities. Enterprises like 2N and Axis Communications offer IP intercom solutions that are visible, combining video verification with access control. Their cameras are integrated into their systems, enabling features such as video doorbells and entry-point monitoring. The noticeable section is prominent because of its improved security measures and the need for video communication in different environments.
Invisible IP intercom systems are accounted to have a faster CAGR during 2023-2032. These systems are commonly used in settings where having minimal hardware is favored, like offices, healthcare buildings, and warehouses. Aiphone provides unobtrusive IP intercoms that prioritize clear voice quality and smooth compatibility with building management systems. The invisible sector is expanding quickly as it serves environments that require secure communication without visual confirmation, like industrial sites or cleanroom facilities where minimizing visual distractions is vital.
Need any customization research on IP Intercom Market - Enquiry Now
By Application
The commercial segment dominated in 2023 with a major market share of 41% because of the increasing demand for security and communication options in offices, shopping malls, hotels, and large commercial areas. As companies prioritize improving workplace security and productivity, IP intercom systems provide innovative functions such as video integration, remote accessibility, and smooth communication via networks. These systems are advantageous in office buildings, hotels, and retail spaces with heavy foot traffic for managing visitors and internal communication. For example, 2N Telecommunications offers intercom solutions for commercial properties and shopping centers.
The residential segment is expected to experience the fastest growth rate during the forecast period, fueled by the increasing popularity of smart homes and home automation. Rising knowledge regarding home security, along with the implementation of IP-based systems for controlling access, has driven the need for these systems in residential settings. Homeowners are looking for high-tech options like video surveillance, mobile app integration, and remote access, all of which can be found in IP intercoms. For instance, Siedle provides top-notch intercom systems made for houses, offering improved security and communication convenience for residents.
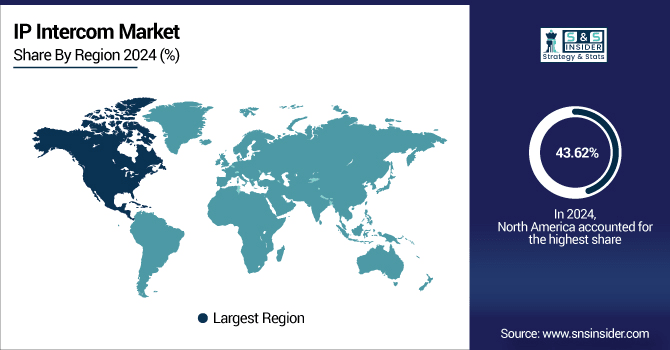
North America led the market with a 37% market share in 2023, due to its advanced technological infrastructure and high adoption rates in sectors such as security, healthcare, and corporate offices. The area's emphasis on smart houses and IoT-connected gadgets boosts the need for IP-centered communication systems. Moreover, the market is dominated by key players like Aiphone Corporation and Zenitel Group due to their strong presence. IP intercom systems are commonly used in business and residential properties for instant communication and security reasons. One common application of AiPhone’s IX Series IP-based intercom systems is in corporate offices and healthcare facilities, enhancing building security with smooth audio-visual communication.
Asia-Pacific is accounted to have a rapid growth rate during 2024-2032 in the IP Intercom Market due to fast urbanization, increased need for security solutions, and smart city initiatives supported by governments. China, India, and Japan have seen a rise in the use of IP intercom systems in residential, commercial, and industrial areas. 2N Telekomunikace and Comelit Group are prominent companies that are broadening their presence in the area. For example, Comelit's IP video intercoms are incorporated into housing developments, aiding in secure access management and communication.
The Major players are Axis Communications, Barix, AIPhone, TCS AG, Legrand, Panasonic, Commend, Comelit Group, TOA Corporation, Fermax, and Other Players.
September 2023: 2N has released the IP Style video intercom tailored to high-end residential and commercial facilities. The device has a sophisticated design, a smart touchscreen, full HD video, and complete smart integration with the access control system.
June 2023: Axis Communications developed its new IP Audio Intercom series that is focused on network audio and intercoms. The product is designed to enable secure communication in parking areas, entrance gates, and any public places out there.
March 2023: Hikvision has released the IP Villa Door Station that features the HD video intercom with Wi-Fi built to be installed in residential areas. The system can be synchronized with the company’s smart home solution and video surveillance devices.
Report Attributes | Details |
---|---|
Market Size in 2023 | USD 2.04 Billion |
Market Size by 2032 | USD 4.09 Billion |
CAGR | CAGR of 8.06% From 2024 to 2032 |
Base Year | 2023 |
Forecast Period | 2024-2032 |
Historical Data | 2020-2022 |
Report Scope & Coverage | Market Size, Segments Analysis, Competitive Landscape, Regional Analysis, DROC & SWOT Analysis, Forecast Outlook |
Key Segments | • By Type (Visible, Invisible) • By Application (Commercial, Government, Industrial, Residential, Others) |
Regional Analysis/Coverage | North America (US, Canada, Mexico), Europe (Eastern Europe [Poland, Romania, Hungary, Turkey, Rest of Eastern Europe] Western Europe] Germany, France, UK, Italy, Spain, Netherlands, Switzerland, Austria, Rest of Western Europe]), Asia Pacific (China, India, Japan, South Korea, Vietnam, Singapore, Australia, Rest of Asia Pacific), Middle East & Africa (Middle East [UAE, Egypt, Saudi Arabia, Qatar, Rest of Middle East], Africa [Nigeria, South Africa, Rest of Africa], Latin America (Brazil, Argentina, Colombia, Rest of Latin America) |
Company Profiles | Axis Communications, Barix, AIPhone, TCS AG, Legrand, Panasonic, Commend, Comelit Group, TOA Corporation, Fermax |
Key Drivers | • Growing Demand for Security Systems in Residential and Commercial Sectors. • Integration of IP Intercoms with Smart Home and IoT Ecosystems. |
Restraints | • Internet Connectivity Dependency in Rural and Remote Areas. • Technical Complexity and User Resistance of the Systems. |
Ans: The IP Intercom Market is expected to grow at a CAGR of 8.06% during 2024-2032.
Ans: IP Intercom Market size was USD 2.04 Billion in 2023 and is expected to Reach USD 4.09 Billion by 2032.
Ans: Growing demand for security systems in residential and commercial sectors is the major growth factor of the IP Intercom Market.
Ans: The visible segment dominated the IP Intercom Market.
Ans: North America dominated the IP Intercom Market in 2023.
Table of Content
1. Introduction
1.1 Market Definition
1.2 Scope (Inclusion and Exclusions)
1.3 Research Assumptions
2. Executive Summary
2.1 Market Overview
2.2 Regional Synopsis
2.3 Competitive Summary
3. Research Methodology
3.1 Top-Down Approach
3.2 Bottom-up Approach
3.3. Data Validation
3.4 Primary Interviews
4. Market Dynamics Impact Analysis
4.1 Market Driving Factors Analysis
4.1.2 Drivers
4.1.2 Restraints
4.1.3 Opportunities
4.1.4 Challenges
4.2 PESTLE Analysis
4.3 Porter’s Five Forces Model
5. Statistical Insights and Trends Reporting
5.1 Key Vendors and Feature Analysis, 2023
5.2 Performance Benchmarks, 2023
5.3 Integration Capabilities, by Software
5.4 Usage Statistics, 2023
6. Competitive Landscape
6.1 List of Major Companies, By Region
6.2 Market Share Analysis, By Region
6.3 Product Benchmarking
6.3.1 Product specifications and features
6.3.2 Pricing
6.4 Strategic Initiatives
6.4.1 Marketing and promotional activities
6.4.2 Distribution and supply chain strategies
6.4.3 Expansion plans and new product launches
6.4.4 Strategic partnerships and collaborations
6.5 Technological Advancements
6.6 Market Positioning and Branding
7. IP Intercom Market Segmentation, By Type
7.1 Chapter Overview
7.2 Visible
7.2.1 Visible Market Trends Analysis (2020-2032)
7.2.2 Visible Market Size Estimates and Forecasts to 2032 (USD Million)
7.3 Invisible
7.3.1 Invisible Market Trends Analysis (2020-2032)
7.3.2 Invisible Market Size Estimates and Forecasts to 2032 (USD Million)
8. IP Intercom Market Segmentation, By Application
8.1 Chapter Overview
8.2 Commercial
8.2.1 Commercial Market Trends Analysis (2020-2032)
8.2.2 Commercial Market Size Estimates and Forecasts to 2032 (USD Million)
8.3 Government
8.3.1 Government Market Trends Analysis (2020-2032)
8.3.2 Government Market Size Estimates and Forecasts to 2032 (USD Million)
8.4 Industrial
8.4.1 Industrial Market Trends Analysis (2020-2032)
8.4.2 Industrial Market Size Estimates and Forecasts to 2032 (USD Million)
8.5 Residential
8.5.1 Residential Market Trends Analysis (2020-2032)
8.5.2 Residential Market Size Estimates and Forecasts to 2032 (USD Million)
8.4 Other
8.4.1 Other Market Trends Analysis (2020-2032)
8.4.2 Other Market Size Estimates and Forecasts to 2032 (USD Million)
9. Regional Analysis
9.1 Chapter Overview
9.2 North America
9.2.1 Trends Analysis
9.2.2 North America IP Intercom Market Estimates and Forecasts, by Country (2020-2032) (USD Million)
9.2.3 North America IP Intercom Market Estimates and Forecasts, By Type (2020-2032) (USD Million)
9.2.4 North America IP Intercom Market Estimates and Forecasts, By Application (2020-2032) (USD Million)
9.2.5 USA
9.2.5.1 USA IP Intercom Market Estimates and Forecasts, By Type (2020-2032) (USD Million)
9.2.5.2 USA IP Intercom Market Estimates and Forecasts, By Application (2020-2032) (USD Million)
9.2.6 Canada
9.2.6.1 Canada IP Intercom Market Estimates and Forecasts, By Type (2020-2032) (USD Million)
9.2.6.2 Canada IP Intercom Market Estimates and Forecasts, By Application (2020-2032) (USD Million)
9.2.7 Mexico
9.2.7.1 Mexico IP Intercom Market Estimates and Forecasts, By Type (2020-2032) (USD Million)
9.2.7.2 Mexico IP Intercom Market Estimates and Forecasts, By Application (2020-2032) (USD Million)
9.3 Europe
9.3.1 Eastern Europe
9.3.1.1 Trends Analysis
9.3.1.2 Eastern Europe IP Intercom Market Estimates and Forecasts, by Country (2020-2032) (USD Million)
9.3.1.3 Eastern Europe IP Intercom Market Estimates and Forecasts, By Type (2020-2032) (USD Million)
9.3.1.4 Eastern Europe IP Intercom Market Estimates and Forecasts, By Application (2020-2032) (USD Million)
9.3.1.5 Poland
9.3.1.5.1 Poland IP Intercom Market Estimates and Forecasts, By Type (2020-2032) (USD Million)
9.3.1.5.2 Poland IP Intercom Market Estimates and Forecasts, By Application (2020-2032) (USD Million)
9.3.1.6 Romania
9.3.1.6.1 Romania IP Intercom Market Estimates and Forecasts, By Type (2020-2032) (USD Million)
9.3.1.6.2 Romania IP Intercom Market Estimates and Forecasts, By Application (2020-2032) (USD Million)
9.3.1.7 Hungary
9.3.1.7.1 Hungary IP Intercom Market Estimates and Forecasts, By Type (2020-2032) (USD Million)
9.3.1.7.2 Hungary IP Intercom Market Estimates and Forecasts, By Application (2020-2032) (USD Million)
9.3.1.8 Turkey
9.3.1.8.1 Turkey IP Intercom Market Estimates and Forecasts, By Type (2020-2032) (USD Million)
9.3.1.8.2 Turkey IP Intercom Market Estimates and Forecasts, By Application (2020-2032) (USD Million)
9.3.1.9 Rest of Eastern Europe
9.3.1.9.1 Rest of Eastern Europe IP Intercom Market Estimates and Forecasts, By Type (2020-2032) (USD Million)
9.3.1.9.2 Rest of Eastern Europe IP Intercom Market Estimates and Forecasts, By Application (2020-2032) (USD Million)
9.3.2 Western Europe
9.3.2.1 Trends Analysis
9.3.2.2 Western Europe IP Intercom Market Estimates and Forecasts, by Country (2020-2032) (USD Million)
9.3.2.3 Western Europe IP Intercom Market Estimates and Forecasts, By Type (2020-2032) (USD Million)
9.3.2.4 Western Europe IP Intercom Market Estimates and Forecasts, By Application (2020-2032) (USD Million)
9.3.2.5 Germany
9.3.2.5.1 Germany IP Intercom Market Estimates and Forecasts, By Type (2020-2032) (USD Million)
9.3.2.5.2 Germany IP Intercom Market Estimates and Forecasts, By Application (2020-2032) (USD Million)
9.3.2.6 France
9.3.2.6.1 France IP Intercom Market Estimates and Forecasts, By Type (2020-2032) (USD Million)
9.3.2.6.2 France IP Intercom Market Estimates and Forecasts, By Application (2020-2032) (USD Million)
9.3.2.7 UK
9.3.2.7.1 UK IP Intercom Market Estimates and Forecasts, By Type (2020-2032) (USD Million)
9.3.2.7.2 UK IP Intercom Market Estimates and Forecasts, By Application (2020-2032) (USD Million)
9.3.2.8 Italy
9.3.2.8.1 Italy IP Intercom Market Estimates and Forecasts, By Type (2020-2032) (USD Million)
9.3.2.8.2 Italy IP Intercom Market Estimates and Forecasts, By Application (2020-2032) (USD Million)
9.3.2.9 Spain
9.3.2.9.1 Spain IP Intercom Market Estimates and Forecasts, By Type (2020-2032) (USD Million)
9.3.2.9.2 Spain IP Intercom Market Estimates and Forecasts, By Application (2020-2032) (USD Million)
9.3.2.10 Netherlands
9.3.2.10.1 Netherlands IP Intercom Market Estimates and Forecasts, By Type (2020-2032) (USD Million)
9.3.2.10.2 Netherlands IP Intercom Market Estimates and Forecasts, By Application (2020-2032) (USD Million)
9.3.2.11 Switzerland
9.3.2.11.1 Switzerland IP Intercom Market Estimates and Forecasts, By Type (2020-2032) (USD Million)
9.3.2.11.2 Switzerland IP Intercom Market Estimates and Forecasts, By Application (2020-2032) (USD Million)
9.3.2.12 Austria
9.3.2.12.1 Austria IP Intercom Market Estimates and Forecasts, By Type (2020-2032) (USD Million)
9.3.2.12.2 Austria IP Intercom Market Estimates and Forecasts, By Application (2020-2032) (USD Million)
9.3.2.13 Rest of Western Europe
9.3.2.13.1 Rest of Western Europe IP Intercom Market Estimates and Forecasts, By Type (2020-2032) (USD Million)
9.3.2.13.2 Rest of Western Europe IP Intercom Market Estimates and Forecasts, By Application (2020-2032) (USD Million)
9.4 Asia Pacific
9.4.1 Trends Analysis
9.4.2 Asia-PacificIP Intercom Market Estimates and Forecasts, by Country (2020-2032) (USD Million)
9.4.3 Asia-PacificIP Intercom Market Estimates and Forecasts, By Type (2020-2032) (USD Million)
9.4.4 Asia-PacificIP Intercom Market Estimates and Forecasts, By Application (2020-2032) (USD Million)
9.4.5 China
9.4.5.1 China IP Intercom Market Estimates and Forecasts, By Type (2020-2032) (USD Million)
9.4.5.2 China IP Intercom Market Estimates and Forecasts, By Application (2020-2032) (USD Million)
9.4.6 India
9.4.5.1 India IP Intercom Market Estimates and Forecasts, By Type (2020-2032) (USD Million)
9.4.5.2 India IP Intercom Market Estimates and Forecasts, By Application (2020-2032) (USD Million)
9.4.5 Japan
9.4.5.1 Japan IP Intercom Market Estimates and Forecasts, By Type (2020-2032) (USD Million)
9.4.5.2 Japan IP Intercom Market Estimates and Forecasts, By Application (2020-2032) (USD Million)
9.4.6 South Korea
9.4.6.1 South Korea IP Intercom Market Estimates and Forecasts, By Type (2020-2032) (USD Million)
9.4.6.2 South Korea IP Intercom Market Estimates and Forecasts, By Application (2020-2032) (USD Million)
9.4.7 Vietnam
9.4.7.1 Vietnam IP Intercom Market Estimates and Forecasts, By Type (2020-2032) (USD Million)
9.2.7.2 Vietnam IP Intercom Market Estimates and Forecasts, By Application (2020-2032) (USD Million)
9.4.8 Singapore
9.4.8.1 Singapore IP Intercom Market Estimates and Forecasts, By Type (2020-2032) (USD Million)
9.4.8.2 Singapore IP Intercom Market Estimates and Forecasts, By Application (2020-2032) (USD Million)
9.4.9 Australia
9.4.9.1 Australia IP Intercom Market Estimates and Forecasts, By Type (2020-2032) (USD Million)
9.4.9.2 Australia IP Intercom Market Estimates and Forecasts, By Application (2020-2032) (USD Million)
9.4.10 Rest of Asia Pacific
9.4.10.1 Rest of Asia-PacificIP Intercom Market Estimates and Forecasts, By Type (2020-2032) (USD Million)
9.4.10.2 Rest of Asia-PacificIP Intercom Market Estimates and Forecasts, By Application (2020-2032) (USD Million)
9.5 Middle East and Africa
9.5.1 Middle East
9.5.1.1 Trends Analysis
9.5.1.2 Middle East IP Intercom Market Estimates and Forecasts, by Country (2020-2032) (USD Million)
9.5.1.3 Middle East IP Intercom Market Estimates and Forecasts, By Type (2020-2032) (USD Million)
9.5.1.4 Middle East IP Intercom Market Estimates and Forecasts, By Application (2020-2032) (USD Million)
9.5.1.5 UAE
9.5.1.5.1 UAE IP Intercom Market Estimates and Forecasts, By Type (2020-2032) (USD Million)
9.5.1.5.2 UAE IP Intercom Market Estimates and Forecasts, By Application (2020-2032) (USD Million)
9.5.1.6 Egypt
9.5.1.6.1 Egypt IP Intercom Market Estimates and Forecasts, By Type (2020-2032) (USD Million)
9.5.1.6.2 Egypt IP Intercom Market Estimates and Forecasts, By Application (2020-2032) (USD Million)
9.5.1.7 Saudi Arabia
9.5.1.7.1 Saudi Arabia IP Intercom Market Estimates and Forecasts, By Type (2020-2032) (USD Million)
9.5.1.7.2 Saudi Arabia IP Intercom Market Estimates and Forecasts, By Application (2020-2032) (USD Million)
9.5.1.8 Qatar
9.5.1.8.1 Qatar IP Intercom Market Estimates and Forecasts, By Type (2020-2032) (USD Million)
9.5.1.8.2 Qatar IP Intercom Market Estimates and Forecasts, By Application (2020-2032) (USD Million)
9.5.1.9 Rest of Middle East
9.5.1.9.1 Rest of Middle East IP Intercom Market Estimates and Forecasts, By Type (2020-2032) (USD Million)
9.5.1.9.2 Rest of Middle East IP Intercom Market Estimates and Forecasts, By Application (2020-2032) (USD Million)
9.5.2 Africa
9.5.2.1 Trends Analysis
9.5.2.2 Africa IP Intercom Market Estimates and Forecasts, by Country (2020-2032) (USD Million)
9.5.2.3 Africa IP Intercom Market Estimates and Forecasts, By Type (2020-2032) (USD Million)
9.5.2.4 Africa IP Intercom Market Estimates and Forecasts, By Application (2020-2032) (USD Million)
9.5.2.5 South Africa
9.5.2.5.1 South Africa IP Intercom Market Estimates and Forecasts, By Type (2020-2032) (USD Million)
9.5.2.5.2 South Africa IP Intercom Market Estimates and Forecasts, By Application (2020-2032) (USD Million)
9.5.2.6 Nigeria
9.5.2.6.1 Nigeria IP Intercom Market Estimates and Forecasts, By Type (2020-2032) (USD Million)
9.5.2.6.2 Nigeria IP Intercom Market Estimates and Forecasts, By Application (2020-2032) (USD Million)
9.5.2.7 Rest of Africa
9.5.2.7.1 Rest of Africa IP Intercom Market Estimates and Forecasts, by Component (2020-2032) (USD Million)
9.5.2.7.2 Rest of Africa IP Intercom Market Estimates and Forecasts, by Technology (2020-2032) (USD Million)
9.6 Latin America
9.6.1 Trends Analysis
9.6.2 Latin America IP Intercom Market Estimates and Forecasts, by Country (2020-2032) (USD Million)
9.6.3 Latin America IP Intercom Market Estimates and Forecasts, By Type (2020-2032) (USD Million)
9.6.4 Latin America IP Intercom Market Estimates and Forecasts, By Application (2020-2032) (USD Million)
9.6.5 Brazil
9.6.5.1 Brazil IP Intercom Market Estimates and Forecasts, By Type (2020-2032) (USD Million)
9.6.5.2 Brazil IP Intercom Market Estimates and Forecasts, By Application (2020-2032) (USD Million)
9.6.6 Argentina
9.6.6.1 Argentina IP Intercom Market Estimates and Forecasts, By Type (2020-2032) (USD Million)
9.6.6.2 Argentina IP Intercom Market Estimates and Forecasts, By Application (2020-2032) (USD Million)
9.6.7 Colombia
9.6.7.1 Colombia IP Intercom Market Estimates and Forecasts, By Type (2020-2032) (USD Million)
9.6.7.2 Colombia IP Intercom Market Estimates and Forecasts, By Application (2020-2032) (USD Million)
9.6.8 Rest of Latin America
9.6.8.1 Rest of Latin America IP Intercom Market Estimates and Forecasts, By Type (2020-2032) (USD Million)
9.6.8.2 Rest of Latin America IP Intercom Market Estimates and Forecasts, By Application (2020-2032) (USD Million)
10. Company Profiles
10.1 Axis Communications
10.1.1 Company Overview
10.1.2 Financial
10.1.3 Products/ Services Offered
110.1.4 SWOT Analysis
10.2 Barix
10.2.1 Company Overview
10.2.2 Financial
10.2.3 Products/ Services Offered
10.2.4 SWOT Analysis
10.3 AIPhone
10.3.1 Company Overview
10.3.2 Financial
10.3.3 Products/ Services Offered
10.3.4 SWOT Analysis
10.4 TCS AG
10.4.1 Company Overview
10.4.2 Financial
10.4.3 Products/ Services Offered
10.4.4 SWOT Analysis
10.5 Legrand
10.5.1 Company Overview
10.5.2 Financial
10.5.3 Products/ Services Offered
10.5.4 SWOT Analysis
10.6 Panasonic
10.6.1 Company Overview
10.6.2 Financial
10.6.3 Products/ Services Offered
10.6.4 SWOT Analysis
10.7 Commend
10.7.1 Company Overview
10.7.2 Financial
10.7.3 Products/ Services Offered
10.7.4 SWOT Analysis
10.8 Comelit Group
10.8.1 Company Overview
10.8.2 Financial
10.8.3 Products/ Services Offered
10.8.4 SWOT Analysis
10.9 TOA Corporation
10.9.1 Company Overview
10.9.2 Financial
10.9.3 Products/ Services Offered
10.9.4 SWOT Analysis
10.10 Fermax
10.9.1 Company Overview
10.9.2 Financial
10.9.3 Products/ Services Offered
10.9.4 SWOT Analysis
11. Use Cases and Best Practices
12. Conclusion
An accurate research report requires proper strategizing as well as implementation. There are multiple factors involved in the completion of good and accurate research report and selecting the best methodology to compete the research is the toughest part. Since the research reports we provide play a crucial role in any company’s decision-making process, therefore we at SNS Insider always believe that we should choose the best method which gives us results closer to reality. This allows us to reach at a stage wherein we can provide our clients best and accurate investment to output ratio.
Each report that we prepare takes a timeframe of 350-400 business hours for production. Starting from the selection of titles through a couple of in-depth brain storming session to the final QC process before uploading our titles on our website we dedicate around 350 working hours. The titles are selected based on their current market cap and the foreseen CAGR and growth.
The 5 steps process:
Step 1: Secondary Research:
Secondary Research or Desk Research is as the name suggests is a research process wherein, we collect data through the readily available information. In this process we use various paid and unpaid databases which our team has access to and gather data through the same. This includes examining of listed companies’ annual reports, Journals, SEC filling etc. Apart from this our team has access to various associations across the globe across different industries. Lastly, we have exchange relationships with various university as well as individual libraries.
Step 2: Primary Research
When we talk about primary research, it is a type of study in which the researchers collect relevant data samples directly, rather than relying on previously collected data. This type of research is focused on gaining content specific facts that can be sued to solve specific problems. Since the collected data is fresh and first hand therefore it makes the study more accurate and genuine.
We at SNS Insider have divided Primary Research into 2 parts.
Part 1 wherein we interview the KOLs of major players as well as the upcoming ones across various geographic regions. This allows us to have their view over the market scenario and acts as an important tool to come closer to the accurate market numbers. As many as 45 paid and unpaid primary interviews are taken from both the demand and supply side of the industry to make sure we land at an accurate judgement and analysis of the market.
This step involves the triangulation of data wherein our team analyses the interview transcripts, online survey responses and observation of on filed participants. The below mentioned chart should give a better understanding of the part 1 of the primary interview.
Part 2: In this part of primary research the data collected via secondary research and the part 1 of the primary research is validated with the interviews from individual consultants and subject matter experts.
Consultants are those set of people who have at least 12 years of experience and expertise within the industry whereas Subject Matter Experts are those with at least 15 years of experience behind their back within the same space. The data with the help of two main processes i.e., FGDs (Focused Group Discussions) and IDs (Individual Discussions). This gives us a 3rd party nonbiased primary view of the market scenario making it a more dependable one while collation of the data pointers.
Step 3: Data Bank Validation
Once all the information is collected via primary and secondary sources, we run that information for data validation. At our intelligence centre our research heads track a lot of information related to the market which includes the quarterly reports, the daily stock prices, and other relevant information. Our data bank server gets updated every fortnight and that is how the information which we collected using our primary and secondary information is revalidated in real time.
Step 4: QA/QC Process
After all the data collection and validation our team does a final level of quality check and quality assurance to get rid of any unwanted or undesired mistakes. This might include but not limited to getting rid of the any typos, duplication of numbers or missing of any important information. The people involved in this process include technical content writers, research heads and graphics people. Once this process is completed the title gets uploader on our platform for our clients to read it.
Step 5: Final QC/QA Process:
This is the last process and comes when the client has ordered the study. In this process a final QA/QC is done before the study is emailed to the client. Since we believe in giving our clients a good experience of our research studies, therefore, to make sure that we do not lack at our end in any way humanly possible we do a final round of quality check and then dispatch the study to the client.
By Type
Visible
Invisible
By Application
Commercial
Government
Industrial
Residential
Others
Request for Segment Customization as per your Business Requirement: Segment Customization Request
REGIONAL COVERAGE:
North America
US
Canada
Mexico
Europe
Eastern Europe
Poland
Romania
Hungary
Turkey
Rest of Eastern Europe
Western Europe
Germany
France
UK
Italy
Spain
Netherlands
Switzerland
Austria
Rest of Western Europe
Asia Pacific
China
India
Japan
South Korea
Vietnam
Singapore
Australia
Rest of Asia Pacific
Middle East & Africa
Middle East
UAE
Egypt
Saudi Arabia
Qatar
Rest of the Middle East
Africa
Nigeria
South Africa
Rest of Africa
Latin America
Brazil
Argentina
Colombia
Request for Country Level Research Report: Country Level Customization Request
Available Customization
With the given market data, SNS Insider offers customization as per the company’s specific needs. The following customization options are available for the report:
Product Analysis
Criss-Cross segment analysis (e.g. Product X Application)
Product Matrix which gives a detailed comparison of the product portfolio of each company
Geographic Analysis
Additional countries in any of the regions
Company Information
Detailed analysis and profiling of additional market players (Up to five)
The Silicon Photomultiplier Market size is expected to be valued at USD 138.09 Million in 2023. It is estimated to reach USD 274.43 Million by 2032, growing at a CAGR of 7.93% during 2024-2032.
Industrial Microscope Market size was valued at USD 1399 million in 2022 and is expected to grow to USD 2212.38 billion by 2030 and grow at a CAGR of 5.9% over the forecast period of 2023-2030
The 3D Display Market size was valued at USD 123.05 billion in 2023 and is expected to grow to USD 490.5 billion by 2031 and grow at a CAGR of 18.86% over the forecast period of 2024-2031.
The Industrial Barrier Systems Market was valued at USD 2.17 billion in 2023 and is projected to reach USD 3.98 billion by 2032, growing at a robust CAGR of 7.00% from 2024 to 2032.
The Operational Technology Market Size was valued at $168.95 billion in 2023 and is expected to reach $310.61 billion at 7.0% CAGR by forecasts 2024-2032
The Passive Optical Network Market Size was valued at USD 14.07 Billion in 2023 and is expected to reach USD 47.96 Billion by 2032 and grow at a CAGR of 14.6% over the forecast period 2024-2032.
Hi! Click one of our member below to chat on Phone