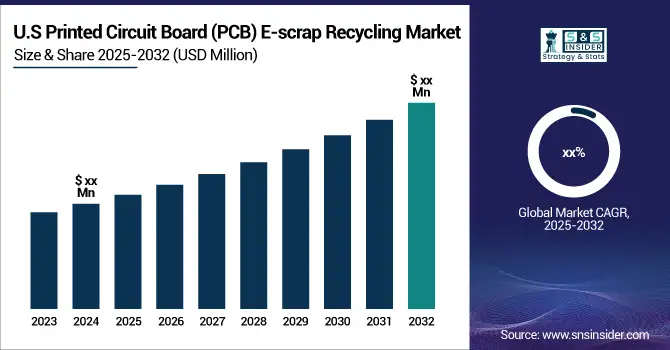
The Printed Circuit Board (PCB) E-scrap Recycling Market size was valued at USD 699.43 Million in 2024 and is projected to reach USD 1371.12 Million by 2032, growing at a CAGR of 8.78% during 2025-2032.
The Printed Circuit Board (PCB) e-scrap recycling market is experiencing significant growth due to the rapid rise in electronic waste and increasing demand for sustainable solutions. This growth is led by the robust electronics manufacturing and recycling facilities in particularly the APAC region. Innovations in recycling technologies, such as hydrometallurgy and biotechnology, enhance the recovery of metals and facilitate circular economy concepts. Although this business market is promising, some problems remain to be solved, such as the high cost of the facilities required and the difficulty of recycling valuable materials in a diverse range of PCB components and the lack of standard recycling methods. Conquering these barriers is a key factor in enhancing efficiency, raising profitability, and truly harnessing the potential of PCB e-scrap recycling in the years ahead.
TU Dresden scientists developed “Leaftronics” biodegradable circuit boards from magnolia leaves to tackle rising e-waste, with support from Germany’s EXIST program. With PCBs forming up to 60% of 62M tons of global e-waste (2022), these boards degrade within a month in compost.
Drivers:
Rising E-Waste and Metal Scarcity Driving Growth in PCB E-Scrap Recycling Market
The Printed Circuit Board (PCB) e-scrap recycling market is driven by the rising volume of electronic waste and the high concentration of valuable metals such as gold, silver, and copper in PCBs. Growing environmental regulations and social pressures are driving companies towards sustainable recycling practices that avoid landfill dumps and recycle precious materials. Increased focus on resource scarcity, as well as the advantages of a circular economy, will also drive demand for efficient recycling technologies. Furthermore the requirement of a consistent supply of strategic metal for electronic fabrication also drives the market, lowering the dependence on conventional mining process and reducing the environmental impact. All of these phenomena contribute to invest and develop PCB e-scrap treatment approaches.
MTM Critical Metals achieved ultra-high-grade gold recovery at 551 g/t, silver at 2,804 g/t, and copper at 42%, with over 95% recovery rates for gold and titanium, and over 90% for silver, tin, and zinc. They secured a five-year e-waste supply agreement with a minimum of 700 tonnes per annum, targeting around 800 tonnes yearly.
Restraints:
Impact of Inconsistent Regulatory Frameworks Leading to Operational Challenges in PCB E-Scrap Recycling
Inconsistent regulatory frameworks across different regions create significant challenges for PCB e-scrap recycling operations. The absence of uniform global guidelines has recyclers processing different environmental rules and regulatory baselines that can be quite complex. This patchwork of regulations adds unnecessary complexity to operations, compelling companies to continuously adjust operations to meet local requirements, which leads to higher costs and impedes scaling. Furthermore, inconsistent laws bring legal uncertainties as well as higher penalties for non-compliance. Such an environment is counterproductive to investments and innovating recycling technologies and undermines the efficiency of and wide dissemination of environmentally sound PCB e-waste handling. In order to address these problems, harmonized regulations and clear guidance is required in order to help create a stable and growth encouraging market.
Opportunities:
Increasing E-Waste Generation and Regulatory Pressure Expanding PCB E-Scrap Recycling Markets
The increasing volume of electronic waste worldwide offers significant growth opportunities for the PCB e-scrap recycling market. Efficient recycling technology is in greater demand as implementation of waste rules and sustainability targets becomes more rigorous on global markets. Now, fast-growing economies with a rapidly expanding digital adoption have churned out more and more e-waste, creating new markets for recycling. Besides, the development of processes aiming to enhance both the recovery of metals and recycling can also fall into the economic dimension. Circular economy will be led so that manufacturers and recyclers have to work more closely to facilitate the return of materials – that will mean we will see investment and innovation. Furthermore, companies specialised in green certifications and low carbon footprints generate competitive advantages. All these factors combined provided a suitable base for the development of PCB e-scrap recycling plants around the world.
SGS certification Korea Zinc’s Onsan Smelter was certified by SGS for the production of copper products made from 100% Zn, lead byproducts and PCBs instead of new copper concentrate. The firm, aiming to enlarge its production of copper by mid-2025, stands by its green, low-carbon manufacturing.
Challenges:
Complex Regulatory Variations Lead to Higher Costs and Operational Difficulties in PCB E-Scrap Recycling
Regulatory compliance complexity poses a significant challenge for Printed Circuit Board (PCB) e-scrap recycling due to the inconsistent and often fragmented environmental laws across different regions and countries. These decentralized local and international rules create a patchwork that makes it hard for recyclers comply. This heterogeneity raises the burden of making business at European level, because companies have to tailor their procedures to comply with different legal requirements and therefore incur additional administrative and compliance costs. In addition, the absence of common guidelines prevents the implementation of more cost-effective and homogeneous recycling activities. As such recyclers have increased exposure to penalties from non-compliance, operations downtime and decreased margins. Clearing these regulatory roadblocks is important to simplify recycling and support sound e-waste management worldwide.
By Type
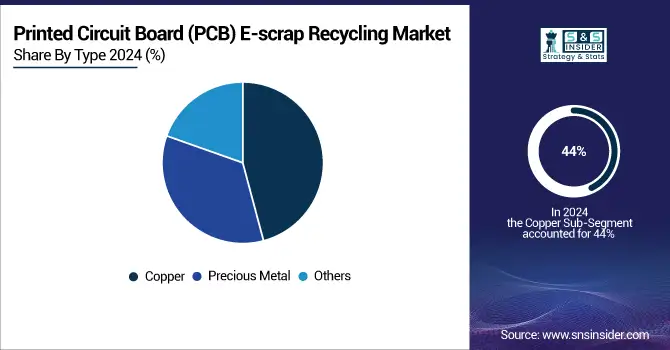
The Copper segment held a dominant Printed Circuit Board (PCB) E-scrap Recycling market share of around 44% in 2024, owing to the fact that it is an indispensable part of electronic components and has high recycle value. Increase in the price of virgin copper, concern for environment and the progression in the process technology to recover copper economically from e- waste has led to an increase in the reclamation of copper from e-waste. This growing demand supports sustainable management of resources and also minimizes reliance on conventional mining operations, thereby benefitting market growth.
The Precious Metal segment is expected to experience the fastest growth in the Printed Circuit Board (PCB) E-scrap Recycling market over 2025-2032 with CAGR 10.85%, due to high requirement for expensive metals such as gold, silver and palladium in electronics production. The recovery and re-use of precious metals from PCB e-scrap are also fueled by growing metal scarcity, increasing metal prices, and emphasis on sustainable recycling.
By Application
Smartphones segment held a dominant Printed Circuit Board (PCB) E-scrap Recycling market share of around 36% in 2024 and is projected to experience fastest growth in the market during 2025-2032, at a CAGR of 9.88%. This growth is fueled by the fast-paced smartphone replacement cycle, driven by technological advancements, consumer preferences for upgraded models, and the surge in mobile connectivity. Additionally, the high concentration of precious and rare metals in smartphone PCBs enhances recycling profitability, encouraging both manufacturers and recyclers to expand sustainable e-waste processing practices.
By Source Types
IT and Telecommunication Products segment held a dominant Printed Circuit Board (PCB) E-scrap Recycling market share of around 52% in 2024 and is projected to experience fastest growth in the market during 2025-2032, at a CAGR of 9.44%. This strong growth is fueled by the rapid digitization of economies, the proliferation of connected devices, and rising investments in cloud computing and 5G infrastructure. As organizations upgrade legacy systems and replace obsolete IT hardware, a growing volume of discarded PCBs becomes available for recycling, presenting opportunities to recover valuable metals and support sustainability efforts.
In 2024, the Asia Pacific dominated the Printed Circuit Board (PCB) E-scrap Recycling market and accounted for 44% of revenue share, due to its rapidly growing electronics manufacturing sector, rising volume of e-waste production, and supportive government programs encouraging the development of e-waste recycling infrastructure and environmentally responsible behaviors
In Asia Pacific, China leads the Printed Circuit Board (PCB) E-scrap Recycling market, owing to presence of large electronics manufacturing bodies and high e-waste generation.
North America is projected to register the fastest CAGR of 8.25% during 2025-2032, driven by stringent environmental regulations, rising e-waste volumes, and increasing awareness about sustainable recycling. The region's robust technological infrastructure and growing adoption of advanced recycling methods further fuel market expansion and investment in PCB e-scrap recycling facilities.
The U.S. holds the largest share in the Printed Circuit Board (PCB) E-scrap Recycling market market, due to high e-waste generation and strong recycling infrastructure.
In 2024, Europe emerged as a promising region in the Printed Circuit Board (PCB) E-scrap Recycling market , driven by rigorous environmental regulations, strong governmental support for circular economy practices and growing consumer and industrial awareness regarding sustainable e-waste disposal, which accelerated the investment into the advanced recycling technologies and complementing infrastructure in the region.
LATAM and MEA is experiencing steady growth in the Printed Circuit Board (PCB) E-scrap Recycling market, is also growing steadily due to growing e-waste generation, burgeoning urbanization and rising electronic devices penetration. Efforts from governments to manage waste sustainably and growth in recycling infrastructure are contributing further the expansion of the market in these regions.
The Printed Circuit Board (PCB) E-scrap Recycling companies are Umicore, Mitsubishi Materials Corporation, Aurubis AG, Glencore, DOWA Holdings Co., Ltd., Boliden Group, JX Nippon Mining & Metals Corporation, Elemental Holding S.A., Interco Trading, Inc., Kuusakoski Group and Others
In June 2024, Aurubis AG installed a fully automated scrap sampling system at its Lünen, Germany plant, cutting sample preparation from five days to one hour. The USD 6 million investment enhances process security, transparency, and sustainability, with plans to expand the technology to other global sites.
Report Attributes | Details |
Market Size in 2024 | USD 699.43 Million |
Market Size by 2032 | USD 1371.12 Million |
CAGR | CAGR of 8.78% From 2025 to 2032 |
Base Year | 2024 |
Forecast Period | 2025-2032 |
Historical Data | 2021-2023 |
Report Scope & Coverage | Market Size, Segments Analysis, Competitive Landscape, Regional Analysis, DROC & SWOT Analysis, Forecast Outlook |
Key Segments | • By Type (Precious Metal, Copper and Others) • By Application (Smartphones,PC & Laptop, Telecommunications, TV & Monitor and Others) • By Source Type (Household Appliances, IT and Telecommunication Products and Entertainment Devices) |
Regional Analysis/Coverage | North America (US, Canada, Mexico), Europe (Germany, France, UK, Italy, Spain, Poland, Turkey, Rest of Europe), Asia Pacific (China, India, Japan, South Korea, Singapore, Australia, Taiwan, Rest of Asia Pacific), Middle East & Africa (UAE, Saudi Arabia, Qatar, South Africa, Rest of Middle East & Africa), Latin America (Brazil, Argentina, Rest of Latin America) |
Company Profiles | The Printed Circuit Board (PCB) E-scrap Recycling companies are Umicore, Mitsubishi Materials Corporation, Aurubis AG, Glencore, DOWA Holdings Co., Ltd., Boliden Group, JX Nippon Mining & Metals Corporation, Elemental Holding S.A., Interco Trading, Inc., Kuusakoski Group and Others |
Ans: The Printed Circuit Board (PCB) E-scrap Recycling Market is expected to grow at a CAGR of 8.78% during 2025-2032.
Ans: The Printed Circuit Board (PCB) E-scrap Recycling was USD 699.43 Million in 2024 and is expected to Reach USD 1371.12 Million by 2032.
Ans: Key drivers of the Printed Circuit Board (PCB) E-scrap Recycling Market include rising chip demand, AI and IoT adoption, and advanced manufacturing needs.
Ans: The “Copper” segment dominated the Printed Circuit Board (PCB) E-scrap Recycling Market.
Ans: Asia-Pacific dominated the Printed Circuit Board (PCB) E-scrap Recycling Market in 2024.
Table of Contents
1. Introduction
1.1 Market Definition
1.2 Scope (Inclusion and Exclusions)
1.3 Research Assumptions
2. Executive Summary
2.1 Market Overview
2.2 Regional Synopsis
2.3 Competitive Summary
3. Research Methodology
3.1 Top-Down Approach
3.2 Bottom-up Approach
3.3. Data Validation
3.4 Primary Interviews
4. Market Dynamics Impact Analysis
4.1 Market Driving Factors Analysis
4.1.1 Drivers
4.1.2 Restraints
4.1.3 Opportunities
4.1.4 Challenges
4.2 PESTLE Analysis
4.3 Porter’s Five Forces Model
5. Statistical Insights and Trends Reporting
5.1 Technological Adoption Trends
5.2 E-scrap Generation and Collection Rates
5.3 Compliance and Regulatory Metrics
5.4 Deployment Model Preferences in IDaaS (Cloud vs. Hybrid vs. On-Premise)
6. Competitive Landscape
6.1 List of Major Companies, By Region
6.2 Market Share Analysis, By Region
6.3 Product Benchmarking
6.3.1 Product specifications and features
6.3.2 Pricing
6.4 Strategic Initiatives
6.4.1 Marketing and promotional activities
6.4.2 Distribution and Supply Chain Strategies
6.4.3 Expansion plans and new Product launches
6.4.4 Strategic partnerships and collaborations
6.5 Technological Advancements
6.6 Market Positioning and Branding
7. Printed Circuit Board (PCB) E-scrap Recycling Market Segmentation By Type
7.1 Chapter Overview
7.2 Precious Metal
7.2.1 Precious Metal Market Trends Analysis (2021-2032)
7.2.2 Precious Metal Market Size Estimates and Forecasts to 2032 (USD Billion)
7.3 Copper
7.3.1 Copper Market Trends Analysis (2021-2032)
7.3.2 Copper Market Size Estimates and Forecasts to 2032 (USD Billion)
7.4 Others
7.4.1 Others Market Trends Analysis (2021-2032)
7.4.2 Others Market Size Estimates and Forecasts to 2032 (USD Billion)
8. Printed Circuit Board (PCB) E-scrap Recycling Market Segmentation By Application
8.1 Chapter Overview
8.2 Smartphones
8.2.1 Smartphones Market Trend Analysis (2021-2032)
8.2.2 Smartphones Market Size Estimates and Forecasts to 2032 (USD Billion)
8.3 PC & Laptop
8.3.1 PC & Laptop Market Trends Analysis (2021-2032)
8.3.2 PC & Laptop Market Size Estimates and Forecasts to 2032 (USD Billion)
8.3 Telecommunications
8.3.1 Telecommunications Market Trends Analysis (2021-2032)
8.3.2 Telecommunications Market Size Estimates and Forecasts to 2032 (USD Billion)
8.4 TV & Monitor
8.4.1 TV & Monitor Market Trends Analysis (2021-2032)
8.4.2 TV & Monitor Market Size Estimates and Forecasts to 2032 (USD Billion)
8.5 Others
8.5.1 Others Market Trends Analysis (2021-2032)
8.5.2 Others Market Size Estimates and Forecasts to 2032 (USD Billion)
9. Printed Circuit Board (PCB) E-scrap Recycling Market Segmentation By Source Type
9.1 Chapter Overview
9.2 Household Appliances
9.2.1 Household Appliances Market Trends Analysis (2021-2032)
9.2.2 Household Appliances Market Size Estimates and Forecasts to 2032 (USD Billion)
9.3 IT and Telecommunication Products
9.3.1 IT and Telecommunication Products Market Trends Analysis (2021-2032)
9.3.2 IT and Telecommunication Products Market Size Estimates and Forecasts to 2032 (USD Billion)
9.4 Entertainment Devices
9.4.1 Entertainment Devices Market Trends Analysis (2021-2032)
9.4.2 Entertainment Devices Market Size Estimates and Forecasts to 2032 (USD Billion)
10. Regional Analysis
10.1 Chapter Overview
10.2 North America
10.2.1 Trends Analysis
10.2.2 North America Printed Circuit Board (PCB) E-scrap Recycling Market Estimates and Forecasts, by Country (2021-2032) (USD Billion)
10.2.3 North America Printed Circuit Board (PCB) E-scrap Recycling Market Estimates and Forecasts, By Type (2021-2032) (USD Billion)
10.2.4 North America Printed Circuit Board (PCB) E-scrap Recycling Market Estimates and Forecasts, By Application (2021-2032) (USD Billion)
10.2.5 North America Printed Circuit Board (PCB) E-scrap Recycling Market Estimates and Forecasts, By Source Type (2021-2032) (USD Billion)
10.2.6 USA
10.2.6.1 USA Printed Circuit Board (PCB) E-scrap Recycling Market Estimates and Forecasts, By Type (2021-2032) (USD Billion)
10.2.6.2 USA Printed Circuit Board (PCB) E-scrap Recycling Market Estimates and Forecasts, By Application (2021-2032) (USD Billion)
10.2.6.3 USA Printed Circuit Board (PCB) E-scrap Recycling Market Estimates and Forecasts, By Source Type (2021-2032) (USD Billion)
10.2.7 Canada
10.2.7.1 Canada Printed Circuit Board (PCB) E-scrap Recycling Market Estimates and Forecasts, By Type (2021-2032) (USD Billion)
10.2.7.2 Canada Printed Circuit Board (PCB) E-scrap Recycling Market Estimates and Forecasts, By Application (2021-2032) (USD Billion)
10.2.7.3 Canada Printed Circuit Board (PCB) E-scrap Recycling Market Estimates and Forecasts, By Source Type (2021-2032) (USD Billion)
10.2.8 Mexico
10.2.8.1 Mexico Printed Circuit Board (PCB) E-scrap Recycling Market Estimates and Forecasts, By Type (2021-2032) (USD Billion)
10.2.8.2 Mexico Printed Circuit Board (PCB) E-scrap Recycling Market Estimates and Forecasts, By Application (2021-2032) (USD Billion)
10.2.8.3 Mexico Printed Circuit Board (PCB) E-scrap Recycling Market Estimates and Forecasts, By Source Type (2021-2032) (USD Billion)
10.3 Europe
10.3.1 Trends Analysis
10.3.2 Europe Printed Circuit Board (PCB) E-scrap Recycling Market Estimates and Forecasts, by Country (2021-2032) (USD Billion)
10.3.3 Europe Printed Circuit Board (PCB) E-scrap Recycling Market Estimates and Forecasts, By Type (2021-2032) (USD Billion)
10.3.4 Europe Printed Circuit Board (PCB) E-scrap Recycling Market Estimates and Forecasts, By Application (2021-2032) (USD Billion)
10.3.5 Europe Printed Circuit Board (PCB) E-scrap Recycling Market Estimates and Forecasts, By Source Type (2021-2032) (USD Billion)
10.3.6 Germany
10.3.1.6.1 Germany Printed Circuit Board (PCB) E-scrap Recycling Market Estimates and Forecasts, By Type (2021-2032) (USD Billion)
10.3.1.6.2 Germany Printed Circuit Board (PCB) E-scrap Recycling Market Estimates and Forecasts, By Application (2021-2032) (USD Billion)
10.3.1.6.3 Germany Printed Circuit Board (PCB) E-scrap Recycling Market Estimates and Forecasts, By Source Type (2021-2032) (USD Billion)
10.3.7 France
10.3.7.1 France Printed Circuit Board (PCB) E-scrap Recycling Market Estimates and Forecasts, By Type (2021-2032) (USD Billion)
10.3.7.2 France a Printed Circuit Board (PCB) E-scrap Recycling Market Estimates and Forecasts, By Application (2021-2032) (USD Billion)
10.3.7.3 France Printed Circuit Board (PCB) E-scrap Recycling Market Estimates and Forecasts, By Source Type (2021-2032) (USD Billion)
10.3.8 UK
10.3.8.1 UK Printed Circuit Board (PCB) E-scrap Recycling Market Estimates and Forecasts, By Type (2021-2032) (USD Billion)
10.3.8.2 UK Printed Circuit Board (PCB) E-scrap Recycling Market Estimates and Forecasts, By Application (2021-2032) (USD Billion)
10.3.8.3 UK Printed Circuit Board (PCB) E-scrap Recycling Market Estimates and Forecasts, By Source Type (2021-2032) (USD Billion)
10.3.9 Italy
10.3.9.1 Italy Printed Circuit Board (PCB) E-scrap Recycling Market Estimates and Forecasts, By Type (2021-2032) (USD Billion)
10.3.9.2 Italy Printed Circuit Board (PCB) E-scrap Recycling Market Estimates and Forecasts, By Application (2021-2032) (USD Billion)
10.3.9.3 Italy Printed Circuit Board (PCB) E-scrap Recycling Market Estimates and Forecasts, By Source Type (2021-2032) (USD Billion)
10.3.10 Spain
10.3.10.1 Spain Printed Circuit Board (PCB) E-scrap Recycling Market Estimates and Forecasts, By Type (2021-2032) (USD Billion)
10.3.10.2 Spain Printed Circuit Board (PCB) E-scrap Recycling Market Estimates and Forecasts, By Application (2021-2032) (USD Billion)
10.3.10.3 Spain Printed Circuit Board (PCB) E-scrap Recycling Market Estimates and Forecasts, By Source Type (2021-2032) (USD Billion)
10.3.12 Poland
10.3.12.1 Poland Printed Circuit Board (PCB) E-scrap Recycling Market Estimates and Forecasts, by Country (2021-2032) (USD Billion)
10.3.12.1 Poland Printed Circuit Board (PCB) E-scrap Recycling Market Estimates and Forecasts, By Type (2021-2032) (USD Billion)
10.3.12.3 Poland Printed Circuit Board (PCB) E-scrap Recycling Market Estimates and Forecasts, By Application (2021-2032) (USD Billion)
10.3.12.3 Poland Printed Circuit Board (PCB) E-scrap Recycling Market Estimates and Forecasts, By Source Type (2021-2032) (USD Billion)
10.3.13 Turkey
10.3.13.1 Turkey Printed Circuit Board (PCB) E-scrap Recycling Market Estimates and Forecasts, By Type (2021-2032) (USD Billion)
10.3.13.2 Turkey Printed Circuit Board (PCB) E-scrap Recycling Market Estimates and Forecasts, By Application (2021-2032) (USD Billion)
10.3.13.3 Turkey Printed Circuit Board (PCB) E-scrap Recycling Market Estimates and Forecasts, By Source Type (2021-2032) (USD Billion)
10.3.14 Rest of Europe
10.3.14.1 Rest of Europe Printed Circuit Board (PCB) E-scrap Recycling Market Estimates and Forecasts, By Type (2021-2032) (USD Billion)
10.3.14.2 Rest of Europe Printed Circuit Board (PCB) E-scrap Recycling Market Estimates and Forecasts, By Application (2021-2032) (USD Billion)
10.3.14.3 Rest of Europe Printed Circuit Board (PCB) E-scrap Recycling Market Estimates and Forecasts, By Source Type (2021-2032) (USD Billion)
10.4 Asia-Pacific
10.4.1 Trends Analysis
10.4.2 Asia-Pacific Printed Circuit Board (PCB) E-scrap Recycling Market Estimates and Forecasts, by Country (2021-2032) (USD Billion)
10.4.3 Asia-Pacific Printed Circuit Board (PCB) E-scrap Recycling Market Estimates and Forecasts, By Type (2021-2032) (USD Billion)
10.4.4 Asia-Pacific Printed Circuit Board (PCB) E-scrap Recycling Market Estimates and Forecasts, By Application (2021-2032) (USD Billion)
10.4.5 Asia-Pacific Printed Circuit Board (PCB) E-scrap Recycling Market Estimates and Forecasts, By Source Type (2021-2032) (USD Billion)
10.4.6 China
10.4.6.1 China Printed Circuit Board (PCB) E-scrap Recycling Market Estimates and Forecasts, By Type (2021-2032) (USD Billion)
10.4.6.2 China Printed Circuit Board (PCB) E-scrap Recycling Market Estimates and Forecasts, By Application (2021-2032) (USD Billion)
10.4.6.3 China Printed Circuit Board (PCB) E-scrap Recycling Market Estimates and Forecasts, By Source Type (2021-2032) (USD Billion)
10.4.7 India
10.4.7.1 India Printed Circuit Board (PCB) E-scrap Recycling Market Estimates and Forecasts, By Type (2021-2032) (USD Billion)
10.4.7.2 India Printed Circuit Board (PCB) E-scrap Recycling Market Estimates and Forecasts, By Application (2021-2032) (USD Billion)
10.4.7.3 India Printed Circuit Board (PCB) E-scrap Recycling Market Estimates and Forecasts, By Source Type (2021-2032) (USD Billion)
10.4.8 Japan
10.4.8.1 Japan Printed Circuit Board (PCB) E-scrap Recycling Market Estimates and Forecasts, By Type (2021-2032) (USD Billion)
10.4.8.2 Japan Printed Circuit Board (PCB) E-scrap Recycling Market Estimates and Forecasts, By Application (2021-2032) (USD Billion)
10.4.8.3 Japan Printed Circuit Board (PCB) E-scrap Recycling Market Estimates and Forecasts, By Source Type (2021-2032) (USD Billion)
10.4.9 South Korea
10.4.9.1 South Korea Printed Circuit Board (PCB) E-scrap Recycling Market Estimates and Forecasts, By Type (2021-2032) (USD Billion)
10.4.9.2 South Korea Printed Circuit Board (PCB) E-scrap Recycling Market Estimates and Forecasts, By Application (2021-2032) (USD Billion)
10.4.9.3 South Korea Printed Circuit Board (PCB) E-scrap Recycling Market Estimates and Forecasts, By Source Type (2021-2032) (USD Billion)
10.4.10 Singapore
10.4.10.1 Singapore Printed Circuit Board (PCB) E-scrap Recycling Market Estimates and Forecasts, By Type (2021-2032) (USD Billion)
10.4.10.2 Singapore Printed Circuit Board (PCB) E-scrap Recycling Market Estimates and Forecasts, By Application (2021-2032) (USD Billion)
10.4.10.3 Singapore Printed Circuit Board (PCB) E-scrap Recycling Market Estimates and Forecasts, By Source Type (2021-2032) (USD Billion)
10.4.11 Australia
10.4.11.1 Australia Printed Circuit Board (PCB) E-scrap Recycling Market Estimates and Forecasts, By Type (2021-2032) (USD Billion)
10.4.11.2 Australia Printed Circuit Board (PCB) E-scrap Recycling Market Estimates and Forecasts, By Application (2021-2032) (USD Billion)
10.4.11.3 Australia Printed Circuit Board (PCB) E-scrap Recycling Market Estimates and Forecasts, By Source Type (2021-2032) (USD Billion)
10.4.12 Taiwan
10.4.12.1 Taiwan Printed Circuit Board (PCB) E-scrap Recycling Market Estimates and Forecasts, By Type (2021-2032) (USD Billion)
10.4.12.2 Taiwan Printed Circuit Board (PCB) E-scrap Recycling Market Estimates and Forecasts, By Application (2021-2032) (USD Billion)
10.4.12.3 Taiwan Printed Circuit Board (PCB) E-scrap Recycling Market Estimates and Forecasts, By Source Type (2021-2032) (USD Billion)
10.4.13 Rest of Asia-Pacific
10.4.13.1 Rest of Asia-Pacific Printed Circuit Board (PCB) E-scrap Recycling Market Estimates and Forecasts, By Type (2021-2032) (USD Billion)
10.4.13.2 Rest of Asia-Pacific Printed Circuit Board (PCB) E-scrap Recycling Market Estimates and Forecasts, By Application (2021-2032) (USD Billion)
10.4.13.3 Rest of Asia-Pacific Printed Circuit Board (PCB) E-scrap Recycling Market Estimates and Forecasts, By Source Type (2021-2032) (USD Billion)
10.5 Middle East and Africa
10.5.1 Trends Analysis
10.5.2 Middle East and Africa East Printed Circuit Board (PCB) E-scrap Recycling Market Estimates and Forecasts, by Country (2021-2032) (USD Billion)
10.5.3Middle East and Africa Printed Circuit Board (PCB) E-scrap Recycling Market Estimates and Forecasts, By Type (2021-2032) (USD Billion)
10.5.4 Middle East and Africa Printed Circuit Board (PCB) E-scrap Recycling Market Estimates and Forecasts, By Application (2021-2032) (USD Billion)
10.5.5 Middle East and Africa Printed Circuit Board (PCB) E-scrap Recycling Market Estimates and Forecasts, By Source Type (2021-2032) (USD Billion)
10.5.6 UAE
10.5.6.1 UAE Printed Circuit Board (PCB) E-scrap Recycling Market Estimates and Forecasts, By Type (2021-2032) (USD Billion)
10.5.6.2 UAE Printed Circuit Board (PCB) E-scrap Recycling Market Estimates and Forecasts, By Application (2021-2032) (USD Billion)
10.5.6.3 UAE Printed Circuit Board (PCB) E-scrap Recycling Market Estimates and Forecasts, By Source Type (2021-2032) (USD Billion)
10.5.7 Saudi Arabia
10.5.7.1 Saudi Arabia Printed Circuit Board (PCB) E-scrap Recycling Market Estimates and Forecasts, By Type (2021-2032) (USD Billion)
10.5.7.2 Saudi Arabia Printed Circuit Board (PCB) E-scrap Recycling Market Estimates and Forecasts, By Application (2021-2032) (USD Billion)
10.5.7.3 Saudi Arabia Printed Circuit Board (PCB) E-scrap Recycling Market Estimates and Forecasts, By Source Type (2021-2032) (USD Billion)
10.5.8 Qatar
10.5.8.1 Qatar Printed Circuit Board (PCB) E-scrap Recycling Market Estimates and Forecasts, By Type (2021-2032) (USD Billion)
10.5.8.2 Qatar Printed Circuit Board (PCB) E-scrap Recycling Market Estimates and Forecasts, By Application (2021-2032) (USD Billion)
10.5.8.3 Qatar Printed Circuit Board (PCB) E-scrap Recycling Market Estimates and Forecasts, By Source Type (2021-2032) (USD Billion)
10.5.9 South Africa
10.5.9 1 South Africa Printed Circuit Board (PCB) E-scrap Recycling Market Estimates and Forecasts, By Type (2021-2032) (USD Billion)
10.5.9 2 South Africa Printed Circuit Board (PCB) E-scrap Recycling Market Estimates and Forecasts By Application (2021-2032) (USD Billion)
10.5.9 3 South Africa Printed Circuit Board (PCB) E-scrap Recycling Market Estimates and Forecasts, By Source Type (2021-2032) (USD Billion)
10.5.10 Rest of Middle East & Africa
10.5.10.1 Rest of Middle East & Africa Printed Circuit Board (PCB) E-scrap Recycling Market Estimates and Forecasts, By Type (2021-2032) (USD Billion)
10.5.10.2 Rest of Middle East & Africa Printed Circuit Board (PCB) E-scrap Recycling Market Estimates and Forecasts, By Application (2021-2032) (USD Billion)
10.5.10.3 Rest of Middle East & Africa Printed Circuit Board (PCB) E-scrap Recycling Market Estimates and Forecasts, By Source Type (2021-2032) (USD Billion)
10.6 Latin America
10.6.1 Trends Analysis
10.6.2 Latin America Printed Circuit Board (PCB) E-scrap Recycling Market Estimates and Forecasts, by Country (2021-2032) (USD Billion)
10.6.3 Latin America Printed Circuit Board (PCB) E-scrap Recycling Market Estimates and Forecasts, By Type (2021-2032) (USD Billion)
10.6.4 Latin America Printed Circuit Board (PCB) E-scrap Recycling Market Estimates and Forecasts, By Application (2021-2032) (USD Billion)
10.6.5 Latin America Printed Circuit Board (PCB) E-scrap Recycling Market Estimates and Forecasts, By Source Type (2021-2032) (USD Billion)
10.6.6 Brazil
10.6.6.1 Brazil Printed Circuit Board (PCB) E-scrap Recycling Market Estimates and Forecasts, By Type (2021-2032) (USD Billion)
10.6.6.2 Brazil Printed Circuit Board (PCB) E-scrap Recycling Market Estimates and Forecasts, By Application (2021-2032) (USD Billion)
10.6.6.3 Brazil Printed Circuit Board (PCB) E-scrap Recycling Market Estimates and Forecasts, By Source Type (2021-2032) (USD Billion)
10.6.7 Argentina
10.6.7.1 Argentina Printed Circuit Board (PCB) E-scrap Recycling Market Estimates and Forecasts, By Type (2021-2032) (USD Billion)
10.6.7.2 Argentina Printed Circuit Board (PCB) E-scrap Recycling Market Estimates and Forecasts, By Application (2021-2032) (USD Billion)
10.6.7.3 Argentina Printed Circuit Board (PCB) E-scrap Recycling Market Estimates and Forecasts, By Source Type (2021-2032) (USD Billion)
10.6.8 Rest of Latin America
10.6.8.1 Rest of Latin America Printed Circuit Board (PCB) E-scrap Recycling Market Estimates and Forecasts, By Type (2021-2032) (USD Billion)
10.6.8.2 Rest of Latin America Printed Circuit Board (PCB) E-scrap Recycling Market Estimates and Forecasts, By Application (2021-2032) (USD Billion)
10.6.8.3 Rest of Latin America Printed Circuit Board (PCB) E-scrap Recycling Market Estimates and Forecasts, By Source Type (2021-2032) (USD Billion)
12. Company Profiles
12.1 Umicore
12.1.1 Company Overview
12.1.2 Financial
12.1.3 Products/ Services Offered
12.1.4 SWOT Analysis
12.2 Mitsubishi Materials Corporation
12.2.1 Company Overview
12.2.2 Financial
12.2.3 Products/ Services Offered
12.2.4 SWOT Analysis
12.3 Aurubis AG
12.3.1 Company Overview
12.3.2 Financial
12.3.3 Products/ Services Offered
12.3.4 SWOT Analysis
12.4 Glencore
12.4.1 Company Overview
12.4.2 Financial
12.4.3 Products/ Services Offered
12.4.4 SWOT Analysis
12.5 DOWA Holdings Co., Ltd.
12.5.1 Company Overview
12.5.2 Financial
12.5.3 Products/ Services Offered
12.5.4 SWOT Analysis
12.6 Boliden Group
12.6.1 Company Overview
12.6.2 Financial
12.6.3 Products/ Services Offered
12.6.4 SWOT Analysis
12.7 JX Nippon Mining & Metals Corporation
12.7.1 Company Overview
12.7.2 Financial
12.7.3 Products/ Services Offered
12.7.4 SWOT Analysis
12.8 Elemental Holding S.A.
12.8.1 Company Overview
12.8.2 Financial
12.8.3 Products/ Services Offered
12.8.4 SWOT Analysis
12.9 Interco Trading, Inc.
12.9.1 Company Overview
12.9.2 Financial
12.9.3 Products/ Services Offered
12.9.4 SWOT Analysis
12.10 Kuusakoski Group.
12.10.1 Company Overview
12.10.2 Financial
12.10.3 Products/ Services Offered
12.10.4 SWOT Analysis
12. Use Cases and Best Practices
13. Conclusion
An accurate research report requires proper strategizing as well as implementation. There are multiple factors involved in the completion of good and accurate research report and selecting the best methodology to compete the research is the toughest part. Since the research reports we provide play a crucial role in any company’s decision-making process, therefore we at SNS Insider always believe that we should choose the best method which gives us results closer to reality. This allows us to reach at a stage wherein we can provide our clients best and accurate investment to output ratio.
Each report that we prepare takes a timeframe of 350-400 business hours for production. Starting from the selection of titles through a couple of in-depth brain storming session to the final QC process before uploading our titles on our website we dedicate around 350 working hours. The titles are selected based on their current market cap and the foreseen CAGR and growth.
The 5 steps process:
Step 1: Secondary Research:
Secondary Research or Desk Research is as the name suggests is a research process wherein, we collect data through the readily available information. In this process we use various paid and unpaid databases which our team has access to and gather data through the same. This includes examining of listed companies’ annual reports, Journals, SEC filling etc. Apart from this our team has access to various associations across the globe across different industries. Lastly, we have exchange relationships with various university as well as individual libraries.
Step 2: Primary Research
When we talk about primary research, it is a type of study in which the researchers collect relevant data samples directly, rather than relying on previously collected data. This type of research is focused on gaining content specific facts that can be sued to solve specific problems. Since the collected data is fresh and first hand therefore it makes the study more accurate and genuine.
We at SNS Insider have divided Primary Research into 2 parts.
Part 1 wherein we interview the KOLs of major players as well as the upcoming ones across various geographic regions. This allows us to have their view over the market scenario and acts as an important tool to come closer to the accurate market numbers. As many as 45 paid and unpaid primary interviews are taken from both the demand and supply side of the industry to make sure we land at an accurate judgement and analysis of the market.
This step involves the triangulation of data wherein our team analyses the interview transcripts, online survey responses and observation of on filed participants. The below mentioned chart should give a better understanding of the part 1 of the primary interview.
Part 2: In this part of primary research the data collected via secondary research and the part 1 of the primary research is validated with the interviews from individual consultants and subject matter experts.
Consultants are those set of people who have at least 12 years of experience and expertise within the industry whereas Subject Matter Experts are those with at least 15 years of experience behind their back within the same space. The data with the help of two main processes i.e., FGDs (Focused Group Discussions) and IDs (Individual Discussions). This gives us a 3rd party nonbiased primary view of the market scenario making it a more dependable one while collation of the data pointers.
Step 3: Data Bank Validation
Once all the information is collected via primary and secondary sources, we run that information for data validation. At our intelligence centre our research heads track a lot of information related to the market which includes the quarterly reports, the daily stock prices, and other relevant information. Our data bank server gets updated every fortnight and that is how the information which we collected using our primary and secondary information is revalidated in real time.
Step 4: QA/QC Process
After all the data collection and validation our team does a final level of quality check and quality assurance to get rid of any unwanted or undesired mistakes. This might include but not limited to getting rid of the any typos, duplication of numbers or missing of any important information. The people involved in this process include technical content writers, research heads and graphics people. Once this process is completed the title gets uploader on our platform for our clients to read it.
Step 5: Final QC/QA Process:
This is the last process and comes when the client has ordered the study. In this process a final QA/QC is done before the study is emailed to the client. Since we believe in giving our clients a good experience of our research studies, therefore, to make sure that we do not lack at our end in any way humanly possible we do a final round of quality check and then dispatch the study to the client.
Key Segments:
By Type
Precious Metal
Copper
Others
By Application
Smartphones
PC & Laptop
Telecommunications
TV & Monitor
Others
By Source Type
Household Appliances
IT and Telecommunication Products
Entertainment Devices
Request for Segment Customization as per your Business Requirement: Segment Customization Request
Regional Coverage:
North America
US
Canada
Mexico
Europe
Germany
France
UK
Italy
Spain
Poland
Turkey
Rest of Europe
Asia Pacific
China
India
Japan
South Korea
Singapore
Australia
Taiwan
Rest of Asia Pacific
Middle East & Africa
UAE
Saudi Arabia
Qatar
South Africa
Rest of Middle East & Africa
Latin America
Brazil
Argentina
Rest of Latin America
Request for Country Level Research Report: Country Level Customization Request
Available Customization
With the given market data, SNS Insider offers customization as per the company’s specific needs. The following customization options are available for the report:
Detailed Volume Analysis
Criss-Cross segment analysis (e.g. Product X Application)
Competitive Product Benchmarking
Geographic Analysis
Additional countries in any of the regions
Customized Data Representation
Detailed analysis and profiling of additional market players