IR Spectroscopy Market Report Scope & Overview:
Get more information on IR Spectroscopy Market - Request Sample Report
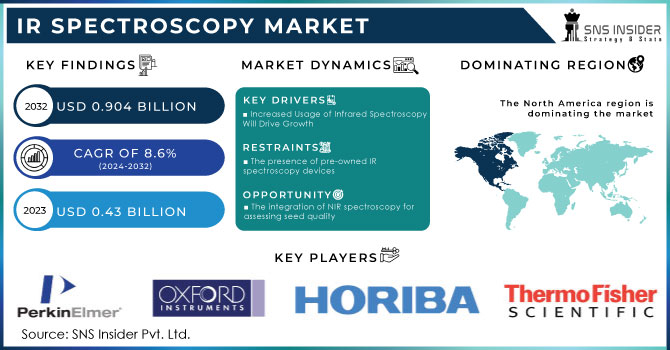
IR Spectroscopy Market Size was valued at USD 0.43 billion in 2023 and is expected to reach USD 0.904 billion by 2032 and grow at a CAGR of 8.6% over the forecast period 2024-2032.
The increasing worldwide need for functional foods, containing beneficial bioactive elements like vitamins, phenolics, and anthocyanins, is experiencing fast expansion because of their acknowledged positive effects on health. This growth has led to progress in analytical methods, especially in IR spectroscopy, which has become a crucial tool for the food sector. Due to the high cost and time-consuming nature of traditional analyses for these bioactive compounds, IR spectroscopy provides a quick, real-time, and affordable option. With applications in mid-infrared (MIR) and near-infrared (NIR) spectroscopy, this technology is being more widely utilized for its capability to analyze challenging food samples with little preparation needed. For instance, MIR spectroscopy has effectively been used to create accurate predictive models for bioactive antioxidants and phenolic compounds in strawberry juice fermentation, showing strong predictive accuracy with R² values ranging from 0.74 to 0.89. In addition, NIR spectroscopy has been very successful in examining phenolic compounds in olive oil, with multivariate validation algorithms demonstrating strong correlations up to r = 0.91. With the rising demand for products that promote health, the use of IR spectroscopy in evaluating food quality and controlling processing is expected to grow as the functional foods market expands. The technology's capability to offer in-depth molecular insights boosts growth, improves product quality, and ensures compliance with strict regulatory standards in the food sector. As a result, the increasing application of IR spectroscopy for examining bioactive compounds is closely linked to the overall market expansion, establishing it as an essential instrument in the changing field of functional food manufacturing.
The worldwide market for malaria testing is ready for substantial expansion, fueled by the pressing demand for more precise and sensitive detection techniques, especially in areas with high rates of malaria. Conventional methods of diagnosis, like microscopy and rapid diagnostic tests (RDTs), frequently face difficulties in detecting low parasite levels and in conditions with anemia due to their limited sensitivity. In this scenario, the development of AI-driven mid-IR spectroscopy, specifically utilizing ATR-FTIR technology, is a significant advancement in identifying malaria. A new research found that AI classifiers, which were trained using ATR-FTIR spectra from blood samples, were successful in identifying malaria infections with an accuracy exceeding 90% even when the parasitaemia levels are as low as one parasite per microliter of blood. This sensitivity goes beyond traditional approaches, proving to be highly beneficial for malaria screening in areas where the disease is common. Additionally, these classifiers demonstrated a consistency of over 80% in accurately predicting natural P. falciparum infections in field samples collected from southeastern Tanzania, highlighting the reliability and practicality of the technology. The AI-enhanced IR spectroscopy's effectiveness was not affected by different levels of anemia in malaria patients, showing its potential for wider use in difficult medical environments. As AI continues to improve IR spectroscopy in diagnostics, it will likely become a key tool in global malaria control efforts, boosting growth in both the diagnostic and spectroscopy sectors. The fusion of AI and IR spectroscopy enhances disease identification and supports global health efforts to eliminate malaria, strengthening the market's potential for continuous growth.
Market Dynamics
Drivers
- Increasing worries about Air quality and the growing use of IR Spectroscopy are driving the growth of the market.
The increasing recognition of the negative impact of air pollution on public health and the environment, especially in Europe, is a major factor driving the IR Spectroscopy market. With pollutants such as fine particulate matter and nitrogen dioxide linked to serious health problems, air pollution continues to be the biggest environmental health risk in Europe, leading to a growing need for more sophisticated monitoring and analytical instruments. In this context, IR spectroscopy has become essential technology, providing accurate, immediate analysis of air and water quality. The adoption of IR spectroscopy has been further encouraged by the strict regulations of the European Union, like the NECD, which requires reductions in pollutants such as NOx and PM2.5.The flexibility of IR spectroscopy enables its application in various industries, playing a crucial role in monitoring air quality, ensuring food safety, and improving healthcare diagnostics. IR spectroscopy is essential in the environmental field for identifying and measuring air contaminants, assisting industries in meeting regulations and reducing environmental harm. Furthermore, the importance of the technology in quality control, safety assessments, and disease diagnostics is highlighted by its usage in pharmaceuticals, food and beverages, and healthcare industries. The increased need for non-destructive, real-time analysis solutions is connected to the requirement for better air quality monitoring and following regulations. Industries and governments investing in technologies to protect public health and the environment are anticipated to fuel the ongoing expansion of the IR spectroscopy market. The EEA's data shows how air pollution affects the economy and health, emphasizing the importance of IR spectroscopy in addressing these issues and increasing its market adoption.The integration of computational TGI with IR spectroscopy is anticipated to boost market growth as industries seek advanced imaging techniques for monitoring and analyzing complex processes. The adaptability of this technology, which can expand to different spectral ranges like THz, establishes it as a fundamental element in the future advances of single-pixel imaging and spectroscopy, guaranteeing its importance and acceptance in different industries.
- Advancements in temporal ghost imaging methods fuel expansion in the mid-infrared (MIR) spectroscopy sector.
The advancement of computational temporal ghost imaging (TGI) methods, especially in the mid-infrared (MIR) range, is a major factor influencing the IR spectroscopy market. The latest achievement from researchers at Sichuan University and Tampere University focuses on frequency down conversion to enable TGI in MIR wavelengths, solving a key issue in the field: the absence of fast modulators and detectors in the MIR range. Using tunable lasers in the near-infrared (NIR) to control temporal intensity patterns, then transferring them to a mid-infrared (MIR) idler through difference-frequency generation, the innovative TGI method allows for studying ultrafast dynamics in MIR and THz spectral regions, which have been difficult to examine due to the lack of appropriate tools. This development expands the potential uses of ghost imaging and improves the performance of IR spectroscopy in the important MIR region, crucial for applications like environmental monitoring, chemical analysis, and medical diagnostics. Performing scan-free pump-probe imaging and studying ultrafast dynamics without requiring ultrafast MIR modulators greatly enhances the efficacy and precision of spectral analysis in the MIR. This advancement is expected to boost the use of IR spectroscopy in industries needing accurate, immediate analysis of molecular structures and environmental conditions, thereby broadening the market for MIR spectroscopic instruments. The combination of computational TGI with IR spectroscopy is projected to boost market growth as industries require more advanced imaging techniques for monitoring and analyzing complex processes. This technology's flexibility, which can expand to different spectral ranges like THz, establishes it as a key element in the future advancement of single-pixel imaging and spectroscopy, guaranteeing its importance and utilization in multiple industries.
Restraints
- Obstacles faced in analyzing complex mixtures hinder the expansion of the IR Spectroscopy market.
Although IR spectroscopy has many advantages, especially in the food sector, it encounters significant obstacles when used to analyze bioactive compounds, acting as constraints in the market. One of the main challenges is the complexity in interpreting spectra from intricate mixtures, as the mix of signals from different components makes it tough to precisely pinpoint and measure specific analytes. This problem becomes more noticeable when handling lower analyte concentrations, as IR spectroscopy, particularly in the Near-Infrared Spectroscopy (NIRS) region, is best suited for examining major components found at levels of around 0.5% or above. When the signal of the analyte is below this limit, it becomes harder to distinguish it from other peaks in the spectrum, leading to less precise analysis. Additionally, there are cases where IR spectroscopy can identify another substance at high levels that is related to the desired substance, resulting in what is referred to as a secondary or surrogate relationship. This occurrence may bring about more complications and possible errors in the examination, particularly in varied sample groups. These constraints require the creation of strong calibration models to guarantee accurate quantitative analysis, which can be time-consuming and resource-intensive. In spite of these obstacles, the cost-efficiency and quick analysis abilities of IR spectroscopy remain crucial in different areas of the food industry. Nevertheless, the broader acceptance of IR spectroscopy may be limited due to the demand for sophisticated calibration methods and challenges in managing intricate mixtures, especially in high sensitivity and specificity applications. These factors serve as obstacles to the market expansion of IR spectroscopy, especially in regions requiring accurate analysis of bioactive compounds.
- Challenges in complexity and calibration are hindering the adoption of IR Spectroscopy in the market.
The IR spectroscopy market is hindered by various obstacles that limit its wider use, especially in complex analytical scenarios. An important obstacle is analyzing spectra from complicated mixtures, as overlapping signals can hide the desired substance, requiring advanced calibration models for precise quantitative assessment. Analyzing bioactive compounds at low concentrations, usually below 0.5%, poses a challenge as the technique's efficiency decreases when distinguishing the signal of the analyte from other spectral peaks becomes harder. Furthermore, secondary or surrogate correlation phenomena may be observed in IR spectroscopy, where the detected signal aligns with a different analyte at larger scales, causing challenges in accurately identifying and quantifying the desired target. These restrictions require significant time and money for calibration and validation, especially in varied sample groups. The need for strong calibration models and the challenge of analyzing low-concentration compounds are significant obstacles to the broad adoption of IR spectroscopy. Despite its benefits, like being cost-effective and providing quick analysis, these obstacles limit the technology's use in situations requiring high levels of sensitivity and accuracy. Therefore, the market growth of IR spectroscopy is limited in sectors requiring accurate analysis of bioactive compounds due to the complexity of managing diverse samples and the need for advanced calibration.
Segment Analysis
By Product Type
Based on Product Type, Bench top Spectroscopes captured the largest share revenue share in 2023 with 38% of share. Their strength, precision, and adaptability are why they are the top choice for labs and industrial uses needing detailed spectral information. Major players like Thermo Fisher Scientific, PerkinElmer, and Bruker Corporation have played a key role in the expansion of this industry by consistently introducing new and improved products. For example, Thermo Fisher's release of the Thermo Scientific Nicolet iS5 FTIR Spectrometer demonstrates improved sensitivity and easy-to-use characteristics, enabling accurate analysis and effective data collection in different research and industrial environments. Also, PerkinElmer's Spectrum Two FTIR Spectrometer, equipped with advanced detection features and efficient analysis process, is tailored to cater to a wide range of uses, from pharmaceutical quality control to environmental surveillance. The Vertex 70v FTIR Spectrometer from Bruker, recognized for its top-notch optics and impressive resolution, has solidified its reputation as a premier tool for analyzing complex spectra. These advancements show the increasing need for table-top spectroscopes that provide advanced analytical features, along with easy-to-use interfaces and enhanced performance. The ongoing progress in benchtop spectroscopy devices greatly impacts the growth of the IR spectroscopy market by improving accuracy and efficiency in analysis in different industries. Their capacity to provide accurate, top-notch spectral data is in line with the overall shift towards greater automation and advancement in analytical technologies, further solidifying their crucial position in the growth of the IR spectroscopy market.
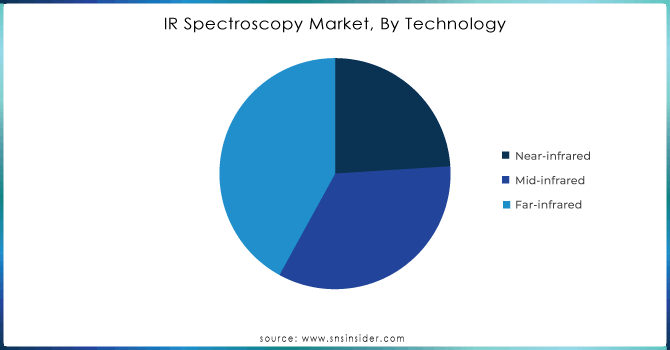
By Technology
Based on Technology, Far-infrared captured the largest share revenue in IR spectroscopy market with 42% of share in 2023. This dominance is due to the technology's unique ability to probe low-frequency vibrations and rotational transitions in molecules, which are crucial for detailed structural analysis of complex materials. The far-infrared region, covering wavelengths from 400 to 10 cm⁻¹ (25 to 1000 µm), offers valuable insights into molecular dynamics and material properties that are not accessible through mid- or near-infrared spectroscopy. Companies like Bruker Corporation, JASCO International, and Horiba Scientific have been at the forefront of advancing far-infrared spectroscopy technology. Bruker’s development of the ALPHA II FTIR spectrometer, which includes an advanced far-infrared option, exemplifies their commitment to enhancing far-infrared capabilities with high resolution and sensitivity. JASCO’s launch of the FT/IR-6000 series incorporates cutting-edge far-infrared detection technology, improving analytical performance for complex material characterization. Horiba Scientific has also introduced the FT-IR 3000 series, designed to provide superior far-infrared spectral analysis with enhanced data quality and faster acquisition times. These innovations reflect the growing demand for far-infrared spectroscopy in diverse applications, including materials science, polymer analysis, and pharmaceutical research. The far-infrared segment’s growth is fueled by its ability to deliver in-depth molecular information and support advanced research and quality control processes. As the market continues to expand, advancements in far-infrared spectroscopy technologies will play a pivotal role in driving the industry forward, offering enhanced analytical capabilities and addressing the increasing complexity of material analysis across various scientific and industrial sectors.
Get Customized Report as per your Business Requirement - Request For Customized Report
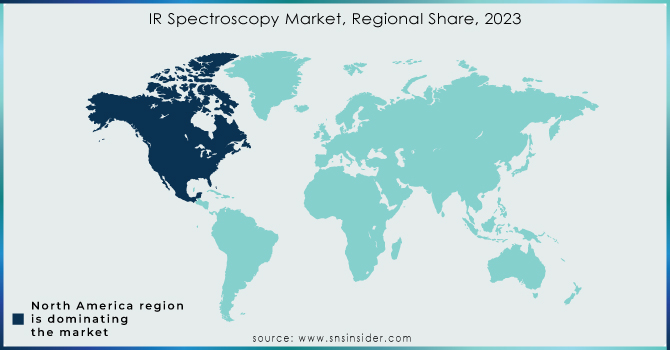
Regional Analysis
North America dominated the highest share in IR Spectroscopy market with 38% of share in 2023. Fueled by the area's cutting-edge technological infrastructure, strong research and development efforts, and substantial funding for scientific equipment. Thermo Fisher Scientific, PerkinElmer, and Bruker Corporation have been key players in driving leadership in the United States and Canada. Thermo Fisher Scientific has expanded its range by introducing the Thermo Scientific Nicolet iS10 FTIR spectrometer, providing cutting-edge technology for detailed and sensitive analysis to meet the varied requirements of pharmaceuticals, materials science, and environmental monitoring. The Spectrum Two FTIR spectrometer's advancements by PerkinElmer enhance its analytical abilities, solidifying its place in pharmaceutical quality control and research. Bruker's commitment to providing state-of-the-art solutions with top-level resolution and performance is showcased through their development of the Vertex 70v FTIR spectrometer. The market's expansion is further fueled by increased use in different industries like pharmaceuticals, chemicals, and environmental analysis, driven by North America's focus on innovation and technological progress. The focus in the area on enhancing healthcare, progressing material sciences, and tackling environmental issues has caused a rise in the need for IR spectroscopy solutions. Additionally, efforts to expand regionally involve forming partnerships and collaborations to improve market visibility and meet the unique requirements of various countries in North America. The technological advancements, strategic investments, and diverse applications in North America make it a crucial center in the global IR spectroscopy market, leading to ongoing growth and innovation.
Asia Pacific is becoming the second most rapidly expanding region within the IR spectroscopy market, expected to achieve a notable CAGR of 8.6% between 2024 and 2032. The quick growth is fueled by the area's growing industrialization, expanding research abilities, and increasing investments in advanced analytical technologies. Nations such as China, India, and Japan are leading the way in this expansion, supported by their substantial advancements in pharmaceuticals, biotechnology, and materials science. Key players in this dynamic market include Shimadzu Corporation, Horiba Scientific, and Agilent Technologies. Shimadzu has recently launched the IRTracer-100 FTIR spectrometer, which offers improved sensitivity and resolution for precise molecular examination, in high demand for pharmaceutical and environmental research in the Asia Pacific region. The introduction of the FT-IR 6000 series by Horiba Scientific demonstrates their dedication to offering specialized solutions for the chemical and semiconductor industries based on regional market requirements. Agilent Technologies has created the Cary 7000 FTIR spectrometer to meet the increasing need for accuracy in material analysis and quality control across different industries. The growing need for IR spectroscopy in Asia Pacific is fueled by the necessity for top-notch analytical solutions to aid expanding industries like healthcare, environmental monitoring, and industrial manufacturing. The increasing use of IR spectroscopy is supported by the region's emphasis on technological advancements and significant funding for research and development. With the market growth, Asia Pacific is becoming increasingly important in shaping the future of IR spectroscopy due to technological advancements and growing demand for analytical tools in various industries.
KEY PLAYERS:
The key players in the IR spectroscopy market are Thermo Fisher Scientific, PerkinElmer, Shimadzu Corporation, Bruker Corporation, Jasco, Oxford Instruments, Teledyne Princeton Instruments, Agilent Technologies, Horiba Limited, Metrohm, Hitachi High-Technologies Corporation, Newport Corporation, Sartorius & Other Players.
RECENT DEVELOPMENT
Recent Development
- In December of 2023, Shimadzu Corporation introduced IRseries products. They come with a navigation program for analyzing which helps new FTIR users collect data effortlessly, along with a feature that assesses the measurement results' quality and suggests ways to achieve better data.
- In September 2023, Sartorius AG and Repligen Corporation collaboratively introduced a combined bioreactor system. The Biostat STR is now equipped with an embedded XCell ATF hardware and software module that is fully compatible, providing predefined advanced control recipes with integrated Process Analytical Technology (PAT).
- In March 2023, the Rapid Screening Research Center for Toxicology and Biomedicine (RSRCTB) at National Sun Yat-sen University (NSYSU) set up Taiwan's first Satellite Laboratory, employing different chemical analytical instruments made by Shimadzu Corporation. The lab aims to broaden the use of mass spectrometry and Fourier transform infrared spectroscopy (FTIR).
- AIMsight was introduced in January 2023. Automation improves the efficiency of defect analysis. This new development has capabilities like quicker searching for measurement locations, aiding in tackling societal issues such as microplastics by analyzing contaminants.
| Report Attributes | Details |
|---|---|
| Market Size in 2023 | USD 0.43 Billion |
| Market Size by 2032 | USD 0.904 Billion |
| CAGR | CAGR of 8.6% From 2024 to 2032 |
| Base Year | 2023 |
| Forecast Period | 2024-2032 |
| Historical Data | 2020-2022 |
| Report Scope & Coverage | Market Size, Segments Analysis, Competitive Landscape, Regional Analysis, DROC & SWOT Analysis, Forecast Outlook |
| Key Segments | • By Product Type (Benchtop Spectroscopes, Portable Spectroscopes, Micro Spectroscopes, Hyphenated Spectroscopes) • By Technology (Near-Infrared, Mid-Infrared, Far-Infrared) • By End User (Healthcare & Pharmaceuticals, Biological Research, Consumer Electronics, Chemicals, Environmental, Food & Beverages) |
| Regional Analysis/Coverage | North America (US, Canada, Mexico), Europe (Eastern Europe [Poland, Romania, Hungary, Turkey, Rest of Eastern Europe] Western Europe] Germany, France, UK, Italy, Spain, Netherlands, Switzerland, Austria, Rest of Western Europe]), Asia-Pacific (China, India, Japan, South Korea, Vietnam, Singapore, Australia, Rest of Asia-Pacific), Middle East & Africa (Middle East [UAE, Egypt, Saudi Arabia, Qatar, Rest of Middle East], Africa [Nigeria, South Africa, Rest of Africa], Latin America (Brazil, Argentina, Colombia, Rest of Latin America) |
| Company Profiles | Thermo Fisher Scientific, PerkinElmer, Shimadzu Corporation, Bruker Corporation, Jasco, Oxford Instruments, Teledyne Princeton Instruments, Agilent Technologies, Horiba Limited, Metrohm, Hitachi High-Technologies Corporation, Newport Corporation and Sartorius. |
| Key Drivers |
• Increasing worries about Air quality and the growing use of IR Spectroscopy are driving the growth of the market. • Advancements in temporal ghost imaging methods fuel expansion in the mid-infrared (MIR) spectroscopy sector. |
| RESTRAINTS |
• Obstacles faced in analyzing complex mixtures hinder the expansion of the IR Spectroscopy market. • Challenges in complexity and calibration are hindering the adoption of IR Spectroscopy in the market |
Get in Touch
