IT Operations Analytics Market Report Scope & Overview:
Get more information on IT Operations Analytics Market - Request Free Sample Report
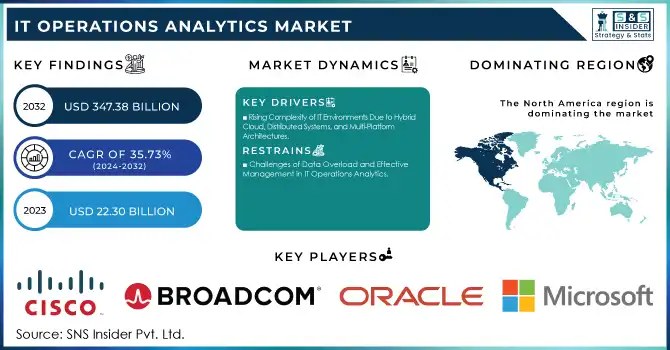
IT Operations Analytics Market was valued at USD 22.30 billion in 2023 and is expected to reach USD 347.38 billion by 2032, growing at a CAGR of 35.73% from 2024-2032.
The IT Operations Analytics market is experiencing robust growth, driven by the increasing complexity of IT environments and the need for organizations to ensure seamless operations. As businesses transition to hybrid and multi-cloud infrastructures, they require advanced tools that can monitor, analyze, and optimize performance across these complex ecosystems. This demand is further fueled by the adoption of artificial intelligence and machine learning in ITOA solutions, which provide predictive analytics to proactively address potential issues, minimize downtime, and enhance productivity. In 2024, Hitachi Vantara launched the Hitachi IQ platform, integrating NVIDIA's HGX technology, which enhances AI workload performance with improved scalability, reliability, and security. Consequently, sectors such as BFSI, healthcare, retail, and manufacturing are increasingly integrating ITOA to drive operational efficiency.
With organizations managing vast data volumes, such as the 3.5 quintillion bytes created daily and 333.2 billion emails sent, the need for real-time monitoring, pattern recognition, and anomaly detection is critical. ITOA solutions address this by offering actionable insights that optimize system performance and improve decision-making. Additionally, regulatory requirements for IT governance and security are driving enterprises to adopt analytics-driven approaches, enhancing visibility and compliance. As a result, the market continues to grow with rising demand for these advanced analytics tools, crucial for maintaining a competitive edge.
Looking toward the future, the ITOA market holds significant opportunities, particularly with the expansion of 5G, IoT, and edge computing technologies, which will generate increasingly complex data streams. This surge in data will drive the need for advanced analytics tools. In 2024, Dell Technologies enhanced the Dell NativeEdge platform, focusing on improved AI workload management, scalability, and pre-built deployment solutions, particularly for industries like retail and utilities. This development emphasizes the growing demand for intelligent edge solutions. As digital transformation accelerates, small and medium-sized enterprises will increasingly adopt cost-effective, scalable ITOA solutions. With ongoing innovations in automation and self-healing systems, businesses will gain greater agility, resilience, and operational excellence, ensuring continued growth in the ITOA market.
IT Operations Analytics Market Dynamics
DRIVERS
- Rising Complexity of IT Environments Due to Hybrid Cloud, Distributed Systems, and Multi-Platform Architectures
The evolving landscape of IT environments, especially with the rise of hybrid and multi-cloud architectures, has created significant challenges for organizations. Managing these diverse infrastructures requires sophisticated tools capable of monitoring and analyzing performance across various platforms. As companies continue to adopt distributed systems, including microservices, the complexity further intensifies, demanding more advanced monitoring solutions. According to 39.5% of over 300 IT personnel in DevOps, capacity planning has become more difficult after the rise of digital transformation. Additionally, 38.4% of companies whose consumers face digital issues report experiencing 30+ minutes of downtime in solving IT-related problems. This growing complexity amplifies the necessity for IT Operations Analytics platforms, which offer real-time insights to ensure smooth operations across on-premise, cloud, and edge systems, enhancing visibility, performance management, and proactive issue resolution.
- Technological Advancements and Expanding Vendor Solutions Fueling IT Operations Analytics Growth
Continuous innovation in IT Operations Analytics solutions is driving market expansion as vendors introduce advanced features like automated root-cause analysis, predictive analytics, and enhanced visualization capabilities. These technological advancements enable businesses to more effectively monitor and optimize their IT operations, providing deeper insights and more precise control over complex environments. In 2024, Cloud Software Group and Microsoft signed an eight-year strategic partnership to offer joint cloud solutions and generative AI, targeting over 100 million people. This partnership, focused on integrating AI with cloud platforms like Microsoft Azure, enhances virtual application and desktop services. Moreover, the increasing availability of cloud-based ITOA solutions, particularly in the Software-as-a-Service (SaaS) model, offers scalability, flexibility, and cost-efficiency, making these tools more accessible to a wider range of organizations. With AI and machine learning integration, these platforms are becoming more intelligent, automating processes and providing actionable insights in real time.
RESTRAINTS
- Concerns Over Data Privacy and Security in IT Operations Analytics
ITOA solutions require the collection and analysis of vast amounts of data from an organization’s entire IT infrastructure, which raises significant concerns around data privacy and security. With the increasing frequency of data breaches and cyberattacks, businesses are wary of exposing sensitive information through these analytics platforms. The risk of unauthorized access or data misuse is particularly concerning in sectors like healthcare, finance, and government, where strict regulatory requirements for data protection must be met. Organizations may be reluctant to adopt ITOA tools due to fears of non-compliance with data privacy laws such as GDPR or HIPAA. Additionally, the integration of such solutions often involves third-party vendors, increasing the potential for vulnerabilities and creating more challenges in ensuring robust security measures are in place to protect valuable data.
- Challenges of Data Overload and Effective Management in IT Operations Analytics
ITOA solutions are designed to process massive volumes of data, but without proper strategies to manage and filter this information, businesses can quickly face data overload. The sheer volume of data generated can overwhelm IT teams, making it difficult to extract actionable insights in a timely manner. Decision-makers may struggle to focus on the most critical issues when faced with an overwhelming amount of irrelevant or redundant data. Additionally, without effective data management practices, valuable insights could be buried under unnecessary noise, diminishing the overall effectiveness of the ITOA platform. This overload can lead to delays in response times, slower decision-making processes, and ultimately reduce the platform’s impact on improving IT operations. Organizations may struggle to find the right balance between data collection and actionable analysis, limiting the success of ITOA implementation.
IT Operations Analytics Market Segment Analysis
By Type
In 2023, the Predictive Analytics segment held the largest revenue share of approximately 37% in the IT Operations Analytics market due to its ability to leverage advanced algorithms and machine learning to anticipate potential IT disruptions. By forecasting system failures, performance bottlenecks, and resource demands, organizations can proactively manage their IT environments, reducing downtime and improving operational efficiency. This predictive capability offers businesses a competitive edge, driving the demand for solutions that integrate predictive insights into day-to-day IT operations.
The Behavior Analytics segment is poised to experience the fastest growth, with a projected CAGR of 35.21% from 2024 to 2032. This growth is fueled by the increasing need for organizations to identify and respond to anomalies in user behavior that may signal cybersecurity threats or operational inefficiencies. As businesses continue to prioritize security and operational optimization, behavior analytics tools, which provide actionable insights based on user interactions and system patterns, are becoming essential in safeguarding critical IT infrastructures and enhancing overall performance.
By Application
In 2023, the Asset Performance Management segment led the IT Operations Analytics market, commanding a revenue share of approximately 34%. This dominance is attributed to APM’s ability to optimize the performance and lifespan of critical assets through real-time monitoring, predictive analytics, and advanced maintenance strategies. By minimizing equipment failures and reducing operational costs, APM solutions offer significant value to industries such as manufacturing, energy, and transportation, driving widespread adoption and market growth.
The Network Management segment is expected to experience the fastest CAGR of about 35.21% from 2024 to 2032, fueled by the increasing complexity of network infrastructures. As organizations expand their IT environments with hybrid, multi-cloud, and IoT systems, the need for efficient network monitoring and optimization becomes crucial. Network management solutions are essential for ensuring seamless connectivity, reducing downtime, and maintaining performance, making them increasingly critical to businesses striving for operational efficiency and robust digital transformation strategies.
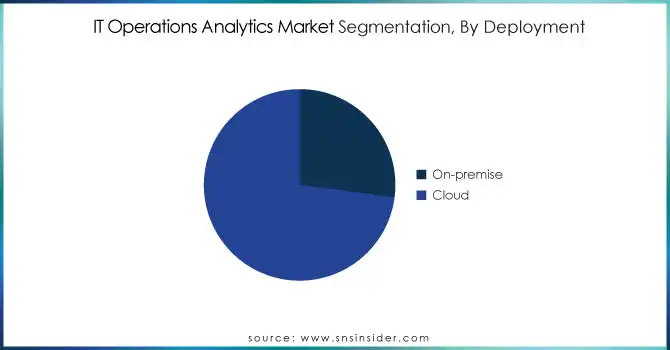
By Deployment
The Cloud segment dominated the IT Operations Analytics market in 2023, securing the highest revenue share of approximately 73%, and is projected to grow at the fastest CAGR of about 36.63% from 2024 to 2032. This dominance can be attributed to the widespread adoption of cloud infrastructures, which provide organizations with scalability, flexibility, and cost-effectiveness in managing their IT operations. As more businesses transition to cloud environments, the need for advanced analytics solutions that optimize performance, enhance system reliability, and reduce downtime is increasing. Cloud-based analytics also enable real-time monitoring, predictive maintenance, and streamlined workflows, which drive operational efficiencies. Given the ongoing digital transformation across industries and the continuous advancements in cloud technologies, the Cloud segment is well-positioned for sustained growth, making it a key driver in the IT Operations Analytics market over the next decade.
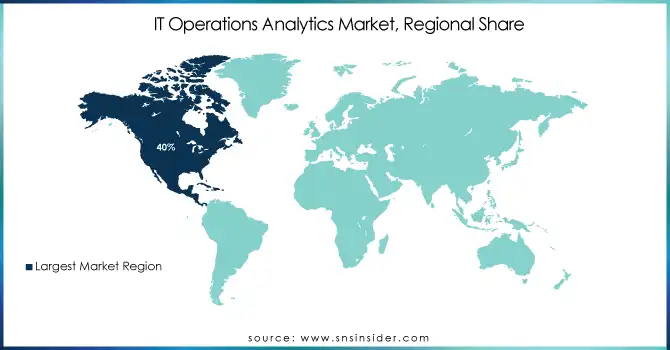
REGIONAL ANALYSIS
In 2023, North America dominated the IT Operations Analytics market, capturing the largest revenue share of approximately 40%. This leadership is driven by the region’s strong technological infrastructure, high adoption rates of advanced IT solutions, and the presence of major industry players. The growing demand for IT operations analytics across industries such as healthcare, finance, and manufacturing has further fueled this market dominance, as organizations seek to enhance operational efficiency, reduce costs, and improve system performance.
Asia Pacific is expected to grow at the fastest CAGR of about 37.94% from 2024 to 2032, largely due to rapid digital transformation initiatives and increasing investments in IT infrastructure across the region. Countries like China, India, and Japan are experiencing significant growth in cloud adoption, IoT integration, and smart technologies, driving the need for advanced analytics solutions. As businesses in this region prioritize operational optimization and cybersecurity, the demand for IT operations analytics tools is poised to expand, positioning Asia Pacific as a key growth market.
Need any customization research on IT Operations Analytics Market - Enquiry Now
KEY PLAYERS
-
Cisco (Cisco Prime Infrastructure, Cisco AppDynamics)
-
Broadcom (DX Operational Intelligence, AIOps from Broadcom)
-
IBM (IBM Cloud Pak for Watson AIOps, IBM Tivoli Monitoring)
-
Oracle (Oracle Management Cloud, Oracle Enterprise Manager)
-
Microsoft (Azure Monitor, System Center Operations Manager)
-
OpenText (OpenText Operations Bridge, OpenText Business Value Dashboard)
-
Hitachi (Hitachi Ops Center, Hitachi IT Operations Director)
-
Dynatrace (Dynatrace OneAgent, Dynatrace Smartscape)
-
SolarWinds (SolarWinds Network Performance Monitor, SolarWinds Server & Application Monitor)
-
BMC Software (BMC Helix Operations Management, BMC TrueSight Operations Management)
-
NetApp (NetApp Cloud Insights, NetApp OnCommand Insight)
-
Elastic (Elastic Observability, Elastic APM)
-
Nexthink (Nexthink Experience, Nexthink Act)
-
HCL Technologies (HCL DRYiCE iObserve, HCL DRYiCE iControl)
-
New Relic (New Relic One, New Relic APM)
-
ServiceNow (ServiceNow IT Operations Management, ServiceNow Predictive AIOps)
-
Dell Technologies (Dell EMC OpenManage, Dell CloudIQ)
-
HPE (HPE InfoSight, HPE OneView)
-
Cloud Software Group (Citrix Application Delivery Management, NetScaler MAS)
-
Veritas Technologies (Veritas APTARE IT Analytics, Veritas Predictive Insights)
-
BigPanda (BigPanda Autonomous Operations Platform, BigPanda Incident Management)
-
ExtraHop Networks (ExtraHop Reveal(x), ExtraHop Performance Platform)
-
Squadcast (Squadcast Incident Management, Squadcast SRE Platform)
-
ScienceLogic (ScienceLogic SL1 Platform, ScienceLogic AIOps)
-
Apica (Apica Synthetic Monitoring, Apica Load Testing)
-
Diamanti (Diamanti Spektra, Diamanti D20)
-
MCG (MCG IT Operations Analytics Platform, MCG Service Assurance)
-
Evolven (Evolven Change Analytics, Evolven Configuration Analytics)
-
XPLG (XPLG Log Analysis Platform, XPLG Log Management)
-
HEAL Software (HEAL Predictive Diagnosis, HEAL Anomaly Detection)
-
Sumo Logic (Sumo Logic Continuous Intelligence Platform, Sumo Logic Log Management)
-
Devo (Devo Data Analytics Platform, Devo Security Operations)
-
meshIQ (meshIQ Monitoring, meshIQ Analytics)
LATEST NEWS-
-
Broadcom introduced VMware Cloud Foundation 9 at VMware Explore 2024, focusing on automating and streamlining private cloud operations with enhanced efficiency and AI capabilities.
-
In 2024, IBM and Telefónica Tech signed a collaboration agreement to create advanced AI, analytics, and data management solutions for enterprises, utilizing the SHARK.X hybrid cloud platform to enhance data operations and drive innovation.
-
In 2024, Oracle unveiled new AI-driven features for Oracle Fusion Data Intelligence, including intelligent applications for Human Capital Management and Supply Chain Management.
-
In August 2024, Palantir and Microsoft expanded their partnership to enhance U.S. national security with AI and analytics, integrating Palantir's AI platforms with Microsoft’s Azure OpenAI Service for secure, AI-driven decision-making in classified networks.
| Report Attributes | Details |
|---|---|
| Market Size in 2023 | USD 22.30 Billion |
| Market Size by 2032 | USD 347.38 Billion |
| CAGR | CAGR of 35.73% From 2024 to 2032 |
| Base Year | 2023 |
| Forecast Period | 2024-2032 |
| Historical Data | 2020-2022 |
| Report Scope & Coverage | Market Size, Segments Analysis, Competitive Landscape, Regional Analysis, DROC & SWOT Analysis, Forecast Outlook |
| Key Segments | • By Type (Predictive Analytics, Visual Analytics, Root Cause Analytics, Behavior Analytics) • By Application (Asset Performance Management, Network Management, Security Management, Log Management) • By Deployment (On-premise, Cloud) • By End Use (Healthcare, Retail, Manufacturing, Government, IT & Telecom, Others) |
| Regional Analysis/Coverage | North America (US, Canada, Mexico), Europe (Eastern Europe [Poland, Romania, Hungary, Turkey, Rest of Eastern Europe] Western Europe] Germany, France, UK, Italy, Spain, Netherlands, Switzerland, Austria, Rest of Western Europe]), Asia Pacific (China, India, Japan, South Korea, Vietnam, Singapore, Australia, Rest of Asia Pacific), Middle East & Africa (Middle East [UAE, Egypt, Saudi Arabia, Qatar, Rest of Middle East], Africa [Nigeria, South Africa, Rest of Africa], Latin America (Brazil, Argentina, Colombia, Rest of Latin America) |
| Company Profiles | Cisco, Broadcom, IBM, Oracle, Microsoft, OpenText, Hitachi, Dynatrace, SolarWinds, BMC Software, NetApp, Elastic, Nexthink, HCL Technologies, New Relic, ServiceNow, Dell Technologies, HPE, Cloud Software Group, Veritas Technologies, BigPanda, ExtraHop Networks, Squadcast, ScienceLogic, Apica, Diamanti, MCG, Evolven, XPLG, HEAL Software, Sumo Logic, Devo, meshIQ |
| Key Drivers | • Rising Complexity of IT Environments Due to Hybrid Cloud, Distributed Systems, and Multi-Platform Architectures • Technological Advancements and Expanding Vendor Solutions Fueling IT Operations Analytics Growth |
| RESTRAINTS | • Concerns Over Data Privacy and Security in IT Operations Analytics • Challenges of Data Overload and Effective Management in IT Operations Analytics |
Get in Touch
