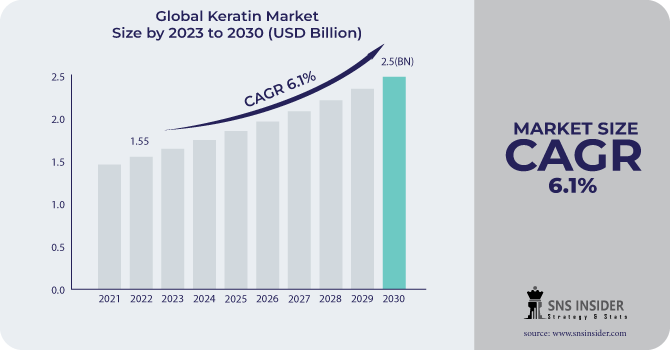
The Keratin Market size was valued at USD 1.55 billion in 2022. It is estimated to hit USD 2.5 billion by 2030 and grow at a CAGR of 6.1% over the forecast period of 2023-2030.
The growth of the keratin market is driven by the increasing demand for hair care products. Consumers are becoming more conscious about their appearance and are actively seeking products that can enhance the health and beauty of their hair. As a result, the demand for keratin-infused shampoos, conditioners, and treatments has increased. A significant trend in the keratin market is the rising demand for keratin treatments in salons. Keratin treatments, also known as Brazilian blowouts, have gained immense popularity among individuals seeking to achieve smooth, frizz-free hair. These treatments involve the application of keratin-infused products and heat to the hair, resulting in long-lasting straightening effects. The increasing demand.
Get More Information on Keratin Market - Request Sample Report
The hydrolyzed keratin dominated the keratin market with a revenue share of more than 50% in 2022. This versatile substance serves various purposes, such as acting as a humectant, nail conditioning agent, antistatic agent, and hair and biological additive. Its significance extends beyond cosmetic applications, as it plays a crucial role in the development of healthy tissues. Cosmetic and personal care companies incorporate hydrolyzed keratin into their products to enhance well-being, health, and beauty. For example, mascara may contain hydrolyzed keratin at concentrations of up to 0.2%, while bath soaps can have concentrations of up to 0.028%. Hair sprays, on the other hand, typically contain a maximum concentration of 0.059% hydrolyzed keratin.
Drivers
Increasing demand for hair care products
The growing awareness about hair health and the desire for lustrous, strong hair has led to a surge in the demand for keratin-based hair care products. Consumers are seeking effective solutions to combat hair damage caused by pollution, heat styling, and chemical treatments.
Rise in the demand for natural and organic products
With the increasing preference for natural and organic ingredients in personal care products, keratin, being a natural protein, has gained significant traction. Consumers are shifting towards products that are free from harmful chemicals and are seeking safer alternatives for hair care.
Restraint
High cost of keratin treatments
Keratin treatments can be expensive, making them less accessible to a wider consumer base. On average, the cost of treatment can range from $200 to $600. However, it is important to note that prices may vary depending on the salon. The cost of sourcing and processing keratin, along with the professional expertise required for application, contributes to the high price point of these treatments.
Limited availability of raw materials
Keratin is primarily sourced from animal by-products, such as feathers, horns, and hooves. The limited availability of these raw materials poses a challenge to the keratin market, as it restricts the production capacity and scalability of keratin-based products.
Opportunities
Technological advancement in the beauty salon industry
Growing demand for keratin in emerging markets
The increasing disposable income and changing lifestyles in emerging economies present a significant opportunity for the keratin market. As consumers in these regions become more conscious about their appearance and hair care, the demand for keratin-based products is expected to witness substantial growth.
Challenges
Intense competition from alternative hair care solutions
In the market, there exist alternative treatments and products that offer comparable benefits to keratin-based solutions. The availability of substitutes presents a potential challenge to the keratin market, as consumers might choose more cost-effective alternatives.
Before February 24th, 70% of the Russian cosmetics market was dominated by large international companies, primarily from the European Union and the United States. However, within just two months, by April 2022, the market had experienced a significant decline of 14% due to the departure of these major corporations. Consequently, the availability of retail products decreased by 25%. Fearing scarcity, consumers responded by stockpiling goods, resulting in a 3% increase in cosmetics purchases during the first half of 2022. Undoubtedly, the most striking impact of the conflict outbreak on the Russian cosmetics market was the drastic reduction in imports, which decreased by a staggering 80%. The Ukrainian cosmetics industry suffered severe consequences from Russia's invasion, leading to the suspension of production and closure of numerous businesses. This downturn in the cosmetic market also had a detrimental effect on the keratin market in both Russia and Ukraine.
The threat of a recession may cause some shoppers to reduce their spending on nonessential items, but this does not seem to apply to beauty essentials. The beauty industry in the United States also experienced significant growth, with high-end beauty brands witnessing a 15% year-over-year increase in revenue, surpassing $27 billion. The consistent or even increased demand for personal care products during an economic downturn is driving the need for keratin in the production of beauty items.
However, in some low-income level countries, the recession poses some challenges for the keratin market. The decreased demand for keratin-based goods may result in excess inventory, which strains the financial health of industry participants. The recession also hinders research and development efforts within the keratin market, as companies may have limited resources to allocate toward innovation and product improvement.
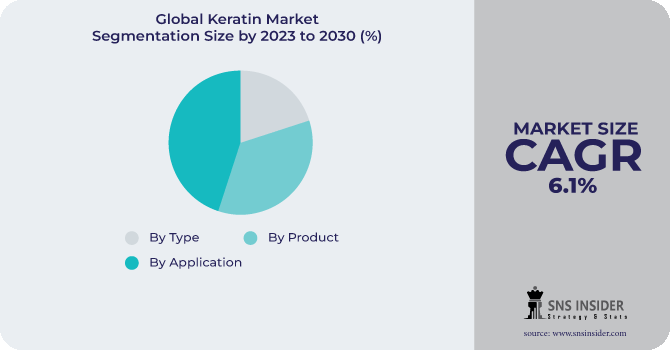
By Type
Alpha-Keratin
Beta-Keratin
By Product
Hydrolyzed
Others
By Application
Personal Care & Cosmetics
Food & Beverages
Healthcare & Pharmaceuticals
Others
Get Customised Report as per Your Business Requirement - Enquiry Now
North America dominated the keratin market with a revenue share of about 38% in 2022. This is attributed to the increasing usage of hair care and skin care products among individuals. Moreover, the presence of numerous small- and large-scale producers in the region has contributed to the growing awareness and demand for personal care products. Manufacturers in North America have adopted an integrated approach toward health and cosmetic products, recognizing the interconnectedness of various categories within the personal care industry. This strategic shift has further bolstered the market's growth. Among the countries in North America, the United States stood out as the leading exporter of hair products in 2022, with an impressive export value of nearly 1.7 billion U.S. dollars. This is attributed to the rising consumption of personal care products in the region. The flourishing retail industry, coupled with an increasing consciousness among individuals about safeguarding their skin and hair from dust and pollution, has fueled this demand. These factors play a pivotal role in driving the demand for keratin in North America throughout the forecast period.
Asia Pacific is expected to grow with the highest CAGR of about 6.5% and to be the largest region for the keratin market in the coming years. This growth is attributed to the soaring demand for hair care and styling products, as well as the increasing popularity of keratin treatments and other hair straightening procedures in countries like China, India, Japan, and South Korea. Moreover, the presence of global multinational companies in this region, coupled with the strong demand from end-use markets such as personal care & cosmetics, healthcare & pharmaceuticals, and food & beverages, further propels the keratin market. Furthermore, increasing consumption of personal care & cosmetic products that provide enhanced nutrition to the skin and hair is expected to drive the demand for keratin in the coming years. As a result, the Asia Pacific region is poised to witness substantial growth in the keratin market.
REGIONAL COVERAGE:
North America
US
Canada
Mexico
Europe
Eastern Europe
Poland
Romania
Hungary
Turkey
Rest of Eastern Europe
Western Europe
Germany
France
UK
Italy
Spain
Netherlands
Switzerland
Austria
Rest of Western Europe
Asia Pacific
China
India
Japan
South Korea
Vietnam
Singapore
Australia
Rest of Asia Pacific
Middle East & Africa
Middle East
UAE
Egypt
Saudi Arabia
Qatar
Rest of the Middle East
Africa
Nigeria
South Africa
Rest of Africa
Latin America
Brazil
Argentina
Colombia
Rest of Latin America
The major key players are BASF SE, Keraplast, Proteina, Rejuvenol, MakingCosmetics Inc., Hefei TNJ Chemical Industry Co. Ltd., Greentech, Keratin Express, Clariant, Kerline Srl, Roxlor, NutriScience Innovations LLC, and other key players are mentioned in the final report.
In March 2023, BASF Personal Care introduced a plant-based alternative called "Kerasylium™" at the prestigious in-cosmetics Global event. Kerasylium™ not only meets the requirements for vegan products but also showcases the innovative upcycling of a by-product that would otherwise be discarded as waste.
Recently, Rejuvenol Laboratories has introduced its latest achievement: the Ultra-Light Brazilian 24-Hour Keratin Treatment. This formula aims to significantly reduce application time while delivering weightless and visibly healthier hair.
| Report Attributes | Details |
| Market Size in 2022 | US$ 1.55 Bn |
| Market Size by 2030 | US$ 2.5 Bn |
| CAGR | CAGR of 6.1% From 2023 to 2030 |
| Base Year | 2022 |
| Forecast Period | 2023-2030 |
| Historical Data | 2019-2021 |
| Report Scope & Coverage | Market Size, Segments Analysis, Competitive Landscape, Regional Analysis, DROC & SWOT Analysis, Forecast Outlook |
| Key Segments | • By Type (Alpha-Keratin and Beta-Keratin) • By Product (Hydrolyzed and Others) • By Application (Personal Care & Cosmetics, Food & Beverages, Healthcare & Pharmaceuticals, and Others) |
| Regional Analysis/Coverage | North America (US, Canada, Mexico), Europe (Eastern Europe [Poland, Romania, Hungary, Turkey, Rest of Eastern Europe] Western Europe] Germany, France, UK, Italy, Spain, Netherlands, Switzerland, Austria, Rest of Western Europe]), Asia Pacific (China, India, Japan, South Korea, Vietnam, Singapore, Australia, Rest of Asia Pacific), Middle East & Africa (Middle East [UAE, Egypt, Saudi Arabia, Qatar, Rest of Middle East], Africa [Nigeria, South Africa, Rest of Africa], Latin America (Brazil, Argentina, Colombia Rest of Latin America) |
| Company Profiles | BASF SE, Keraplast, Proteina, Rejuvenol, MakingCosmetics Inc., Hefei TNJ Chemical Industry Co. Ltd., Greentech, Keratin Express, Clariant, Kerline Srl, Roxlor, NutriScience Innovations LLC |
| Key Drivers | • Increasing demand for hair care products • Rise in the demand for natural and organic products |
| Market Restraints | • High cost of keratin treatments • Limited availability of raw materials |
The Keratin Market was valued at USD 1.55 billion in 2022.
The expected CAGR of the global Keratin Market during the forecast period is 6.1%.
The Personal Care and cosmetics application segment dominated the Keratin Market with the highest revenue share in 2022.
The United States held the largest market share in the North America region in 2022.
Yes, you can buy reports in bulk quantity as per your requirements. Check Here for more details.
Table of Contents
1. Introduction
1.1 Market Definition
1.2 Scope
1.3 Research Assumptions
2. Research Methodology
3. Market Dynamics
3.1 Drivers
3.2 Restraints
3.3 Opportunities
3.4 Challenges
4. Impact Analysis
4.1 Impact of the Ukraine- Russia War
4.2 Impact of Ongoing Recession
4.2.1 Introduction
4.2.2 Impact on major economies
4.2.2.1 US
4.2.2.2 Canada
4.2.2.3 Germany
4.2.2.4 France
4.2.2.5 United Kingdom
4.2.2.6 China
4.2.2.7 Japan
4.2.2.8 South Korea
4.2.2.9 Rest of the World
5. Value Chain Analysis
6. Porter’s 5 forces model
7. PEST Analysis
8. Keratin Market Segmentation, By Type
8.1 Alpha-Keratin
8.2 Beta-Keratin
9. Keratin Market Segmentation, By Product
9.1 Hydrolyzed
9.2 Others
10. Keratin Market Segmentation, By Application
10.1 Personal Care & Cosmetics
10.2 Food & Beverages
10.3 Healthcare & Pharmaceuticals
10.4 Others
11. Regional Analysis
11.1 Introduction
11.2 North America
11.2.1 North America Keratin Market by Country
11.2.2North America Keratin Market by Type
11.2.3 North America Keratin Market by Product
11.2.4 North America Keratin Market by Application
11.2.5 USA
11.2.5.1 USA Keratin Market by Type
11.2.5.2 USA Keratin Market by Product
11.2.5.3 USA Keratin Market by Application
11.2.6 Canada
11.2.6.1 Canada Keratin Market by Type
11.2.6.2 Canada Keratin Market by Product
11.2.6.3 Canada Keratin Market by Application
11.2.7 Mexico
11.2.7.1 Mexico Keratin Market by Type
11.2.7.2 Mexico Keratin Market by Product
11.2.7.3 Mexico Keratin Market by Application
11.3 Europe
11.3.1 Eastern Europe
11.3.1.1 Eastern Europe Keratin Market by Country
11.3.1.2 Eastern Europe Keratin Market by Type
11.3.1.3 Eastern Europe Keratin Market by Product
11.3.1.4 Eastern Europe Keratin Market by Application
11.3.1.5 Poland
11.3.1.5.1 Poland Keratin Market by Type
11.3.1.5.2 Poland Keratin Market by Product
11.3.1.5.3 Poland Keratin Market by Application
11.3.1.6 Romania
11.3.1.6.1 Romania Keratin Market by Type
11.3.1.6.2 Romania Keratin Market by Product
11.3.1.6.4 Romania Keratin Market by Application
11.3.1.7 Turkey
11.3.1.7.1 Turkey Keratin Market by Type
11.3.1.7.2 Turkey Keratin Market by Product
11.3.1.7.3 Turkey Keratin Market by Application
11.3.1.8 Rest of Eastern Europe
11.3.1.8.1 Rest of Eastern Europe Keratin Market by Type
11.3.1.8.2 Rest of Eastern Europe Keratin Market by Product
11.3.1.8.3 Rest of Eastern Europe Keratin Market by Application
11.3.2 Western Europe
11.3.2.1 Western Europe Keratin Market by Type
11.3.2.2 Western Europe Keratin Market by Product
11.3.2.3 Western Europe Keratin Market by Application
11.3.2.4 Germany
11.3.2.4.1 Germany Keratin Market by Type
11.3.2.4.2 Germany Keratin Market by Product
11.3.2.4.3 Germany Keratin Market by Application
11.3.2.5 France
11.3.2.5.1 France Keratin Market by Type
11.3.2.5.2 France Keratin Market by Product
11.3.2.5.3 France Keratin Market by Application
11.3.2.6 UK
11.3.2.6.1 UK Keratin Market by Type
11.3.2.6.2 UK Keratin Market by Product
11.3.2.6.3 UK Keratin Market by Application
11.3.2.7 Italy
11.3.2.7.1 Italy Keratin Market by Type
11.3.2.7.2 Italy Keratin Market by Product
11.3.2.7.3 Italy Keratin Market by Application
11.3.2.8 Spain
11.3.2.8.1 Spain Keratin Market by Type
11.3.2.8.2 Spain Keratin Market by Product
11.3.2.8.3 Spain Keratin Market by Application
11.3.2.9 Netherlands
11.3.2.9.1 Netherlands Keratin Market by Type
11.3.2.9.2 Netherlands Keratin Market by Product
11.3.2.9.3 Netherlands Keratin Market by Application
11.3.2.10 Switzerland
11.3.2.10.1 Switzerland Keratin Market by Type
11.3.2.10.2 Switzerland Keratin Market by Product
11.3.2.10.3 Switzerland Keratin Market by Application
11.3.2.11.1 Austria
11.3.2.11.2 Austria Keratin Market by Type
11.3.2.11.3 Austria Keratin Market by Product
11.3.2.11.4 Austria Keratin Market by Application
11.3.2.12 Rest of Western Europe
11.3.2.12.1 Rest of Western Europe Keratin Market by Type
11.3.2.12.2 Rest of Western Europe Keratin Market by Product
11.3.2.12.3 Rest of Western Europe Keratin Market by Application
11.4 Asia-Pacific
11.4.1 Asia-Pacific Keratin Market by Country
11.4.2 Asia-Pacific Keratin Market by Type
11.4.3 Asia-Pacific Keratin Market by Product
11.4.4 Asia-Pacific Keratin Market by Application
11.4.5 China
11.4.5.1 China Keratin Market by Type
11.4.5.2 China Keratin Market by Application
11.4.5.3 China Keratin Market by Product
11.4.6 India
11.4.6.1 India Keratin Market by Type
11.4.6.2 India Keratin Market by Product
11.4.6.3 India Keratin Market by Application
11.4.7 Japan
11.4.7.1 Japan Keratin Market by Type
11.4.7.2 Japan Keratin Market by Product
11.4.7.3 Japan Keratin Market by Application
11.4.8 South Korea
11.4.8.1 South Korea Keratin Market by Type
11.4.8.2 South Korea Keratin Market by Product
11.4.8.3 South Korea Keratin Market by Application
11.4.9 Vietnam
11.4.9.1 Vietnam Keratin Market by Type
11.4.9.2 Vietnam Keratin Market by Product
11.4.9.3 Vietnam Keratin Market by Application
11.4.10 Singapore
11.4.10.1 Singapore Keratin Market by Type
11.4.10.2 Singapore Keratin Market by Product
11.4.10.3 Singapore Keratin Market by Application
11.4.11 Australia
11.4.11.1 Australia Keratin Market by Type
11.4.11.2 Australia Keratin Market by Product
11.4.11.3 Australia Keratin Market by Application
11.4.12 Rest of Asia-Pacific
11.4.12.1 Rest of Asia-Pacific Keratin Market by Type
11.4.12.2 Rest of Asia-Pacific Keratin Market by Product
11.4.12.3 Rest of Asia-Pacific Keratin Market by Application
11.5 Middle East & Africa
11.5.1 Middle East
11.5.1.1 Middle East Keratin Market by Country
11.5.1.2 Middle East Keratin Market by Type
11.5.1.3 Middle East Keratin Market by Product
11.5.1.4 Middle East Keratin Market by Application
11.5.1.5 UAE
11.5.1.5.1 UAE Keratin Market by Type
11.5.1.5.2 UAE Keratin Market by Product
11.5.1.5.3 UAE Keratin Market by Application
11.5.1.6 Egypt
11.5.1.6.1 Egypt Keratin Market by Type
11.5.1.6.2 Egypt Keratin Market by Product
11.5.1.6.3 Egypt Keratin Market by Application
11.5.1.7 Saudi Arabia
11.5.1.7.1 Saudi Arabia Keratin Market by Type
11.5.1.7.2 Saudi Arabia Keratin Market by Product
11.5.1.7.3 Saudi Arabia Keratin Market by Application
11.5.1.8 Qatar
11.5.1.8.1 Qatar Keratin Market by Type
11.5.1.8.2 Qatar Keratin Market by Product
11.5.1.8.3 Qatar Keratin Market by Application
11.5.1.9 Rest of Middle East
11.5.1.9.1 Rest of Middle East Keratin Market by Type
11.5.1.9.2 Rest of Middle East Keratin Market by Product
11.5.1.9.3 Rest of Middle East Keratin Market by Application
11.5.2 Africa
11.5.2.1 Africa Keratin Market by Country
11.5.2.2 Africa Keratin Market by Type
11.5.2.3 Africa Keratin Market by Product
11.5.2.4 Africa Keratin Market by Application
11.5.2.5 Nigeria
11.5.2.5.1 Nigeria Keratin Market by Type
11.5.2.5.2 Nigeria Keratin Market by Product
11.5.2.5.3 Nigeria Keratin Market by Application
11.5.2.6 South Africa
11.5.2.6.1 South Africa Keratin Market by Type
11.5.2.6.2 South Africa Keratin Market by Product
11.5.2.6.3 South Africa Keratin Market by Application
11.5.2.7 Rest of Africa
11.5.2.7.1 Rest of Africa Keratin Market by Type
11.5.2.7.2 Rest of Africa Keratin Market by Product
11.5.2.7.3 Rest of Africa Keratin Market by Application
11.6 Latin America
11.6.1 Latin America Keratin Market by Country
11.6.2 Latin America Keratin Market by Type
11.6.3 Latin America Keratin Market by Product
11.6.4 Latin America Keratin Market by Application
11.6.5 Brazil
11.6.5.1 Brazil Keratin Market by Type
11.6.5.2 Brazil Keratin Market by Product
11.6.5.3 Brazil Keratin Market by Application
11.6.6 Argentina
11.6.6.1 Argentina Keratin Market by Type
11.6.6.2 Argentina Keratin Market by Product
11.6.6.3 Argentina Keratin Market by Application
11.6.7 Colombia
11.6.7.1 Colombia Keratin Market by Type
11.6.7.2 Colombia Keratin Market by Product
11.6.7.3 Colombia Keratin Market by Application
11.6.8 Rest of Latin America
11.6.8.1 Rest of Latin America Keratin Market by Type
11.6.8.2 Rest of Latin America Keratin Market by Product
11.6.8.3 Rest of Latin America Keratin Market by Application
12. Company profile
12.1 BASF SE
12.1.1 Company Overview
12.1.2 Financial
12.1.3 Products/ Services Offered
12.1.4 SWOT Analysis
12.1.5 The SNS View
12.2 Keraplast
12.2.1 Company Overview
12.2.2 Financials
12.2.3 Products/ Services Offered
12.2.4 SWOT Analysis
12.2.5 The SNS View
12.3 Proteina
12.3.1 Company Overview
12.3.2 Financials
12.3.3 Products/ Services Offered
12.3.4 SWOT Analysis
12.3.5 The SNS View
12.4 Rejuvenol
12.4.1 Company Overview
12.4.2 Financials
12.4.3 Products/ Services Offered
12.4.4 SWOT Analysis
12.4.5 The SNS View
12.5 Making Cosmetics Inc.
12.5.1 Company Overview
12.5.2 Financials
12.5.3 Products/ Services Offered
12.5.4 SWOT Analysis
12.5.5 The SNS View
12.6 Hefei TNJ Chemical Industry Co. Ltd.
12.6.1 Company Overview
12.6.2 Financials
12.6.3 Products/ Services Offered
12.6.4 SWOT Analysis
12.6.5 The SNS View
12.7 Greentech
12.7.1 Company Overview
12.7.2 Financials
12.7.3 Products/ Services Offered
12.7.4 SWOT Analysis
12.7.5 The SNS View
12.8 Keratin Express
12.8.1 Company Overview
12.8.2 Financials
12.8.3 Products/ Services Offered
12.8.4 SWOT Analysis
12.8.5 The SNS View
12.9 Clariant
12.9.1 Company Overview
12.9.2 Financials
12.9.3 Products/ Services Offered
12.9.4 SWOT Analysis
12.9.5 The SNS View
12.10 Kerline Srl
12.10.1 Company Overview
12.10.2 Financials
12.10.3 Products/ Services Offered
12.10.4 SWOT Analysis
12.10.5 The SNS View
12.11 Roxlor
12.11.1 Company Overview
12.11.2 Financials
12.11.3 Products/ Services Offered
12.11.4 SWOT Analysis
12.11.5 The SNS View
12.12 NutriScience Innovations LLC
12.12.1 Company Overview
12.12.2 Financials
12.12.3 Products/ Services Offered
12.12.4 SWOT Analysis
12.12.5 The SNS View
13. Competitive Landscape
13.1 Competitive Benchmarking
13.2 Market Share Analysis
13.3 Recent Developments
13.3.1 Industry News
13.3.2 Company News
13.3.3 Mergers & Acquisitions
14. Use Case and Best Practices
15. Conclusion
An accurate research report requires proper strategizing as well as implementation. There are multiple factors involved in the completion of good and accurate research report and selecting the best methodology to compete the research is the toughest part. Since the research reports we provide play a crucial role in any company’s decision-making process, therefore we at SNS Insider always believe that we should choose the best method which gives us results closer to reality. This allows us to reach at a stage wherein we can provide our clients best and accurate investment to output ratio.
Each report that we prepare takes a timeframe of 350-400 business hours for production. Starting from the selection of titles through a couple of in-depth brain storming session to the final QC process before uploading our titles on our website we dedicate around 350 working hours. The titles are selected based on their current market cap and the foreseen CAGR and growth.
The 5 steps process:
Step 1: Secondary Research:
Secondary Research or Desk Research is as the name suggests is a research process wherein, we collect data through the readily available information. In this process we use various paid and unpaid databases which our team has access to and gather data through the same. This includes examining of listed companies’ annual reports, Journals, SEC filling etc. Apart from this our team has access to various associations across the globe across different industries. Lastly, we have exchange relationships with various university as well as individual libraries.

Step 2: Primary Research
When we talk about primary research, it is a type of study in which the researchers collect relevant data samples directly, rather than relying on previously collected data. This type of research is focused on gaining content specific facts that can be sued to solve specific problems. Since the collected data is fresh and first hand therefore it makes the study more accurate and genuine.
We at SNS Insider have divided Primary Research into 2 parts.
Part 1 wherein we interview the KOLs of major players as well as the upcoming ones across various geographic regions. This allows us to have their view over the market scenario and acts as an important tool to come closer to the accurate market numbers. As many as 45 paid and unpaid primary interviews are taken from both the demand and supply side of the industry to make sure we land at an accurate judgement and analysis of the market.
This step involves the triangulation of data wherein our team analyses the interview transcripts, online survey responses and observation of on filed participants. The below mentioned chart should give a better understanding of the part 1 of the primary interview.

Part 2: In this part of primary research the data collected via secondary research and the part 1 of the primary research is validated with the interviews from individual consultants and subject matter experts.
Consultants are those set of people who have at least 12 years of experience and expertise within the industry whereas Subject Matter Experts are those with at least 15 years of experience behind their back within the same space. The data with the help of two main processes i.e., FGDs (Focused Group Discussions) and IDs (Individual Discussions). This gives us a 3rd party nonbiased primary view of the market scenario making it a more dependable one while collation of the data pointers.
Step 3: Data Bank Validation
Once all the information is collected via primary and secondary sources, we run that information for data validation. At our intelligence centre our research heads track a lot of information related to the market which includes the quarterly reports, the daily stock prices, and other relevant information. Our data bank server gets updated every fortnight and that is how the information which we collected using our primary and secondary information is revalidated in real time.

Step 4: QA/QC Process
After all the data collection and validation our team does a final level of quality check and quality assurance to get rid of any unwanted or undesired mistakes. This might include but not limited to getting rid of the any typos, duplication of numbers or missing of any important information. The people involved in this process include technical content writers, research heads and graphics people. Once this process is completed the title gets uploader on our platform for our clients to read it.
Step 5: Final QC/QA Process:
This is the last process and comes when the client has ordered the study. In this process a final QA/QC is done before the study is emailed to the client. Since we believe in giving our clients a good experience of our research studies, therefore, to make sure that we do not lack at our end in any way humanly possible we do a final round of quality check and then dispatch the study to the client.
Conformal Coatings Market size was valued at USD 950.5 million in 2022. It is expected to grow to USD 1480.99 million by 2030 and grow at a CAGR of 5.7% over the forecast period of 2023-2030.
The Silicone Fabrics Market Size was valued at USD 4.37 billion in 2022, and is expected to reach USD 7.41 billion by 2030, and grow at a CAGR of 6.8% over the forecast period 2023-2030.
Specialty Tapes Market Size was valued at USD 55.42 billion in 2023 and is expected to reach USD 90.55 billion by 2031 and grow at a CAGR of 6.3% over the forecast period 2024-2031.
The Biofertilizers Market size was USD 3.2 billion in 2023 and is expected to Reach USD 7.31 billion by 2031 and grow at a CAGR of 10.8% over the forecast period of 2024-2031.
The Insulating Glass Window Market Size was valued at USD 13.50 billion in 2022, and is expected to reach USD 22 billion by 2030, and grow at a CAGR of 6.3% over the forecast period 2023-2030.
The Offshore Drilling Fluid Market Size was valued at USD 7.83 billion in 2022 and is expected to reach USD 11.05 billion by 2030, and grow at a CAGR of 4.4% over the forecast period 2023-2030

Hi! Click one of our member below to chat on Phone
© 2024 All Rights Reserved by SNS Insider Pvt Ltd