Biofertilizers Market Report Scope & Overview:
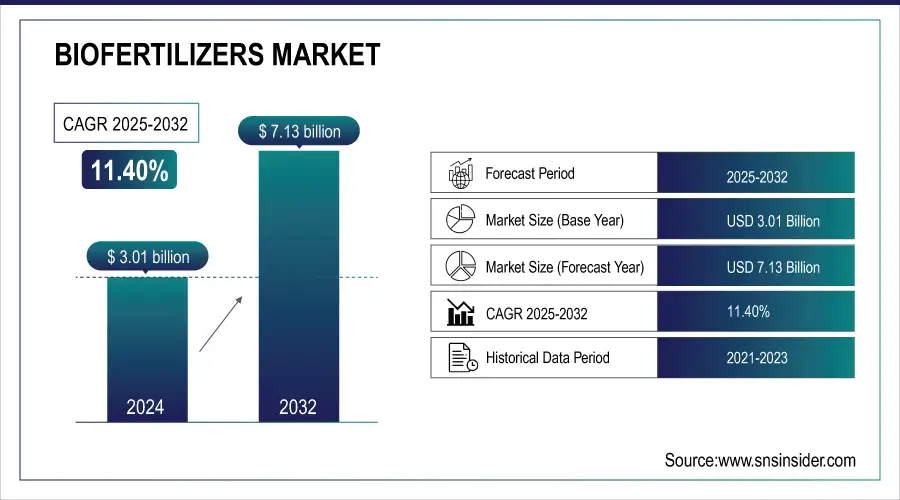
The Biofertilizers Market size was valued at USD 3.01 Billion in 2024. It is expected to grow to USD 7.13 Billion by 2032 and grow at a CAGR of 11.40% over the forecast period of 2025-2032.

Get E-PDF Sample Report on Biofertilizers Market - Request Sample Report
Biofertilizers contain living microorganisms that enhance plant growth by providing nutrients or stimulating growth, offering an eco-friendly alternative to synthetic fertilizers. Overuse of chemical fertilizers causes soil degradation, water pollution, and biodiversity loss, leading to eutrophication, harmful algal blooms, and hypoxic zones in water bodies, affecting aquatic life. Biofertilizers improve soil microbiology, nutrient cycling, and structure, increase crop yields, and reduce greenhouse gas emissions. Advances in microbial science, such as encapsulation and controlled-release technologies, protect microbes and optimize nutrient delivery over time. According to the FAO, these innovations make biofertilizers a scalable alternative, improving nutrient use efficiency by 20–30% compared to traditional fertilizers, while minimizing environmental impact.

Key Biofertilizers Market Trends
-
Rising adoption of biofertilizers in organic farming to meet increasing consumer demand for chemical-free produce.
-
Integration of multi-strain and consortia-based biofertilizers for enhanced nutrient efficiency and stress resistance.
-
Expansion of liquid and foliar biofertilizer formulations for easier application and faster crop response.
-
Growing use of biofertilizers in high-value crops like fruits, vegetables, and horticulture for yield improvement.
-
Strategic partnerships between biotech startups and agrochemical companies to expand distribution networks.
-
Increasing government incentives and subsidies promoting sustainable agriculture practices using biofertilizers.
-
Advancements in carrier materials to improve shelf-life and microbial viability under varied storage conditions.
-
Rising awareness of climate-smart agriculture driving adoption of biofertilizers to reduce carbon footprint in farming.
Biofertilizers Market Growth Drivers
-
Rising potential benefits of biofertilizers among Farmers
-
Rising government support for organic farming drives the market growth.
Governments worldwide are promoting organic farming to enhance environmental sustainability, support rural livelihoods, and meet growing demand for organic produce. Programs, subsidies, and certification support encourage farmers to adopt biofertilizers over synthetic inputs, improving soil health and biodiversity. For example, under the EU’s CAP reform in 2023, about €40 billion was allocated for eco-schemes, including organic management, aiming to expand organic farming to 25% of total agricultural land by 2030. Government aid covers certification costs and provides resources for transitioning from conventional to organic practices, driving demand for biofertilizers and other organic inputs, while reducing agriculture’s environmental footprint and fostering sustainable farming practices globally.
Biofertilizers Market Growth Restraints
-
High production costs associated with biofertilizers which hamper the market growth.
The high production cost of biofertilizers limits their adoption among small and medium farmers in developing countries. Producing biofertilizers requires cultivating microbial strains under controlled conditions, demanding advanced equipment and skilled labor. Techniques like encapsulation and controlled-release further increase manufacturing complexity and expenses to ensure stability and effectiveness. Unlike synthetic fertilizers, which benefit from economies of scale, biofertilizer manufacturers face challenges in scaling production without incurring extra costs to maintain quality and standards. These factors make biofertilizers comparatively expensive, restricting widespread use despite their environmental benefits and potential to improve soil health and crop yields in sustainable agricultural practices.
Biofertilizers Market Segment Highlights
-
By Application
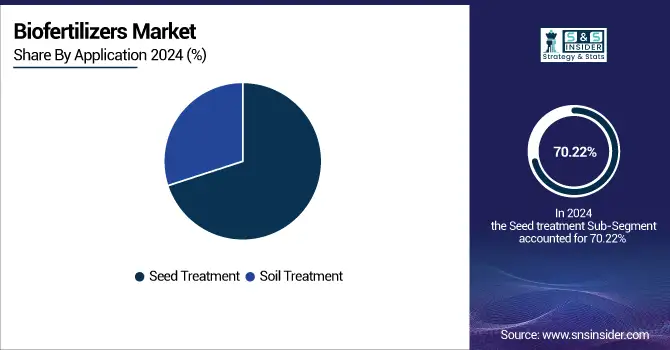
Seed treatment accounted for approximately 70.22% of the market in 2024. This method improves soil health and nutrient availability by introducing beneficial microbes before planting, enabling them to establish and enhance nutrient cycling. Biofertilizers applied during seed treatment increase soil porosity, structure, and nutrient content, particularly nitrogen and phosphorus, crucial for plant growth. They also promote microbial biodiversity and reduce chemical fertilizer dependence, supporting sustainable agriculture. Effective in restoring degraded soils and boosting crop productivity, seed treatment with biofertilizers has become the preferred application method, driving its dominance in the biofertilizers market globally.

-
By Product
The nitrogen-fixing segment accounted for about 44.23% of the market in 2024. Nitrogen is essential for plant protein and chlorophyll synthesis, but most crops cannot directly assimilate atmospheric nitrogen. Nitrogen-fixing biofertilizers contain beneficial bacteria that convert atmospheric nitrogen into plant-usable forms, reducing reliance on industrial nitrogen fertilizers. They are widely applied in legumes, cereals, and vegetables, delivering high yields efficiently. These biofertilizers are safe, eco-friendly, and do not harm soil technology or the environment. Their effectiveness, rapid action, and ability to enhance crop productivity sustainably have driven strong market adoption, positioning nitrogen-fixing biofertilizers as a vital tool in modern, environmentally responsible agriculture.
-
By Crop Type
The cereals and grains segment held roughly 40% of the market in 2024. Biofertilizers are essential for cereal and grain cultivation, enhancing growth, photosynthesis, and yield through phosphate-solubilizing bacteria and Azotobacter inoculation. Increasing global demand for oilseeds and pulses, such as soybean, sunflower, and groundnuts, has boosted biofertilizer applications in these crops. Innovations in microbiological research help determine the optimal composition of biofertilizers for wheat and other cereals. This combination of growing crop demand, technological advancements, and efficiency improvements is expected to drive substantial global market growth in the cereals and grains segment throughout the forecast period.
Biofertilizers Market Regional Analysis
North America Biofertilizers Market Insights
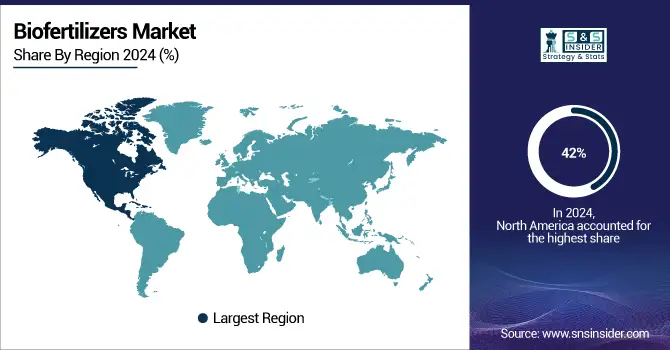
North America held the largest market share around 42% in 2024. The largest and fastest-growing market is the United States, followed by Canada. The major reasons propelling the market include favorable government laws, an easy registration process, and a rising number of organic farms. Sinorhizobium, Azorhizobium, Allorhizobium, and others are the most common genera utilized as biofertilizers in North America. According to The World of Organic Agriculture, nearly 3.5 million hectares of farmland in North America will be managed organically by 2021. There were 2.3 million in the United States and 1.2 million in Canada.

Get Customized Report as Per Your Business Requirement - Request For Customized Report
Europe Biofertilizers Market Insights
During the forecast period of 2025 to 2032, the European market is estimated to develop at a CAGR of 11.9%. The European Union is constantly supporting biofertilizers since they are cost-effective, recommending farmers optimize the application of chemical fertilizers or replace them entirely or partially with eco-friendly fertilizers to achieve greater economic returns.
Asia Pacific Biofertilizers Market Insights
The Asia-Pacific market is predicted to grow at a 10.8% CAGR during the forecast period. China is the largest consumer of biofertilizers, followed by India and Japan. The biofertilizers market in India is predicted to rise, owing to increased farmer awareness of the benefits of biofertilizers on soil health, as well as the central government's attempt to organize the country's biofertilizers industry by bringing it under the authority of fertilizer laws.
Competitive Landscape for Biofertilizers Market:
Koppert Biological Systems Inc. was founded in 1967 and is headquartered in the Netherlands. Koppert Biological Systems specializes in sustainable agriculture solutions, focusing on biological crop protection, pollination, and soil health. Their offerings include beneficial insects, mites, nematodes, and microbial-based fertilizers. The company enhances plant growth naturally, promotes biodiversity, and reduces reliance on chemical fertilizers. Koppert serves growers globally, providing integrated solutions that improve productivity, soil fertility, and crop quality while supporting environmentally friendly farming practices.
-
In June 2025, Koppert partnered with Acadian Seaplants to expand biostimulant access, combining expertise in biological crop protection and marine-based nutrient solutions for enhanced crop performance.
Lallemand Inc. was established in 1917 and based in Canada, Lallemand Inc. is a global leader in yeast and bacteria-based solutions. Its plant care division develops biofertilizers, biocontrol agents, and biostimulants that enhance nitrogen fixation, phosphorus solubilization, and overall soil health. Lallemand focuses on sustainable agriculture, improving crop yield, and reducing environmental impact. Their solutions are applied across cereals, vegetables, and horticultural crops, supporting global food production with innovative microbial technologies.
-
In November 2023, Lallemand Plant Care partnered with New Edge Microbials to expand biological farm input solutions across North and South America and Europe.
BioConsortia was founded in 2014 and headquartered in the United States, BioConsortia develops advanced microbial agricultural solutions to improve crop yield and sustainability. The company uses genomics and directed selection to design microbial communities that enhance nutrient uptake, plant resilience, and soil health. Their portfolio includes biofertilizers for nitrogen fixation, phosphorus solubilization, and growth promotion in cereals, vegetables, and specialty crops. BioConsortia’s solutions reduce synthetic fertilizer dependency while boosting agricultural productivity.
-
In March 2025, BioConsortia secured Series E funding to accelerate commercialization of microbial solutions and expand their presence in global agriculture markets.
Pivot Bio was founded in 2014 and is based in the United States. Pivot Bio focuses on microbial nitrogen fertilizers to replace synthetic nitrogen inputs. Their engineered microbes provide crops with accessible nitrogen, enhancing yield and reducing environmental pollution. Pivot Bio’s solutions target maize, wheat, and other row crops, promoting sustainable farming and soil fertility. The company emphasizes innovation, crop-specific formulations, and scalable solutions to support environmentally responsible agriculture globally.
-
In June 2025, Pivot Bio reported record-breaking performance in 2024, delivering significant value to farmers while strengthening U.S. agricultural supply chains.
Biofertilizers Market Key Players
-
BioConsortia
-
Pivot Bio
-
Anand Agro Care
-
Chaitanya Biologicals Pvt. Ltd
-
BHOOJEEVAN ORGANICS PVT. LTD
-
Clean & Green Recycling Corp.
-
California Organic Fertilizers Inc.
-
Suståne Natural Fertilizer, Inc.
-
Nature Safe
-
Indogulf BioAg LLC
-
Benefert B.V.
-
Fertoz
-
Symborg Inc.
-
T. Stanes and Company Limited
-
Acadian Seaplants Limited
-
BioFert Manufacturing Inc.
-
Nurture Growth Bio-Fertilizer
-
Agri Organics
Report Attributes | Details |
Market Size in 2024 | US$ 3.01 Billion |
Market Size by 2032 | US$ 7.13 Billion |
CAGR | CAGR of 11.40% From 2025 to 2032 |
Base Year | 2024 |
Forecast Period | 2025- 2032 |
Historical Data | 2021-2023 |
Report Scope & Coverage | Market Size, Segments Analysis, Competitive Landscape, Regional Analysis, DROC & SWOT Analysis, Forecast Outlook |
Key Segments | •By Product (Nitrogen Fixing, Phosphate Solubilizing, Others) •By Crop Type (Row Crops, Horticultural Crops, Cash Crops) •By Application (Seed Treatment, Soil treatment) |
Regional Analysis/Coverage | North America (US, Canada, Mexico), Europe (Eastern Europe [Poland, Romania, Hungary, Turkey, Rest of Eastern Europe] Western Europe] Germany, France, UK, Italy, Spain, Netherlands, Switzerland, Austria, Rest of Western Europe]), Asia Pacific (China, India, Japan, South Korea, Vietnam, Singapore, Australia, Rest of Asia Pacific), Middle East & Africa (Middle East [UAE, Egypt, Saudi Arabia, Qatar, Rest of Middle East], Africa [Nigeria, South Africa, Rest of Africa], Latin America (Brazil, Argentina, Colombia Rest of Latin America) |
Company Profiles |
Koppert Biological Systems Inc., Lallemand Inc., BioConsortia, Pivot Bio, Anand Agro Care, Chaitanya Biologicals Pvt. Ltd, BHOOJEEVAN ORGANICS PVT. LTD, Clean & Green Recycling Corp., California Organic Fertilizers Inc., Suståne Natural Fertilizer, Inc., Nature Safe, Indogulf BioAg LLC, Benefert B.V., Fertoz, Symborg Inc., T. Stanes and Company Limited, Acadian Seaplants Limited, BioFert Manufacturing Inc., Nurture Growth Bio-Fertilizer, and Agri Organics |
Table Of Contents
1. Introduction
1.1 Market Definition & Scope
1.2 Research Assumptions & Abbreviations
1.3 Research Methodology
2. Executive Summary
2.1 Market Snapshot
2.2 Market Absolute $ Opportunity Assessment & Y-o-Y Analysis, 2021–2032
2.3 Market Size & Forecast, By Segmentation, 2021–2032
2.3.1 Market Size By Product
2.3.2 Market Size By Crop Type
2.3.3 Market Size By Application
2.4 Market Share & Bps Analysis By Region, 2024
2.5 Industry Growth Scenarios – Conservative, Likely & Optimistic
2.6 Industry CxO’s Perspective
3. Market Overview
3.1 Market Dynamics
3.1.1 Drivers
3.1.2 Restraints
3.1.3 Opportunities
3.1.4 Key Market Trends
3.2 Industry PESTLE Analysis
3.3 Key Industry Forces (Porter’s) Impacting Market Growth
3.4 Industry Supply Chain Analysis
3.4.1 Raw Material Suppliers
3.4.2 Manufacturers
3.4.3 Distributors/Suppliers
3.4.4 Customers/End-Users
3.5 Industry Life Cycle Assessment
3.6 Parent Market Overview
3.7 Market Risk Assessment
4. Statistical Insights & Trends Reporting
4.1 Pricing Analysis & Forecast
4.1.1 Overview
4.1.2 Pricing Analysis & Forecast By Product, 2021–2032
4.1.3 Price Benchmarking By Key Players, 2024
4.2 Regulatory Landscape
4.2.1 Overview
4.2.2 Regulatory Trends By Key Countries
4.2.3 Regulatory Outlook By Product Type
4.3 Trade Analysis
4.3.1 Overview
4.3.2 Import Analysis (Value & Volume), By Country, 2021–2024
4.3.3 Export Analysis (Value & Volume), By Country, 2021–2024
4.3.4 Major Importing Countries
4.3.5 Major Exporting Countries
5. Biofertilizers Market Segmental Analysis & Forecast, By Product, 2021 – 2032, Value (USD Billion) & Volume
5.1 Introduction
5.2 Nitrogen Fixing
5.2.1 Key Trends
5.2.2 Market Size & Forecast, 2021 – 2032
5.3 Phosphate Solubilizing
5.3.1 Key Trends
5.3.2 Market Size & Forecast, 2021 – 2032
5.4 Others
5.4.1 Key Trends
5.4.2 Market Size & Forecast, 2021 – 2032
6. Biofertilizers Market Segmental Analysis & Forecast, By Crop Type, 2021 – 2032, Value (USD Billion) & Volume
6.1 Introduction
6.2 Cereals & Grains
6.2.1 Key Trends
6.2.2 Market Size & Forecast, 2021 – 2032
6.3 Oilseeds & Pulses
6.3.1 Key Trends
6.3.2 Market Size & Forecast, 2021 – 2032
6.4 Fruits & Vegetables
6.4.1 Key Trends
6.4.2 Market Size & Forecast, 2021 – 2032
6.5 Others
6.5.1 Key Trends
6.5.2 Market Size & Forecast, 2021 – 2032
7. Biofertilizers Market Segmental Analysis & Forecast, By Application, 2021 – 2032, Value (USD Billion) & Volume
7.1 Introduction
7.2 Seed Treatment
7.2.1 Key Trends
7.2.2 Market Size & Forecast, 2021 – 2032
7.3 Soil treatment
7.3.1 Key Trends
7.3.2 Market Size & Forecast, 2021 – 2032
8. Biofertilizers Market Segmental Analysis & Forecast By Region, 2021 – 2025, Value (USD Billion) & Volume
8.1 Introduction
8.2 North America
8.2.1 Key Trends
8.2.2 Biofertilizers Market Size & Forecast, By Product, 2021 – 2032
8.2.3 Biofertilizers Market Size & Forecast, By Crop Type, 2021 – 2032
8.2.4 Biofertilizers Market Size & Forecast, By Application, 2021 – 2032
8.2.5 Biofertilizers Market Size & Forecast, By Country, 2021 – 2032
8.2.5.1 USA
8.2.5.1.1 Biofertilizers Market Size & Forecast, By Product, 2021 – 2032
8.2.5.1.2 Biofertilizers Market Size & Forecast, By Crop Type, 2021 – 2032
8.2.5.1.3 Biofertilizers Market Size & Forecast, By Application, 2021 – 2032
8.2.5.2 Canada
8.2.5.2.1 Biofertilizers Market Size & Forecast, By Product, 2021 – 2032
8.2.5.2.2 Biofertilizers Market Size & Forecast, By Crop Type, 2021 – 2032
8.2.5.2.3 Biofertilizers Market Size & Forecast, By Application, 2021 – 2032
8.3 Europe
8.3.1 Key Trends
8.3.2 Biofertilizers Market Size & Forecast, By Product, 2021 – 2032
8.3.3 Biofertilizers Market Size & Forecast, By Crop Type, 2021 – 2032
8.3.4 Biofertilizers Market Size & Forecast, By Application, 2021 – 2032
8.3.5 Biofertilizers Market Size & Forecast, By Country, 2021 – 2032
8.3.5.1 Germany
8.3.5.1.1 Biofertilizers Market Size & Forecast, By Product, 2021 – 2032
8.3.5.1.2 Biofertilizers Market Size & Forecast, By Crop Type, 2021 – 2032
8.3.5.1.3 Biofertilizers Market Size & Forecast, By Application, 2021 – 2032
8.3.5.2 UK
8.3.5.2.1 Biofertilizers Market Size & Forecast, By Product, 2021 – 2032
8.3.5.2.2 Biofertilizers Market Size & Forecast, By Crop Type, 2021 – 2032
8.3.5.2.3 Biofertilizers Market Size & Forecast, By Application, 2021 – 2032
8.3.5.3 France
8.3.5.3.1 Biofertilizers Market Size & Forecast, By Product, 2021 – 2032
8.3.5.3.2 Biofertilizers Market Size & Forecast, By Crop Type, 2021 – 2032
8.3.5.3.3 Biofertilizers Market Size & Forecast, By Application, 2021 – 2032
8.3.5.4 Italy
8.3.5.4.1 Biofertilizers Market Size & Forecast, By Product, 2021 – 2032
8.3.5.4.2 Biofertilizers Market Size & Forecast, By Crop Type, 2021 – 2032
8.3.5.4.3 Biofertilizers Market Size & Forecast, By Application, 2021 – 2032
8.3.5.5 Spain
8.3.5.5.1 Biofertilizers Market Size & Forecast, By Product, 2021 – 2032
8.3.5.5.2 Biofertilizers Market Size & Forecast, By Crop Type, 2021 – 2032
8.3.5.5.3 Biofertilizers Market Size & Forecast, By Application, 2021 – 2032
8.3.5.6 Russia
8.3.5.6.1 Biofertilizers Market Size & Forecast, By Product, 2021 – 2032
8.3.5.6.2 Biofertilizers Market Size & Forecast, By Crop Type, 2021 – 2032
8.3.5.6.3 Biofertilizers Market Size & Forecast, By Application, 2021 – 2032
8.3.5.7 Poland
8.3.5.7.1 Biofertilizers Market Size & Forecast, By Product, 2021 – 2032
8.3.5.7.2 Biofertilizers Market Size & Forecast, By Crop Type, 2021 – 2032
8.3.5.7.3 Biofertilizers Market Size & Forecast, By Application, 2021 – 2032
8.3.5.8 Rest of Europe
8.3.5.8.1 Biofertilizers Market Size & Forecast, By Product, 2021 – 2032
8.3.5.8.2 Biofertilizers Market Size & Forecast, By Crop Type, 2021 – 2032
8.3.5.8.3 Biofertilizers Market Size & Forecast, By Application, 2021 – 2032
8.4 Asia-Pacific
8.4.1 Key Trends
8.4.2 Biofertilizers Market Size & Forecast, By Product, 2021 – 2032
8.4.3 Biofertilizers Market Size & Forecast, By Crop Type, 2021 – 2032
8.4.4 Biofertilizers Market Size & Forecast, By Application, 2021 – 2032
8.4.5 Biofertilizers Market Size & Forecast, By Country, 2021 – 2032
8.4.5.1 China
8.4.5.1.1 Biofertilizers Market Size & Forecast, By Product, 2021 – 2032
8.4.5.1.2 Biofertilizers Market Size & Forecast, By Crop Type, 2021 – 2032
8.4.5.1.3 Biofertilizers Market Size & Forecast, By Application, 2021 – 2032
8.4.5.2 India
8.4.5.2.1 Biofertilizers Market Size & Forecast, By Product, 2021 – 2032
8.4.5.2.2 Biofertilizers Market Size & Forecast, By Crop Type, 2021 – 2032
8.4.5.2.3 Biofertilizers Market Size & Forecast, By Application, 2021 – 2032
8.4.5.3 Japan
8.4.5.3.1 Biofertilizers Market Size & Forecast, By Product, 2021 – 2032
8.4.5.3.2 Biofertilizers Market Size & Forecast, By Crop Type, 2021 – 2032
8.4.5.3.3 Biofertilizers Market Size & Forecast, By Application, 2021 – 2032
8.4.5.4 South Korea
8.4.5.4.1 Biofertilizers Market Size & Forecast, By Product, 2021 – 2032
8.4.5.4.2 Biofertilizers Market Size & Forecast, By Crop Type, 2021 – 2032
8.4.5.4.3 Biofertilizers Market Size & Forecast, By Application, 2021 – 2032
8.4.5.5 Australia
8.4.5.5.1 Biofertilizers Market Size & Forecast, By Product, 2021 – 2032
8.4.5.5.2 Biofertilizers Market Size & Forecast, By Crop Type, 2021 – 2032
8.4.5.5.3 Biofertilizers Market Size & Forecast, By Application, 2021 – 2032
8.4.5.6 ASEAN Countries
8.4.5.6.1 Biofertilizers Market Size & Forecast, By Product, 2021 – 2032
8.4.5.6.2 Biofertilizers Market Size & Forecast, By Crop Type, 2021 – 2032
8.4.5.6.3 Biofertilizers Market Size & Forecast, By Application, 2021 – 2032
8.4.5.7 Rest of Asia-Pacific
8.4.5.7.1 Biofertilizers Market Size & Forecast, By Product, 2021 – 2032
8.4.5.7.2 Biofertilizers Market Size & Forecast, By Crop Type, 2021 – 2032
8.4.5.7.3 Biofertilizers Market Size & Forecast, By Application, 2021 – 2032
8.5 Latin America
8.5.1 Key Trends
8.5.2 Biofertilizers Market Size & Forecast, By Product, 2021 – 2032
8.5.3 Biofertilizers Market Size & Forecast, By Crop Type, 2021 – 2032
8.5.4 Biofertilizers Market Size & Forecast, By Application, 2021 – 2032
8.5.5 Biofertilizers Market Size & Forecast, By Country, 2021 – 2032
8.5.5.1 Brazil
8.5.5.1.1 Biofertilizers Market Size & Forecast, By Product, 2021 – 2032
8.5.5.1.2 Biofertilizers Market Size & Forecast, By Crop Type, 2021 – 2032
8.5.5.1.3 Biofertilizers Market Size & Forecast, By Application, 2021 – 2032
8.5.5.2 Argentina
8.5.5.2.1 Biofertilizers Market Size & Forecast, By Product, 2021 – 2032
8.5.5.2.2 Biofertilizers Market Size & Forecast, By Crop Type, 2021 – 2032
8.5.5.2.3 Biofertilizers Market Size & Forecast, By Application, 2021 – 2032
8.5.5.3 Mexico
8.5.5.3.1 Biofertilizers Market Size & Forecast, By Product, 2021 – 2032
8.5.5.3.2 Biofertilizers Market Size & Forecast, By Crop Type, 2021 – 2032
8.5.5.3.3 Biofertilizers Market Size & Forecast, By Application, 2021 – 2032
8.5.5.4 Colombia
8.5.5.4.1 Biofertilizers Market Size & Forecast, By Product, 2021 – 2032
8.5.5.4.2 Biofertilizers Market Size & Forecast, By Crop Type, 2021 – 2032
8.5.5.4.3 Biofertilizers Market Size & Forecast, By Application, 2021 – 2032
8.5.5.5 Rest of Latin America
8.5.5.5.1 Biofertilizers Market Size & Forecast, By Product, 2021 – 2032
8.5.5.5.2 Biofertilizers Market Size & Forecast, By Crop Type, 2021 – 2032
8.5.5.5.3 Biofertilizers Market Size & Forecast, By Application, 2021 – 2032
8.6 Middle East & Africa
8.6.1 Key Trends
8.6.2 Biofertilizers Market Size & Forecast, By Product, 2021 – 2032
8.6.3 Biofertilizers Market Size & Forecast, By Crop Type, 2021 – 2032
8.6.4 Biofertilizers Market Size & Forecast, By Application, 2021 – 2032
8.6.5 Biofertilizers Market Size & Forecast, By Country, 2021 – 2032
8.6.5.1 UAE
8.6.5.1.1 Biofertilizers Market Size & Forecast, By Product, 2021 – 2032
8.6.5.1.2 Biofertilizers Market Size & Forecast, By Crop Type, 2021 – 2032
8.6.5.1.3 Biofertilizers Market Size & Forecast, By Application, 2021 – 2032
8.6.5.2 Saudi Arabia
8.6.5.2.1 Biofertilizers Market Size & Forecast, By Product, 2021 – 2032
8.6.5.2.2 Biofertilizers Market Size & Forecast, By Crop Type, 2021 – 2032
8.6.5.2.3 Biofertilizers Market Size & Forecast, By Application, 2021 – 2032
8.6.5.3 Qatar
8.6.5.3.1 Biofertilizers Market Size & Forecast, By Product, 2021 – 2032
8.6.5.3.2 Biofertilizers Market Size & Forecast, By Crop Type, 2021 – 2032
8.6.5.3.3 Biofertilizers Market Size & Forecast, By Application, 2021 – 2032
8.6.5.4 Egypt
8.6.5.4.1 Biofertilizers Market Size & Forecast, By Product, 2021 – 2032
8.6.5.4.2 Biofertilizers Market Size & Forecast, By Crop Type, 2021 – 2032
8.6.5.4.3 Biofertilizers Market Size & Forecast, By Application, 2021 – 2032
8.6.5.5 South Africa
8.6.5.5.1 Biofertilizers Market Size & Forecast, By Product, 2021 – 2032
8.6.5.5.2 Biofertilizers Market Size & Forecast, By Crop Type, 2021 – 2032
8.6.5.5.3 Biofertilizers Market Size & Forecast, By Application, 2021 – 2032
8.6.5.6 Rest of Middle East & Africa
8.6.5.6.1 Biofertilizers Market Size & Forecast, By Product, 2021 – 2032
8.6.5.6.2 Biofertilizers Market Size & Forecast, By Crop Type, 2021 – 2032
8.6.5.6.3 Biofertilizers Market Size & Forecast, By Application, 2021 – 2032
9. Competitive Landscape
9.1 Key Players' Positioning
9.2 Competitive Developments
9.2.1 Key Strategies Adopted (%), By Key Players, 2024
9.2.2 Year-Wise Strategies & Development, 2021 – 2025
9.2.3 Number Of Strategies Adopted By Key Players, 2024
9.3 Market Share Analysis, 2024
9.4 Product/Service & Crop Type Benchmarking
9.4.1 Product/Service Specifications & Features By Key Players
9.4.2 Product/Service Heatmap By Key Players
9.4.3 Crop Type Heatmap By Key Players
9.5 Industry Start-Up & Innovation Landscape
9.6 Key Company Profiles
9.6.1 Koppert Biological Systems Inc.
9.6.1.1 Company Overview & Snapshot
9.6.1.2 Product/Service Portfolio
9.6.1.3 Key Company Financials
9.6.1.4 SWOT Analysis
9.6.2 Lallemand Inc.
9.6.2.1 Company Overview & Snapshot
9.6.2.2 Product/Service Portfolio
9.6.2.3 Key Company Financials
9.6.2.4 SWOT Analysis
9.6.3 BioConsortia
9.6.3.1 Company Overview & Snapshot
9.6.3.2 Product/Service Portfolio
9.6.3.3 Key Company Financials
9.6.3.4 SWOT Analysis
9.6.4 Pivot Bio
9.6.4.1 Company Overview & Snapshot
9.6.4.2 Product/Service Portfolio
9.6.4.3 Key Company Financials
9.6.4.4 SWOT Analysis
9.6.5 Anand Agro Care
9.6.5.1 Company Overview & Snapshot
9.6.5.2 Product/Service Portfolio
9.6.5.3 Key Company Financials
9.6.5.4 SWOT Analysis
9.6.6 Chaitanya Biologicals Pvt. Ltd
9.6.6.1 Company Overview & Snapshot
9.6.6.2 Product/Service Portfolio
9.6.6.3 Key Company Financials
9.6.6.4 SWOT Analysis
9.6.7 BHOOJEEVAN ORGANICS PVT. LTD
9.6.7.1 Company Overview & Snapshot
9.6.7.2 Product/Service Portfolio
9.6.7.3 Key Company Financials
9.6.7.4 SWOT Analysis
9.6.8 Clean & Green Recycling Corp.
9.6.8.1 Company Overview & Snapshot
9.6.8.2 Product/Service Portfolio
9.6.8.3 Key Company Financials
9.6.8.4 SWOT Analysis
9.6.9 California Organic Fertilizers Inc.
9.6.9.1 Company Overview & Snapshot
9.6.9.2 Product/Service Portfolio
9.6.9.3 Key Company Financials
9.6.9.4 SWOT Analysis
9.6.10 Suståne Natural Fertilizer, Inc.
9.6.10.1 Company Overview & Snapshot
9.6.10.2 Product/Service Portfolio
9.6.10.3 Key Company Financials
9.6.10.4 SWOT Analysis
9.6.11 Nature Safe
9.6.11.1 Company Overview & Snapshot
9.6.11.2 Product/Service Portfolio
9.6.11.3 Key Company Financials
9.6.11.4 SWOT Analysis
9.6.12 Indogulf BioAg LLC
9.6.12.1 Company Overview & Snapshot
9.6.12.2 Product/Service Portfolio
9.6.12.3 Key Company Financials
9.6.12.4 SWOT Analysis
9.6.13 Benefert B.V.
9.6.13.1 Company Overview & Snapshot
9.6.13.2 Product/Service Portfolio
9.6.13.3 Key Company Financials
9.6.13.4 SWOT Analysis
9.6.14 Fertoz
9.6.14.1 Company Overview & Snapshot
9.6.14.2 Product/Service Portfolio
9.6.14.3 Key Company Financials
9.6.14.4 SWOT Analysis
9.6.15 Symborg Inc.
9.6.15.1 Company Overview & Snapshot
9.6.15.2 Product/Service Portfolio
9.6.15.3 Key Company Financials
9.6.15.4 SWOT Analysis
9.6.16 T. Stanes and Company Limited
9.6.16.1 Company Overview & Snapshot
9.6.16.2 Product/Service Portfolio
9.6.16.3 Key Company Financials
9.6.16.4 SWOT Analysis
9.6.17 Acadian Seaplants Limited
9.6.17.1 Company Overview & Snapshot
9.6.17.2 Product/Service Portfolio
9.6.17.3 Key Company Financials
9.6.17.4 SWOT Analysis
9.6.18 BioFert Manufacturing Inc.
9.6.18.1 Company Overview & Snapshot
9.6.18.2 Product/Service Portfolio
9.6.18.3 Key Company Financials
9.6.18.4 SWOT Analysis
9.6.19 Nurture Growth Bio-Fertilizer
9.6.19.1 Company Overview & Snapshot
9.6.19.2 Product/Service Portfolio
9.6.19.3 Key Company Financials
9.6.19.4 SWOT Analysis
9.6.20 Agri Organics
9.6.20.1 Company Overview & Snapshot
9.6.20.2 Product/Service Portfolio
9.6.20.3 Key Company Financials
9.6.20.4 SWOT Analysis
10. Analyst Recommendations
10.1 SNS Insider Opportunity Map
10.2 Industry Low-Hanging Fruit Assessment
10.3 Market Entry & Growth Strategy
10.4 Analyst Viewpoint & Suggestions On Market Growth
11. Assumptions
12. Disclaimer
13. Appendix
13.1 List Of Tables
13.2 List Of Figures
Key Market Segments:
By Product
-
Nitrogen Fixing
-
Phosphate Solubilizing
-
Others
By Crop Type
-
Cereals & Grains
-
Oilseeds & Pulses
-
Fruits & Vegetables
-
Others
By Application
-
Seed Treatment
-
Soil treatment
Request for Segment Customization as per your Business Requirement: Segment Customization Request
Regional Coverage:
North America
-
US
-
Canada
-
Mexico
Europe
-
Eastern Europe
-
Poland
-
Romania
-
Hungary
-
Turkey
-
Rest of Eastern Europe
-
-
Western Europe
-
Germany
-
France
-
UK
-
Italy
-
Spain
-
Netherlands
-
Switzerland
-
Austria
-
Rest of Western Europe
-
Asia Pacific
-
China
-
India
-
Japan
-
South Korea
-
Vietnam
-
Singapore
-
Australia
-
Rest of Asia Pacific
Middle East & Africa
-
Middle East
-
UAE
-
Egypt
-
Saudi Arabia
-
Qatar
-
Rest of Middle East
-
-
Africa
-
Nigeria
-
South Africa
-
Rest of Africa
-
-
Latin America
-
Brazil
-
Argentina
-
Colombia
-
Rest of Latin America
Request for Country Level Research Report: Country Level Customization Request
Available Customization
With the given market data, SNS Insider offers customization as per the company’s specific needs. The following customization options are available for the report:
-
Product Analysis
-
Criss-Cross segment analysis (e.g. Product X Application)
-
Product Matrix which gives a detailed comparison of product portfolio of each company
-
Geographic Analysis
-
Additional countries in any of the regions
-
Company Information
-
Detailed analysis and profiling of additional market players (Up to five)
An accurate research report requires proper strategizing as well as implementation. There are multiple factors involved in the completion of good and accurate research report and selecting the best methodology to compete the research is the toughest part. Since the research reports we provide play a crucial role in any company’s decision-making process, therefore we at SNS Insider always believe that we should choose the best method which gives us results closer to reality. This allows us to reach at a stage wherein we can provide our clients best and accurate investment to output ratio.
Each report that we prepare takes a timeframe of 350-400 business hours for production. Starting from the selection of titles through a couple of in-depth brain storming session to the final QC process before uploading our titles on our website we dedicate around 350 working hours. The titles are selected based on their current market cap and the foreseen CAGR and growth.
The 5 steps process:
Step 1: Secondary Research:
Secondary Research or Desk Research is as the name suggests is a research process wherein, we collect data through the readily available information. In this process we use various paid and unpaid databases which our team has access to and gather data through the same. This includes examining of listed companies’ annual reports, Journals, SEC filling etc. Apart from this our team has access to various associations across the globe across different industries. Lastly, we have exchange relationships with various university as well as individual libraries.

Step 2: Primary Research
When we talk about primary research, it is a type of study in which the researchers collect relevant data samples directly, rather than relying on previously collected data. This type of research is focused on gaining content specific facts that can be sued to solve specific problems. Since the collected data is fresh and first hand therefore it makes the study more accurate and genuine.
We at SNS Insider have divided Primary Research into 2 parts.
Part 1 wherein we interview the KOLs of major players as well as the upcoming ones across various geographic regions. This allows us to have their view over the market scenario and acts as an important tool to come closer to the accurate market numbers. As many as 45 paid and unpaid primary interviews are taken from both the demand and supply side of the industry to make sure we land at an accurate judgement and analysis of the market.
This step involves the triangulation of data wherein our team analyses the interview transcripts, online survey responses and observation of on filed participants. The below mentioned chart should give a better understanding of the part 1 of the primary interview.

Part 2: In this part of primary research the data collected via secondary research and the part 1 of the primary research is validated with the interviews from individual consultants and subject matter experts.
Consultants are those set of people who have at least 12 years of experience and expertise within the industry whereas Subject Matter Experts are those with at least 15 years of experience behind their back within the same space. The data with the help of two main processes i.e., FGDs (Focused Group Discussions) and IDs (Individual Discussions). This gives us a 3rd party nonbiased primary view of the market scenario making it a more dependable one while collation of the data pointers.
Step 3: Data Bank Validation
Once all the information is collected via primary and secondary sources, we run that information for data validation. At our intelligence centre our research heads track a lot of information related to the market which includes the quarterly reports, the daily stock prices, and other relevant information. Our data bank server gets updated every fortnight and that is how the information which we collected using our primary and secondary information is revalidated in real time.

Step 4: QA/QC Process
After all the data collection and validation our team does a final level of quality check and quality assurance to get rid of any unwanted or undesired mistakes. This might include but not limited to getting rid of the any typos, duplication of numbers or missing of any important information. The people involved in this process include technical content writers, research heads and graphics people. Once this process is completed the title gets uploader on our platform for our clients to read it.
Step 5: Final QC/QA Process:
This is the last process and comes when the client has ordered the study. In this process a final QA/QC is done before the study is emailed to the client. Since we believe in giving our clients a good experience of our research studies, therefore, to make sure that we do not lack at our end in any way humanly possible we do a final round of quality check and then dispatch the study to the client.