Laboratory Plasticware Market Report Scope & Overview:

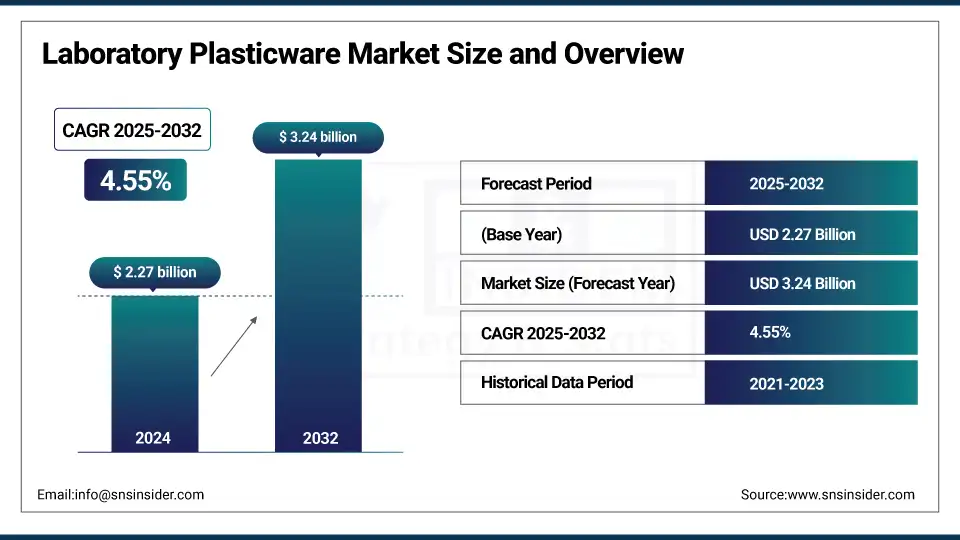
The Laboratory Plasticware Market Size was valued at USD 2.27 billion in 2024 and is expected to reach USD 3.24 billion by 2032, growing at a CAGR of 4.55% over the forecast period of 2025-2032.

The growth of pharmaceutical and biotechnology manufacturing activities is one key factor that has driven the global laboratory plasticware market analysis. This involves a growing need for advanced diagnostic solutions, rising drug discovery activities and increased focus on vaccine development & biologics production worldwide. The demand for high-quality and contamination-free plasticware like pipettes, petri dishes, sample containers are soaring as pharmaceuticals and biotech firms are increasingly expanding their R&D and manufacturing capacity. Additionally, an increase in the application of automation in laboratory workflows and prevailing quality regulations to ensure reliability & sterility of components made from plastic are anticipated to foster market growth. This trend is also more prominent in geographies with emerging Biopharma investments and improved clinical research infrastructure which drive the laboratory plasticware market growth.

The U.S. National Institute of Food and Agriculture (NIFA) awarded $3.7 million grant in 2024 to support alfalfa seed breeding research with a view to improve drought tolerance as well as forage digestibility needed for livestock feed systems based on plasticware-dependent sample testing and sample analysis.

Market Dynamics

Key Drivers:

  •   Rising Demand for High-Throughput Testing and Automation in Labs Drive the Market Growth

Modern laboratories are increasingly adopting high-throughput screening (HTS), automated liquid handling, and robotic systems to enhance testing efficiency and minimize manual errors. These technologies require compatible, precision-engineered plasticware such as microplates, deep well plates, and robotic pipette tips that can seamlessly integrate with automation platforms. The push for faster diagnostics, drug screening, and sample processing is directly fuelling demand for standardized plastic consumables.

In 2024, Thermo Fisher Scientific expanded its robotic-compatible plasticware product line at its U.S. facilities in Massachusetts, in response to increased demand from biotech clients using automated workflows in drug discovery and genomics labs. This aligns with the broader U.S. focus on laboratory automation, supported by innovation grants from the National Institutes of Health (NIH) and NSF under the High-End Instrumentation (HEI) program.

Restrain:

  • Environmental Concerns and Regulatory Pressure, which may hamper the Market Growth

The widespread use of single-use plastic products in laboratories contributes significantly to medical waste and environmental burden. Rising scrutiny from environmental agencies and evolving regulations around plastic disposal are challenging market growth. Some institutions are shifting toward glassware or biodegradable alternatives, which affects demand for conventional plasticware. Disposal and incineration of contaminated plastic waste also incur high costs.

Opportunities:

  • Growth of Diagnostic Laboratories and Research Institutes Create an Opportunity for the Market

The rise in infectious disease testing, personalized medicine, and university-led R&D is expanding the number of diagnostic labs and academic research centers globally. These facilities depend on plasticware for fluid handling, cell culture, sample storage, and filtration applications. Advancements in life sciences and government-backed research programs are further fueling demand which drive the laboratory plasticware market trends.

In 2023, the U.S. Department of Health and Human Services (HHS) awarded over USD 650 million in grants to expand national diagnostic testing infrastructure, particularly in underserved regions boosting orders for centrifuge tubes, culture flasks, and pipette tips.

Segment Analysis:

By Product Type

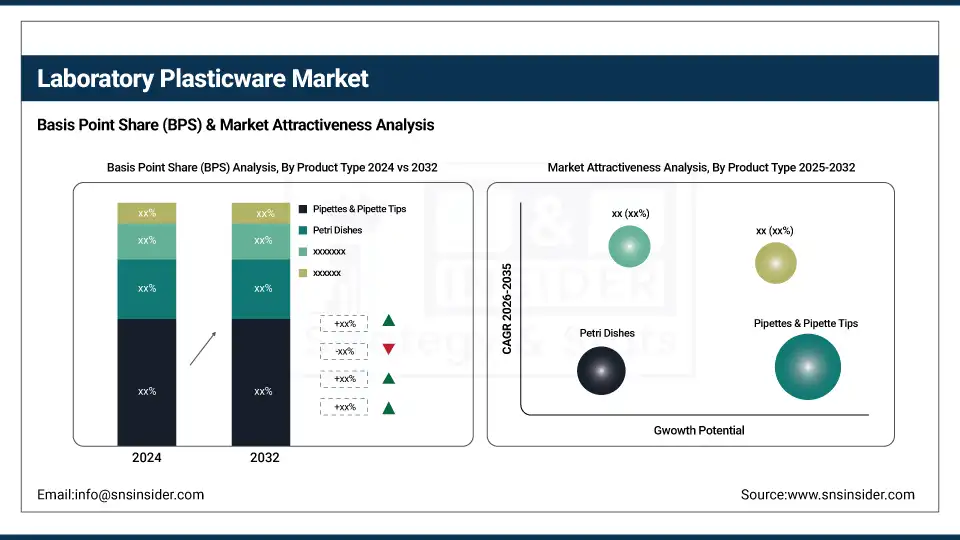
Pipettes & Pipette Tips dominated the segment in 2024, accounting for around 28% of the total market. This is due to their constant usage in diagnostic labs, academic research, and pharmaceutical workflows, especially in sample handling and molecular biology protocols.

Petri Dishes are the fastest-growing product, driven by increased demand in microbiology labs for culture testing and microbial analysis. Their affordability and disposability make them essential in large-volume testing environments.

By Material Type

Polypropylene (PP) led this segment with a share of nearly 38.50% in 2024. Its popularity comes from its chemical resistance, durability, and suitability for autoclaving, making it ideal for repeat lab procedures.

Polycarbonate (PC) is expanding rapidly as the fastest-growing material type due to its optical clarity and toughness, which suits advanced research applications, especially in PCR tubes and centrifuge containers.

By End User

Pharmaceutical & Biotechnology Companies dominated the market with over 40% share in 2024. The growing scale of drug development, vaccine R&D, and biologics manufacturing has pushed up the demand for disposable and contamination-free plasticware.

Diagnostic Laboratories are the fastest-growing end user segment, fueled by rising disease detection rates, pathology lab expansion, and demand for automated plasticware compatible with modern analyzers.

By Application

Sample Storage held the largest share of approximately 32% in 2024. Labs increasingly rely on leak-proof and contamination-resistant containers for preserving biological materials, reagents, and chemicals.

Cell Culture is the fastest-growing application due to surging investments in stem cell research, cancer biology, and regenerative medicine. This area demands ultra-pure, sterile plasticware tailored for sensitive cell environments.
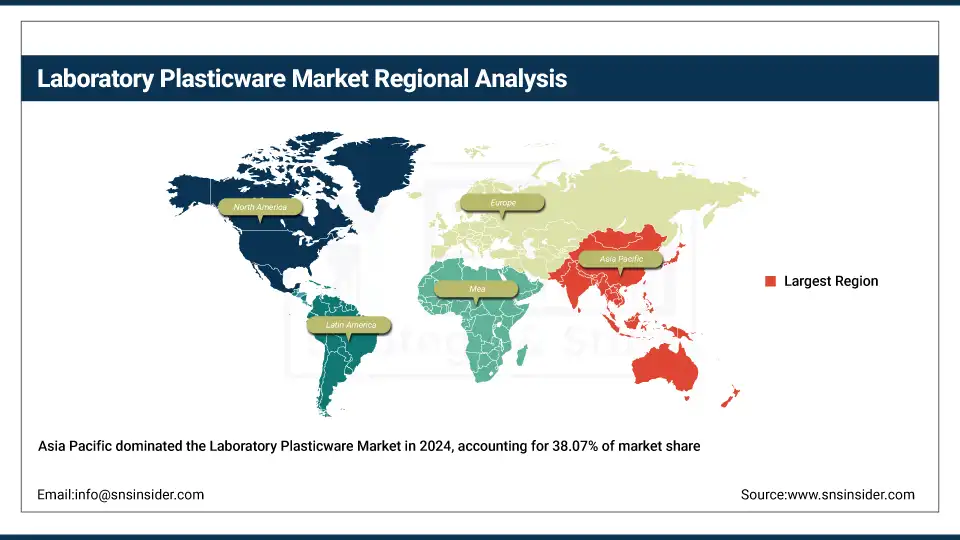
Regional Analysis:

Asia Pacific held the Laboratory Plasticware market share largest market 2024, around 38.07% 2024. It is due to rapid expansion in pharmaceutical manufacturing, clinical research, and academic investments across countries like China, India, South Korea, and Japan. These nations have been increasing public and private funding for life sciences and diagnostics to support their growing healthcare demands. The region also benefits from cost-effective production, large patient populations for clinical studies, and improving infrastructure in diagnostics and biotech parks.

In 2024, India’s Department of Biotechnology launched a joint initiative to fund biotech incubators with advanced lab facilities, leading to bulk procurement of laboratory consumables, especially plasticware, to support early-stage research.

The North America region is the fastest-growing market. It is due to its well-established pharmaceutical and biotechnology industries, leading research universities, and high healthcare spending. Laboratories across the region rely on high-performance, disposable plasticware to maintain sterility and reduce contamination risk in molecular diagnostics, clinical testing, and drug development. The region's strict lab safety protocols and emphasis on automation further boost demand.

In 2024Thermo Fisher Scientific expanded its plastic consumables manufacturing site in Wisconsin, focusing on increasing output of pipette tips and sterile sample containers to meet rising diagnostic lab requirements.

The U.S. Laboratory Plasticware market size was USD 426 million in 2024 and is expected to reach USD 644 million by 2032 and grow at a CAGR of 5.29% over the forecast period of 2025-2032. It is driven by strong federal funding in biomedical research through agencies like NIH and BARDA. The country houses several top biotech firms and contract research organizations that are expanding lab capacities. There's also a shift toward automated liquid handling and cold storage applications, requiring specialized plastic labware.

Europe maintains a significant share of the Laboratory Plasticware market. It is due to its strong pharmaceutical R&D base, university-led innovation, and focus on sustainability in lab operations. While regulatory compliance is strict, the growing biotech startup scene and national health testing programs are increasing the use of sterile, single-use lab consumables. Germany, France, and the U.K. are major contributors.

In 2024, Germany’s Federal Ministry of Education and Research announced €300 million in funding to modernize public research labs and academic institutions, increasing orders for high-grade plastic labware for cell culture, molecular diagnostics, and biosample storage.

Key Players:

Major Laboratory Plasticware companies are Thermo Fisher Scientific (Nalge Nunc), Eppendorf, Wheaton Science Products, Dynalon Lab Supplies, CytoScientific, Labvida Scientific, Supertek (Shivsons / Tarsons brand), Medilab Exports / Supertek, Starlabs Glassware, Borosil, Mitsubishi Plastics, ALPLA Group, Nalgene (under Nalge Nunc), Karter Scientific Labware Manufacturing, Micron Solutions, Runlab, 3Plastics, Sanbio (B-Frame Biocomposite series), Miniplast, Kartell/Sterilin (via Dynalon distribution).

Recent Development:

  • In 2025, Eppendorf launched a new range of eco-friendly plastic lab consumables made from recycled and biocompatible materials under its TwinGuard Green line. The launch reflects a broader push toward sustainability in European research labs and has been adopted by several German universities and biotech firms.

  • In 2024, Kartell partnered with an Italian sustainability initiative to redesign its plastic packaging and reduce the carbon footprint of its labware shipping operations. The collaboration included a pilot project where pipette tip boxes were made from 80% recycled plastic and reused across academic laboratories in Milan.

Laboratory Plasticware Market Report Scope:

Report Attributes Details
Market Size in 2024 USD 2.27 Billion 
Market Size by 2032 USD 3.24 Billion 
CAGR CAGR of4.55% From 2025 to 2032
Base Year 2024
Forecast Period 2025-2032
Historical Data 2021-2023
Report Scope & Coverage Market Size, Segments Analysis, Competitive Landscape, Regional Analysis, DROC & SWOT Analysis, Forecast Outlook
Key Segments • By Product Type (Alfalfa, Clover, Ryegrass, Chicory, Fescue, Timothy, and Others (Bromegrass, Orchardgrass, Millet, Sorghum)
• By Livestock (Cattle, Poultry, Swine, and Others (Sheep, Goat, Horse, Rabbit)
• By Species (Legumes, Grasses, and Others (Brassicas, Herbs)
• By Application (Grazing, Hay, Silage, Green Manure, and Others (Soil Improvement, Erosion Control)
Regional Analysis/Coverage North America (US, Canada), Europe (Germany, France, UK, Italy, Spain, Poland, Russsia, Rest of Europe), Asia Pacific (China, India, Japan, South Korea, Australia,ASEAN Countries, Rest of Asia Pacific), Middle East & Africa (UAE, Saudi Arabia, Qatar, Egypt, South Africa, Rest of Middle East & Africa), Latin America (Brazil, Argentina, Mexico, Colombia Rest of Latin America)
Company Profiles Thermo Fisher Scientific (Nalge Nunc), Eppendorf, Wheaton Science Products, Dynalon Lab Supplies, CytoScientific, Labvida Scientific, Supertek (Shivsons / Tarsons brand), Medilab Exports / Supertek, Starlabs Glassware, Borosil, Mitsubishi Plastics, ALPLA Group, Nalgene (under Nalge Nunc), Karter Scientific Labware Manufacturing, Micron Solutions, Runlab, 3Plastics, Sanbio (B-Frame Biocomposite series), Miniplast, Kartell/Sterilin (via Dynalon distribution)

Table Of Contents

1. Introduction

1.1 Market Definition & Scope

 1.2 Research Assumptions & Abbreviations

 1.3 Research Methodology

2. Executive Summary

2.1 Market Snapshot

 2.2 Market Absolute $ Opportunity Assessment & Y-o-Y Analysis, 2021–2032

 2.3 Market Size & Forecast, By Segmentation, 2021–2032

  2.3.1 Market Size By Product Type

  2.3.2 Market Size By Material Type

         2.3.3 Market Size By End User

         2.3.4 Market Size By Application

 2.4 Market Share & BPS Analysis By Region, 2024

 2.5 Industry Growth Scenarios – Conservative, Likely & Optimistic

 2.6 Industry CxO’s Perspective

3. Market Overview

3.1 Market Dynamics

  3.1.1 Drivers

  3.1.2 Restraints

  3.1.3 Opportunities

  3.1.4 Key Market Trends

 3.2 Industry PESTLE Analysis

 3.3 Key Industry Forces (Porter’s) Impacting Market Growth

 3.4 Industry Life Cycle Assessment

 3.5 Parent Market Overview

 3.6 Market Risk Assessment

4. Statistical Insights & Trends Reporting

4.1 Regulatory & Compliance Landscape

           4.1.1 Overview of FDA, EU (REACH), and ISO standards specific to laboratory plasticware.

           4.1.2 Impact of evolving biohazard, sustainability, and single-use plastic regulations on manufacturers and end users.

 4.2 Sustainability Trends & Circular Economy Adoption

           4.2.1 Analysis of recyclable and biodegradable plasticware innovations

           4.2.2 Adoption trends in reusable vs. disposable lab plasticware and how labs are shifting toward low-carbon footprint options.

4.3 Procurement Intelligence & Price Trend Analysis

           4.3.1 Benchmarking of average product costs across geographies.          

           4.3.2 Supply chain disruption risks and mitigation strategies for sourcing lab-grade polymers.

4.4 Innovation Pipeline & Material Advancements

           4.4.1 Pipeline analysis of R&D in smart materials

           4.4.2 Comparative insights into performance upgrades in new-generation polymers

4.5 End-Use Case Studies & Purchasing Shifts

           4.5.1Profiles of changing procurement preferences in pharma, diagnostics, and academia

           4.5.2 Case examples of digitization, lab automation, and custom plasticware integration.

5. Laboratory Plasticware Market Segmental Analysis & Forecast, By Product Type, 2021 – 2032, Value (USD Billion) & Volume (Kilotons)

5.1 Introduction

 5.2 Beakers

  5.2.1 Key Trends

  5.2.2 Market Size & Forecast, 2021 – 2032

 5.3 Bottles

  5.3.1 Key Trends

  5.3.2 Market Size & Forecast, 2021 – 2032

    5.4 Pipettes & Pipette Tips

  5.4.1 Key Trends

  5.4.2 Market Size & Forecast, 2021 – 2032

   5.5 Petri Dishes

  5.5.1 Key Trends

  5.5.2 Market Size & Forecast, 2021 – 2032

   5.6 Test Tubes

  5.6.1 Key Trends

  5.6.2 Market Size & Forecast, 2021 – 2032

    5.7 Funnels

  5.7.1 Key Trends

  5.7.2 Market Size & Forecast, 2021 – 2032

  5.8 Others (Cuvettes, Flasks, Tubing)

  5.8.1 Key Trends

  5.8.2 Market Size & Forecast, 2021 – 2032

6. Laboratory Plasticware Market Segmental Analysis & Forecast, By Material Type, 2021 – 2032, Value (USD Billion) & Volume (Kilotons)

    6.1 Introduction

 6.2 Polypropylene (PP)

  6.2.1 Key Trends

  6.2.2 Market Size & Forecast, 2021 – 2032

 6.3 Polystyrene (PS)

  6.3.1 Key Trends

  6.3.2 Market Size & Forecast, 2021 – 2032

   6.4 Polyethylene (PE)

  6.3.1 Key Trends

  6.3.2 Market Size & Forecast, 2021 – 2032

   6.5 Polycarbonate (PC)

  6.5.1 Key Trends

  6.5.2 Market Size & Forecast, 2021 – 2032

   6.6 Others (Teflon, Acrylic, PVC)

  6.6.1 Key Trends

  6.6.2 Market Size & Forecast, 2021 – 2032

7. Laboratory Plasticware Market Segmental Analysis & Forecast, By End User, 2021 – 2032, Value (USD Billion) & Volume (Kilotons)

    7.1 Introduction

 7.2 Pharmaceutical & Biotechnology Companies

  7.2.1 Key Trends

  7.2.2 Market Size & Forecast, 2021 – 2032

 7.3 Academic & Research Institutes

  7.3.1 Key Trends

  7.3.2 Market Size & Forecast, 2021 – 2032

    7.4 Diagnostic Laboratories

  7.4.1 Key Trends

  7.4.2 Market Size & Forecast, 2021 – 2032

    7.5 Hospitals & Clinics

  7.5.1 Key Trends

  7.5.2 Market Size & Forecast, 2021 – 2032

    7.6 Others (CROs, Forensic Labs)

  7.6.1 Key Trends

  7.6.2 Market Size & Forecast, 2021 – 2032

8. Laboratory Plasticware Market Segmental Analysis & Forecast, By Application, 2021 – 2032, Value (USD Billion) & Volume (Kilotons)

    8.1 Introduction

 8.2 Sample Storage

  8.2.1 Key Trends

  8.2.2 Market Size & Forecast, 2021 – 2032

 8.3 Fluid Handling

  8.3.1 Key Trends

  8.3.2 Market Size & Forecast, 2021 – 2032

 8.4 Cell Culture

  8.4.1 Key Trends

  8.4.2 Market Size & Forecast, 2021 – 2032

   8.5 Diagnostics

  8.5.1 Key Trends

  8.5.2 Market Size & Forecast, 2021 – 2032

   8.6 Others (Mixing, Separation, Filtration)

  8.6.1 Key Trends

  8.6.2 Market Size & Forecast, 2021 – 2032

9. Laboratory Plasticware Market Segmental Analysis & Forecast by Region, 2021 – 2025, Value (USD Billion) & Volume (Kilotons)

9.1 Introduction

9.2 North America

 9.2.1 Key Trends

 9.2.2 Laboratory Plasticware Market Size & Forecast, By Product Type, 2021 – 2032

 9.2.3 Laboratory Plasticware Market Size & Forecast, By Material Type, 2021 – 2032

 9.2.4 Laboratory Plasticware Market Size & Forecast, By End User, 2021 – 2032

 9.2.5 Laboratory Plasticware Market Size & Forecast, By Application, 2021 – 2032

 9.2.6 Laboratory Plasticware Market Size & Forecast, By Country, 2021 – 2032

  9.2.6.1 USA

   9.2.6.1.1 Laboratory Plasticware Market Size & Forecast, By Product Type, 2021 – 2032

   9.2.6.1.2 Laboratory Plasticware Market Size & Forecast, By Material Type, 2021 – 2032

   9.2.6.1.3 Laboratory Plasticware Market Size & Forecast, By End User, 2021 – 2032

   9.2.6.1.4 Laboratory Plasticware Market Size & Forecast, By Application, 2021 – 2032

  9.2.6.2 Canada

   9.2.6.2.1 Laboratory Plasticware Market Size & Forecast, By Product Type, 2021 – 2032

   9.2.6.2.2 Laboratory Plasticware Market Size & Forecast, By Material Type, 2021 – 2032

   9.2.6.2.3 Laboratory Plasticware Market Size & Forecast, By End User, 2021 – 2032

   9.2.6.2.4 Laboratory Plasticware Market Size & Forecast, By Application, 2021 – 2032

9.3 Europe

 9.3.1 Key Trends

 9.3.2 Laboratory Plasticware Market Size & Forecast, By Product Type, 2021 – 2032

 9.3.3 Laboratory Plasticware Market Size & Forecast, By Material Type, 2021 – 2032

 9.3.4 Laboratory Plasticware Market Size & Forecast, By End User, 2021 – 2032

 9.3.5 Laboratory Plasticware Market Size & Forecast, By Application, 2021 – 2032

 9.3.6 Laboratory Plasticware Market Size & Forecast, By Country, 2021 – 2032

  9.3.6.1 Germany

   9.3.6.1.1 Laboratory Plasticware Market Size & Forecast, By Product Type, 2021 – 2032

   9.3.6.1.2 Laboratory Plasticware Market Size & Forecast, By Material Type, 2021 – 2032

   9.3.6.1.3 Laboratory Plasticware Market Size & Forecast, By End User, 2021 – 2032

   9.3.6.1.4 Laboratory Plasticware Market Size & Forecast, By Application, 2021 – 2032

  9.3.6.2 UK

   9.3.6.2.1 Laboratory Plasticware Market Size & Forecast, By Product Type, 2021 – 2032

   9.3.6.2.2 Laboratory Plasticware Market Size & Forecast, By Material Type, 2021 – 2032

   9.3.6.2.3 Laboratory Plasticware Market Size & Forecast, By End User, 2021 – 2032

   9.3.6.2.4 Laboratory Plasticware Market Size & Forecast, By Application, 2021 – 2032

  9.3.6.3 France

   9.3.6.3.1 Laboratory Plasticware Market Size & Forecast, By Product Type, 2021 – 2032

   9.3.6.3.2 Laboratory Plasticware Market Size & Forecast, By Material Type, 2021 – 2032

   9.3.6.3.3 Laboratory Plasticware Market Size & Forecast, By End User, 2021 – 2032

   9.3.6.3.4 Laboratory Plasticware Market Size & Forecast, By Application, 2021 – 2032

  9.3.6.4 Italy

   9.3.6.4.1 Laboratory Plasticware Market Size & Forecast, By Product Type, 2021 – 2032

   9.3.6.4.2 Laboratory Plasticware Market Size & Forecast, By Material Type, 2021 – 2032

   9.3.6.4.3 Laboratory Plasticware Market Size & Forecast, By End User, 2021 – 2032

   9.3.6.4.4 Laboratory Plasticware Market Size & Forecast, By Application, 2021 – 2032

  9.3.6.5 Spain

   9.3.6.5.1 Laboratory Plasticware Market Size & Forecast, By Product Type, 2021 – 2032

   9.3.6.5.2 Laboratory Plasticware Market Size & Forecast, By Material Type, 2021 – 2032

   9.3.6.5.3 Laboratory Plasticware Market Size & Forecast, By End User, 2021 – 2032

   9.3.6.5.4 Laboratory Plasticware Market Size & Forecast, By Application, 2021 – 2032

  9.3.6.6 Russia

   9.3.6.6.1 Laboratory Plasticware Market Size & Forecast, By Product Type, 2021 – 2032

   9.3.6.6.2 Laboratory Plasticware Market Size & Forecast, By Material Type, 2021 – 2032

   9.3.6.6.3 Laboratory Plasticware Market Size & Forecast, By End User, 2021 – 2032

   9.3.6.6.4 Laboratory Plasticware Market Size & Forecast, By Application, 2021 – 2032

  9.3.6.7 Poland

   9.3.6.7.1 Laboratory Plasticware Market Size & Forecast, By Product Type, 2021 – 2032

   9.3.6.7.2 Laboratory Plasticware Market Size & Forecast, By Material Type, 2021 – 2032

   9.3.6.7.3 Laboratory Plasticware Market Size & Forecast, By End User, 2021 – 2032

   9.3.6.7.4 Laboratory Plasticware Market Size & Forecast, By Application, 2021 – 2032

  9.3.6.8 Rest of Europe

   9.3.6.8.1 Laboratory Plasticware Market Size & Forecast, By Product Type, 2021 – 2032

   9.3.6.8.2 Laboratory Plasticware Market Size & Forecast, By Material Type, 2021 – 2032

   9.3.6.8.3 Laboratory Plasticware Market Size & Forecast, By End User, 2021 – 2032

   9.3.6.8.4 Laboratory Plasticware Market Size & Forecast, By Application, 2021 – 2032   

9.4 Asia-Pacific

 9.4.1 Key Trends

 9.4.2 Laboratory Plasticware Market Size & Forecast, By Product Type, 2021 – 2032

 9.4.3 Laboratory Plasticware Market Size & Forecast, By Material Type, 2021 – 2032

 9.4.4 Laboratory Plasticware Market Size & Forecast, By End User, 2021 – 2032

 9.4.5 Laboratory Plasticware Market Size & Forecast, By Application, 2021 – 2032

 9.4.6 Laboratory Plasticware Market Size & Forecast, By Country, 2021 – 2032

  9.4.6.1 China

   9.4.6.1.1 Laboratory Plasticware Market Size & Forecast, By Product Type, 2021 – 2032

   9.4.6.1.2 Laboratory Plasticware Market Size & Forecast, By Material Type, 2021 – 2032

   9.4.6.1.3 Laboratory Plasticware Market Size & Forecast, By End User, 2021 – 2032

   9.4.6.1.4 Laboratory Plasticware Market Size & Forecast, By Application, 2021 – 2032

  9.4.6.2 India

   9.4.6.2.1 Laboratory Plasticware Market Size & Forecast, By Product Type, 2021 – 2032

   9.4.6.2.2 Laboratory Plasticware Market Size & Forecast, By Material Type, 2021 – 2032

   9.4.6.2.3 Laboratory Plasticware Market Size & Forecast, By End User, 2021 – 2032

   9.4.6.2.4 Laboratory Plasticware Market Size & Forecast, By Application, 2021 – 2032

  9.4.6.3 Japan

   9.4.6.3.1 Laboratory Plasticware Market Size & Forecast, By Product Type, 2021 – 2032

   9.4.6.3.2 Laboratory Plasticware Market Size & Forecast, By Material Type, 2021 – 2032

   9.4.6.3.3 Laboratory Plasticware Market Size & Forecast, By End User, 2021 – 2032

   9.4.6.3.4 Laboratory Plasticware Market Size & Forecast, By Application, 2021 – 2032

  9.4.6.4 South Korea

   9.4.6.4.1 Laboratory Plasticware Market Size & Forecast, By Product Type, 2021 – 2032

   9.4.6.4.2 Laboratory Plasticware Market Size & Forecast, By Material Type, 2021 – 2032

   9.4.6.4.3 Laboratory Plasticware Market Size & Forecast, By End User, 2021 – 2032

   9.4.6.4.4 Laboratory Plasticware Market Size & Forecast, By Application, 2021 – 2032

  9.4.6.5 Australia

   9.4.6.5.1 Laboratory Plasticware Market Size & Forecast, By Product Type, 2021 – 2032

   9.4.6.5.2 Laboratory Plasticware Market Size & Forecast, By Material Type, 2021 – 2032

   9.4.6.5.3 Laboratory Plasticware Market Size & Forecast, By End User, 2021 – 2032

   9.4.6.5.4 Laboratory Plasticware Market Size & Forecast, By Application, 2021 – 2032

  9.4.6.6 ASEAN Countries

   9.4.6.6.1 Laboratory Plasticware Market Size & Forecast, By Product Type, 2021 – 2032

   9.4.6.6.2 Laboratory Plasticware Market Size & Forecast, By Material Type, 2021 – 2032

   9.4.6.6.3 Laboratory Plasticware Market Size & Forecast, By End User, 2021 – 2032

   9.4.6.6.4 Laboratory Plasticware Market Size & Forecast, By Application, 2021 – 2032

  9.4.6.7 Rest of Asia-Pacific

   9.4.6.7.1 Laboratory Plasticware Market Size & Forecast, By Product Type, 2021 – 2032

   9.4.6.7.2 Laboratory Plasticware Market Size & Forecast, By Material Type, 2021 – 2032

   9.4.6.7.3 Laboratory Plasticware Market Size & Forecast, By End User, 2021 – 2032

   9.4.6.7.4 Laboratory Plasticware Market Size & Forecast, By Application, 2021 – 2032

9.5 Latin America

 9.5.1 Key Trends

 9.5.2 Laboratory Plasticware Market Size & Forecast, By Product Type, 2021 – 2032

 9.5.3 Laboratory Plasticware Market Size & Forecast, By Material Type, 2021 – 2032

 9.5.4 Laboratory Plasticware Market Size & Forecast, By End User, 2021 – 2032

 9.5.5 Laboratory Plasticware Market Size & Forecast, By Application, 2021 – 2032

 9.5.6 Laboratory Plasticware Market Size & Forecast, By Country, 2021 – 2032

  9.5.6.1 Brazil

   9.5.6.1.1 Laboratory Plasticware Market Size & Forecast, By Product Type, 2021 – 2032

   9.5.6.1.2 Laboratory Plasticware Market Size & Forecast, By Material Type, 2021 – 2032

   9.5.6.1.3 Laboratory Plasticware Market Size & Forecast, By End User, 2021 – 2032

   9.5.6.1.4 Laboratory Plasticware Market Size & Forecast, By Application, 2021 – 2032

  9.5.6.2 Argentina

   9.5.6.2.1 Laboratory Plasticware Market Size & Forecast, By Product Type, 2021 – 2032

   9.5.6.2.2 Laboratory Plasticware Market Size & Forecast, By Material Type, 2021 – 2032

   9.5.6.2.3 Laboratory Plasticware Market Size & Forecast, By End User, 2021 – 2032

   9.5.6.2.4 Laboratory Plasticware Market Size & Forecast, By Application, 2021 – 2032

  9.5.6.3 Mexico

   9.5.6.3.1 Laboratory Plasticware Market Size & Forecast, By Product Type, 2021 – 2032

   9.5.6.3.2 Laboratory Plasticware Market Size & Forecast, By Material Type, 2021 – 2032

   9.5.6.3.3 Laboratory Plasticware Market Size & Forecast, By End User, 2021 – 2032

   9.5.6.3.4 Laboratory Plasticware Market Size & Forecast, By Application, 2021 – 2032

  9.5.6.4 Colombia

   9.5.6.4.1 Laboratory Plasticware Market Size & Forecast, By Product Type, 2021 – 2032

   9.5.6.4.2 Laboratory Plasticware Market Size & Forecast, By Material Type, 2021 – 2032

   9.5.6.4.3 Laboratory Plasticware Market Size & Forecast, By End User, 2021 – 2032

   9.5.6.4.4 Laboratory Plasticware Market Size & Forecast, By Application, 2021 – 2032

  9.5.6.5 Rest of Latin America

   9.5.6.5.1 Laboratory Plasticware Market Size & Forecast, By Product Type, 2021 – 2032

   9.5.6.5.2 Laboratory Plasticware Market Size & Forecast, By Material Type, 2021 – 2032

   9.5.6.5.3 Laboratory Plasticware Market Size & Forecast, By End User, 2021 – 2032

   9.5.6.5.4 Laboratory Plasticware Market Size & Forecast, By Application, 2021 – 2032

9.6 Middle East & Africa

 9.6.1 Key Trends

 9.6.2 Laboratory Plasticware Market Size & Forecast, By Product Type, 2021 – 2032

 9.6.3 Laboratory Plasticware Market Size & Forecast, By Material Type, 2021 – 2032

 9.6.4 Laboratory Plasticware Market Size & Forecast, By End User, 2021 – 2032

 9.6.5 Laboratory Plasticware Market Size & Forecast, By Application, 2021 – 2032

 9.6.6 Laboratory Plasticware Market Size & Forecast, By Country, 2021 – 2032

  9.6.6.1 UAE

   9.6.6.1.1 Laboratory Plasticware Market Size & Forecast, By Product Type, 2021 – 2032

   9.6.6.1.2 Laboratory Plasticware Market Size & Forecast, By Material Type, 2021 – 2032

   9.6.6.1.3 Laboratory Plasticware Market Size & Forecast, By End User, 2021 – 2032

   9.6.6.1.4 Laboratory Plasticware Market Size & Forecast, By Application, 2021 – 2032

  9.6.6.2 Saudi Arabia

   9.6.6.2.1 Laboratory Plasticware Market Size & Forecast, By Product Type, 2021 – 2032

   9.6.6.2.2 Laboratory Plasticware Market Size & Forecast, By Material Type, 2021 – 2032

   9.6.6.2.3 Laboratory Plasticware Market Size & Forecast, By End User, 2021 – 2032

   9.6.6.2.4 Laboratory Plasticware Market Size & Forecast, By Application, 2021 – 2032

  9.6.6.3 Qatar

   9.6.6.3.1 Laboratory Plasticware Market Size & Forecast, By Product Type, 2021 – 2032

   9.6.6.3.2 Laboratory Plasticware Market Size & Forecast, By Material Type, 2021 – 2032

   9.6.6.3.3 Laboratory Plasticware Market Size & Forecast, By End User, 2021 – 2032

   9.6.6.3.4 Laboratory Plasticware Market Size & Forecast, By Application, 2021 – 2032

  9.6.6.4 Egypt

   9.6.6.4.1 Laboratory Plasticware Market Size & Forecast, By Product Type, 2021 – 2032

   9.6.6.4.2 Laboratory Plasticware Market Size & Forecast, By Material Type, 2021 – 2032

   9.6.6.4.3 Laboratory Plasticware Market Size & Forecast, By End User, 2021 – 2032

   9.6.6.4.4 Laboratory Plasticware Market Size & Forecast, By Application, 2021 – 2032

  9.6.6.5 South Africa

   9.6.6.5.1 Laboratory Plasticware Market Size & Forecast, By Product Type, 2021 – 2032

   9.6.6.5.2 Laboratory Plasticware Market Size & Forecast, By Material Type, 2021 – 2032

   9.6.6.5.3 Laboratory Plasticware Market Size & Forecast, By End User, 2021 – 2032

   9.6.6.5.4 Laboratory Plasticware Market Size & Forecast, By Application, 2021 – 2032

  9.6.6.6 Rest of Middle East & Africa

   9.6.6.6.1 Laboratory Plasticware Market Size & Forecast, By Product Type, 2021 – 2032

   9.6.6.6.2 Laboratory Plasticware Market Size & Forecast, By Material Type, 2021 – 2032

   9.6.6.6.3 Laboratory Plasticware Market Size & Forecast, By End User, 2021 – 2032

   9.6.6.6.4 Laboratory Plasticware Market Size & Forecast, By Application, 2021 – 2032

10. Competitive Landscape

 10.1 Key Players' Positioning

 10.2 Competitive Developments

  10.2.1 Key Strategies Adopted (%), By Key Players, 2024

  10.2.2 Year-Wise Strategies & Development, 2021 – 2025

  10.2.3 Number Of Strategies Adopted By Key Players, 2024

 10.3 Market Share Analysis, 2024

 10.4 Product/Service & End-Use Industry Benchmarking

  10.4.1 Product/Service Specifications & Features By Key Players

  10.4.2 Product/Service Heatmap By Key Players

  10.4.3 End-Use Industry Heatmap By Key Players

 10.5 Industry Start-Up & Innovation Landscape

 10.6 Key Company Profiles

10.6 Key Company Profiles

 10.6.1 Thermo Fisher Scientific

  10.6.1.1 Company Overview & Snapshot

  10.6.1.2 Product/Service Portfolio

  10.6.1.3 Key Company Financials

  10.6.1.4 SWOT Analysis

 10.6.2 Eppendorf

  10.6.2.1 Company Overview & Snapshot

  10.6.2.2 Product/Service Portfolio

  10.6.2.3 Key Company Financials

  10.6.2.4 SWOT Analysis

 10.6.3 Wheaton Science Products

  10.6.3.1 Company Overview & Snapshot

  10.6.3.2 Product/Service Portfolio

  10.6.3.3 Key Company Financials

  10.6.3.4 SWOT Analysis

 10.6.4 Dynalon Lab Supplies

  10.6.4.1 Company Overview & Snapshot

  10.6.4.2 Product/Service Portfolio

  10.6.4.3 Key Company Financials

  10.6.4.4 SWOT Analysis

 10.6.5 CytoScientific

  10.6.5.1 Company Overview & Snapshot

  10.6.5.2 Product/Service Portfolio

  10.6.5.3 Key Company Financials

  10.6.5.4 SWOT Analysis

 10.6.6 Labvida Scientific

  10.6.6.1 Company Overview & Snapshot

  10.6.6.2 Product/Service Portfolio

  10.6.6.3 Key Company Financials

  10.6.6.4 SWOT Analysis

 10.6.7 Supertek

  10.6.7.1 Company Overview & Snapshot

  10.6.7.2 Product/Service Portfolio

  10.6.7.3 Key Company Financials

  10.6.7.4 SWOT Analysis

 10.6.8 Medilab Exports

  10.6.8.1 Company Overview & Snapshot

  10.6.8.2 Product/Service Portfolio

  10.6.8.3 Key Company Financials

  10.6.8.4 SWOT Analysis

 10.6.9 Starlabs Glassware

  10.6.9.1 Company Overview & Snapshot

  10.6.9.2 Product/Service Portfolio

  10.6.9.3 Key Company Financials

  10.6.9.4 SWOT Analysis

 10.6.10 Borosil

  10.6.10.1 Company Overview & Snapshot

  10.6.10.2 Product/Service Portfolio

  10.6.10.3 Key Company Financials

  10.6.10.4 SWOT Analysis

 10.6.11 Mitsubishi Plastics

  10.6.11.1 Company Overview & Snapshot

  10.6.11.2 Product/Service Portfolio

  10.6.11.3 Key Company Financials

  10.6.11.4 SWOT Analysis

 10.6.12 Nalgene

  10.6.12.1 Company Overview & Snapshot

  10.6.12.2 Product/Service Portfolio

  10.6.12.3 Key Company Financials

  10.6.12.4 SWOT Analysis

 10.6.13 Karter Scientific Labware Manufacturing

  10.6.13.1 Company Overview & Snapshot

  10.6.13.2 Product/Service Portfolio

  10.6.13.3 Key Company Financials

  10.6.13.4 SWOT Analysis

10.6.14 Micron Solutions

  10.6.14.1 Company Overview & Snapshot

  10.6.14.2 Product/Service Portfolio

  10.6.14.3 Key Company Financials

  10.6.14.4 SWOT Analysis

 10.6.15 Runlab

  10.6.15.1 Company Overview & Snapshot

  10.6.15.2 Product/Service Portfolio

  10.6.15.3 Key Company Financials

  10.6.15.4 SWOT Analysis

 10.6.16 ALPLA Group

  10.6.16.1 Company Overview & Snapshot

  10.6.16.2 Product/Service Portfolio

  10.6.16.3 Key Company Financials

  10.6.16.4 SWOT Analysis

 10.6.17 3Plastics

  10.6.17.1 Company Overview & Snapshot

  10.6.17.2 Product/Service Portfolio

  10.6.17.3 Key Company Financials

  10.6.17.4 SWOT Analysis

 10.6.18 Sanbio

  10.6.18.1 Company Overview & Snapshot

  10.6.18.2 Product/Service Portfolio

  10.6.18.3 Key Company Financials

  10.6.18.4 SWOT Analysis

 10.6.19 Miniplast

  10.6.19.1 Company Overview & Snapshot

  10.6.19.2 Product/Service Portfolio

  10.6.19.3 Key Company Financials

  10.6.19.4 SWOT Analysis

 10.6.20 Kartell/Sterilin

  10.6.20.1 Company Overview & Snapshot

  10.6.20.2 Product/Service Portfolio

  10.6.20.3 Key Company Financials

  10.6.20.4 SWOT Analysis

11. Analyst Recommendations

 11.1 SNS Insider Opportunity Map

 11.2 Industry Low-Hanging Fruit Assessment

 11.3 Market Entry & Growth Strategy

 11.4 Analyst Viewpoint & Suggestions On Market Growth

12. Assumptions

13. Disclaimer

14. Appendix

 14.1 List Of Tables

 14.2 List Of Figures

Key Segments

 By Product Type

  • Beakers

  • Bottles

  • Pipettes & Pipette Tips

  • Petri Dishes

  • Test Tubes

  • Funnels

  • Others (Cuvettes, Flasks, Tubing)

By Material Type

  • Polypropylene (PP)

  • Polystyrene (PS)

  • Polyethylene (PE)

  • Polycarbonate (PC)

  • Others (Teflon, Acrylic, PVC)

By End User

  • Pharmaceutical & Biotechnology Companies

  • Academic & Research Institutes

  • Diagnostic Laboratories

  • Hospitals & Clinics

  • Others (CROs, Forensic Labs)

By Application

  • Sample Storage

  • Fluid Handling

  • Cell Culture

  • Diagnostics

  • Others (Mixing, Separation, Filtration)

 Request for Segment Customization as per your Business Requirement: Segment Customization Request

Regional Coverage: 

North America

  • US

  • Canada

Europe

  • Germany

  • UK

  • France

  • Italy

  • Spain

  • Russia

  • Poland

  • Rest of Europe

Asia Pacific

  • China

  • India

  • Japan

  • South Korea

  • ASEAN Countries

  • Australia

  • Rest of Asia Pacific

Latin America

  • Brazil

  • Argentina

  • Mexico

  • Colombia

  • Rest of Latin America

Middle East & Africa

  • UAE

  • Saudi Arabia

  • Qatar

  • Egypt

  • South Africa

  • Rest of Middle East & Africa

Request for Country Level Research Report: Country Level Customization Request

Available Customization 

With the given market data, SNS Insider offers customization as per the company’s specific needs. The following customization options are available for the report: 

  • Detailed Volume Analysis 

  • Criss-Cross segment analysis (e.g. Product X Application) 

  • Competitive Product Benchmarking 

  • Geographic Analysis 

  • Additional countries in any of the regions 

  • Customized Data Representation 

  • Detailed analysis and profiling of additional market player

An accurate research report requires proper strategizing as well as implementation. There are multiple factors involved in the completion of good and accurate research report and selecting the best methodology to compete the research is the toughest part. Since the research reports we provide play a crucial role in any company’s decision-making process, therefore we at SNS Insider always believe that we should choose the best method which gives us results closer to reality. This allows us to reach at a stage wherein we can provide our clients best and accurate investment to output ratio.

Each report that we prepare takes a timeframe of 350-400 business hours for production. Starting from the selection of titles through a couple of in-depth brain storming session to the final QC process before uploading our titles on our website we dedicate around 350 working hours. The titles are selected based on their current market cap and the foreseen CAGR and growth.


The 5 steps process:

Step 1: Secondary Research:

Secondary Research or Desk Research is as the name suggests is a research process wherein, we collect data through the readily available information. In this process we use various paid and unpaid databases which our team has access to and gather data through the same. This includes examining of listed companies’ annual reports, Journals, SEC filling etc. Apart from this our team has access to various associations across the globe across different industries. Lastly, we have exchange relationships with various university as well as individual libraries.

Secondary Research

Step 2: Primary Research

When we talk about primary research, it is a type of study in which the researchers collect relevant data samples directly, rather than relying on previously collected data.  This type of research is focused on gaining content specific facts that can be sued to solve specific problems. Since the collected data is fresh and first hand therefore it makes the study more accurate and genuine.

We at SNS Insider have divided Primary Research into 2 parts.

Part 1 wherein we interview the KOLs of major players as well as the upcoming ones across various geographic regions. This allows us to have their view over the market scenario and acts as an important tool to come closer to the accurate market numbers. As many as 45 paid and unpaid primary interviews are taken from both the demand and supply side of the industry to make sure we land at an accurate judgement and analysis of the market.

This step involves the triangulation of data wherein our team analyses the interview transcripts, online survey responses and observation of on filed participants. The below mentioned chart should give a better understanding of the part 1 of the primary interview.

Primary Research

Part 2: In this part of primary research the data collected via secondary research and the part 1 of the primary research is validated with the interviews from individual consultants and subject matter experts.

Consultants are those set of people who have at least 12 years of experience and expertise within the industry whereas Subject Matter Experts are those with at least 15 years of experience behind their back within the same space. The data with the help of two main processes i.e., FGDs (Focused Group Discussions) and IDs (Individual Discussions). This gives us a 3rd party nonbiased primary view of the market scenario making it a more dependable one while collation of the data pointers.

Step 3: Data Bank Validation

Once all the information is collected via primary and secondary sources, we run that information for data validation. At our intelligence centre our research heads track a lot of information related to the market which includes the quarterly reports, the daily stock prices, and other relevant information. Our data bank server gets updated every fortnight and that is how the information which we collected using our primary and secondary information is revalidated in real time.

Data Bank Validation

Step 4: QA/QC Process

After all the data collection and validation our team does a final level of quality check and quality assurance to get rid of any unwanted or undesired mistakes. This might include but not limited to getting rid of the any typos, duplication of numbers or missing of any important information. The people involved in this process include technical content writers, research heads and graphics people. Once this process is completed the title gets uploader on our platform for our clients to read it.

Step 5: Final QC/QA Process:

This is the last process and comes when the client has ordered the study. In this process a final QA/QC is done before the study is emailed to the client. Since we believe in giving our clients a good experience of our research studies, therefore, to make sure that we do not lack at our end in any way humanly possible we do a final round of quality check and then dispatch the study to the client.