image

Light Commercial Vehicles Market Report Scope & Overview

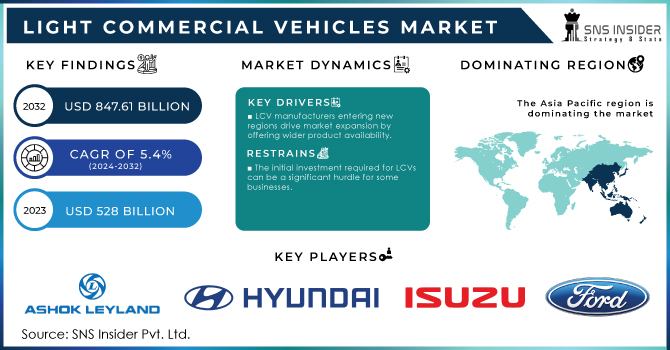
The Light Commercial Vehicles Market size was valued at USD 528 billion in 2023 and is expected to reach USD 804.19 billion by 2031 and grow at a CAGR of 5.4% over the forecast period 2024-2031.

Light commercial vehicles (LCVs) are a vital category within the automotive industry, specifically designed for transporting goods. They can be distinguished from larger trucks by their weight limitations, typically ranging from 3.5 to 7 tons depending on regulations. LCVs boast versatility, finding application across numerous sectors.

Light Commercial Vehicles Market Revenue Analysis

Get More Information on Light Commercial Vehicles Market - Request Sample Report

This adaptability has driven a growing demand for LCVs that are both economical and powerful. The demand for LCVs is driven by their wide applicability across various sectors. Businesses are recognizing the value of LCVs that offer a balance between cost-effectiveness and power, making them suitable for diverse transportation needs. This growing demand is further driven by the expansion of product lines by major LCV manufacturers.  LCVs offer greater fuel efficiency compared to larger trucks. This translates to cost savings for businesses and reduced environmental impact. As environmental concerns continue to rise, the fuel efficiency of LCVs becomes an increasingly attractive feature.

MARKET DYNAMICS:

KEY DRIVERS:

  • Rising online shopping fuels demand for efficient last-mile delivery solutions, perfectly suited for LCVs.

The surge in e-commerce has increased the demand for efficient and reliable last-mile delivery services. Light Commercial Vehicles (LCVs) are emerging as the perfect solution due to their inherent advantages. Their compact size and movability allow them to navigate congested streets and tight parking spaces with ease, ensuring timely deliveries even in dense urban environments. Thus, compared to larger trucks, LCVs offer greater fuel efficiency, contributing to a more sustainable delivery ecosystem.

  • LCV manufacturers entering new regions drive market expansion by offering wider product availability.

RESTRAINTS:

  • LCVs have a smaller payload capacity compared to larger trucks, restricting the volume of goods they can transport in a single trip.

  • The initial investment required for LCVs can be a significant hurdle for some businesses.

The LCVs offer numerous advantages but their adoption can be hindered by the initial investment required. The upfront costs associated with purchasing LCVs can be a significant hurdle for some businesses, particularly smaller operations. This financial barrier can limit their ability to modernize their fleet and embrace the benefits of LCV technology.  This financial barrier could potentially slow down the widespread adoption of LCVs in certain sectors.

OPPORTUNITIES:

  • Growing focus on sustainability creates an opportunity for electric LCVs offering eco-friendly deliveries.

CHALLENGES:

  • Increased reliance on technology in LCVs exposes them to potential data security breaches.

  • A shortage of qualified technicians to maintain and repair increasingly complex LCVs can impede market growth.

IMPACT OF RUSSIA-UKRAINE WAR

The war in Russia-Ukraine has impacted the Light Commercial Vehicle (LCV) market, disrupting its growth in several ways. The war and subsequent sanctions imposed on Russia have restricted access to crucial components needed for LCV manufacturing.  These parts, often produced by Western companies, are vital for functionalities like advanced driver-assistance systems and emission control technologies. This disrupts ongoing LCV projects in Russia and neighbouring countries relying on Russian suppliers. The global surge in material and energy prices significantly inflates the already high upfront costs associated with LCVs. This financial strain discourages potential investors and LCV operators in the affected region. There is a 2-3% decline in the global LCV market due to these logistical challenges and project delays.

IMPACT OF ECONOMIC SLOWDOWN

An economic slowdown can impact the Light Commercial Vehicle (LCV) market, potentially leading to a decline in sales by around 15-20%. When economic activity weakens, businesses tend to limit their budgets, leading to a decrease in investments in new vehicles, including LCVs. Reduced consumer spending also translates to lower demand for goods, impacting industries that rely heavily on LCVs for deliveries and transportation. This can cause a worse effect, with fewer deliveries translating to a decreased need for new LCVs. During economic downturns, access to credit becomes more difficult, making it harder for businesses to finance the purchase of new LCVs. Thus, the slowdown can lead to a decline in freight movement, negatively impacting the demand for LCVs in the logistics sector.

KEY MARKET SEGMENTS:

By Vehicle Type

  • Vans

  • Pickup Trucks

  • Light Trucks

Pickup Trucks is the dominating sub-segment in the Light Commercial Vehicles Market by vehicle type holding around 40-45% of market share. Pickup trucks offer a unique combination of cargo capacity and passenger space, making them highly versatile for various applications. They are popular in construction, landscaping, and service industries due to their ability to handle rough terrain and tow equipment.

Light-Commercial-Vehicles-Market-Segmentation-By-Vehicle-Type

 Get Customized Report as per your Business Requirement - Ask For Customized Report

By Fuel Type

  • Gasoline-powered LCVs

  • Diesel-powered LCVs

  • Electric LCVs

Gasoline-powered LCVs is the dominating sub-segment in the Light Commercial Vehicles Market by fuel type holding around 70-75% of market share. Gasoline remains the dominant fuel type due to its widespread availability, lower upfront vehicle cost compared to electric alternatives, and extensive refuelling infrastructure. However, this trend is expected to shift as electric LCVs become more cost-competitive and government regulations on emissions become stricter.

By End-Use Industry

  • Transportation and Logistics

  • Construction and Infrastructure

  • Agriculture and Farming

  • Service and Utility

  • Public Sector and Municipalities

Transportation and Logistics is the dominating sub-segment in the Light Commercial Vehicles Market by end-user industry. The ever-growing e-commerce sector and expanding global trade heavily rely on LCVs for efficient last-mile delivery and efficient movement of goods. This segment is expected to maintain its dominance due to the increasing demand for faster and more reliable transportation solutions.

REGIONAL ANALYSES

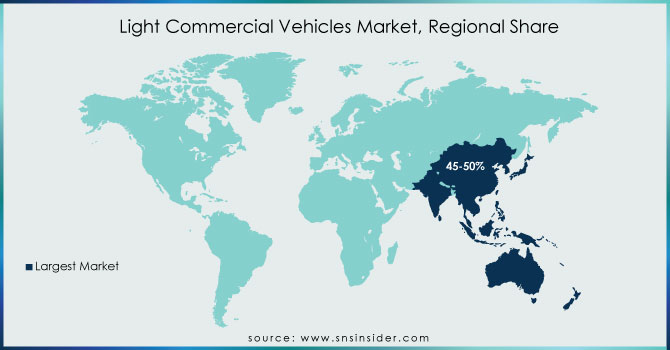
The Asia Pacific is the dominating region in the Light Commercial Vehicle Market holding around 45-50% of market share. This dominance stems from a confluence of factors. The rising economies are fueling demand for goods, necessitating efficient LCVs for transportation and logistics. The rapid urbanization and infrastructure development are creating opportunities for LCVs in construction and service sectors.

 North America is the second highest region in the Light Commercial Vehicle Market due to its well-established LCV manufacturing base and strong demand from construction, logistics, and service industries.

Europe is experiencing the fastest growth driven by stringent emission regulations promoting electric and hybrid LCVs, a growing focus on sustainable transportation, and investments in upgrading aging infrastructure, which necessitates efficient LCVs for maintenance and construction projects.

Light-Commercial-Vehicles-Market-By-Region

REGIONAL COVERAGE:

North America

  • US

  • Canada

  • Mexico

Europe

  • Eastern Europe

    • Poland

    • Romania

    • Hungary

    • Turkey

    • Rest of Eastern Europe

  • Western Europe

    • Germany

    • France

    • UK

    • Italy

    • Spain

    • Netherlands

    • Switzerland

    • Austria

    • Rest of Western Europe

Asia Pacific

  • China

  • India

  • Japan

  • South Korea

  • Vietnam

  • Singapore

  • Australia

  • Rest of Asia Pacific

Middle East & Africa

  • Middle East

    • UAE

    • Egypt

    • Saudi Arabia

    • Qatar

    • Rest of Middle East

  • Africa

    • Nigeria

    • South Africa

    • Rest of Africa

Latin America

  • Brazil

  • Argentina

  • Colombia

  • Rest of Latin America

KEY PLAYERS

The major key players are Ashok Leyland, Hyundai Motor Company, Ford Motor Company, Isuzu Motors, Gaz Group, General Motors, Honda Motor Company, Renault Group, Tata Motors, Toyota Motors and other key players.

Ashok Leyland-Company Financial Analysis

Company Landscape Analysis

RECENT DEVELOPMENT

  • In March 2023: Rivian teamed up with Morgan Olson to develop electric delivery vehicles. Rivian's advanced tech, including its chassis platform, will be incorporated into custom-made models like the Morgan Olson C250E for Canada Post.

  • In Oct. 2023: Stellantis is electrifying its commercial vehicle fleet in North America with four electric pickups and five electric vans. This expansion will encompass six brands and offer a total of 15 electric vehicles, including a micro-mobility solution.

Light Commercial Vehicles Market Report Scope:

Report Attributes Details
Market Size in 2023 US$ 528 Billion
Market Size by 2031 US$ 804.19 Billion
CAGR CAGR of 5.4% From 2024 to 2031
Base Year 2023
Forecast Period 2024-2031
Historical Data 2020-2022
Report Scope & Coverage Market Size, Segments Analysis, Competitive  Landscape, Regional Analysis, DROC & SWOT Analysis, Forecast Outlook
Key Segments • By Vehicle Type (Vans, Pickup Trucks, Light Trucks)
• By Fuel Type (Gasoline-powered LCVs, Diesel-powered LCVs, Electric LCVs)
• By End-Use Industry (Transportation and Logistics, Construction and Infrastructure, Agriculture and Farming, Service and Utility, Public Sector and Municipalities)
Regional Analysis/Coverage North America (US, Canada, Mexico), Europe (Eastern Europe [Poland, Romania, Hungary, Turkey, Rest of Eastern Europe] Western Europe] Germany, France, UK, Italy, Spain, Netherlands, Switzerland, Austria, Rest of Western Europe]), Asia Pacific (China, India, Japan, South Korea, Vietnam, Singapore, Australia, Rest of Asia Pacific), Middle East & Africa (Middle East [UAE, Egypt, Saudi Arabia, Qatar, Rest of Middle East], Africa [Nigeria, South Africa, Rest of Africa], Latin America (Brazil, Argentina, Colombia, Rest of Latin America)
Company Profiles Ashok Leyland, Hyundai Motor Company, Ford Motor Company, Isuzu Motors, Gaz Group, General Motors, Honda Motor Company, Renault Group, Tata Motors, and Toyota Motors 
Key Drivers • Government tax credits, subsidies, and incentives are driving demand for commercial vehicles.
• Expansion of the automotive manufacturing sector.
RESTRAINTS • Stringent CO2 emission laws have an impact on industrial costs.
• Emission regulations are stricter.

Frequently Asked Questions

Ans: The Light Commercial Vehicles Market was valued at USD 528 billion in 2023.

Ans:- A light commercial vehicle, often known as an LCV, is a type of automobile that has at least four wheels and is designed specifically for the transportation of products.

Ans:- North American region is anticipated to be the primary driver of the market.

Ans:- Yes.

Ans:-  Ashok Leyland, Hyundai Motor Company, Ford Motor Company, General Motors, Honda Motor Company, Renault Group, Tata Motors, and Toyota Motors are the most prominent players in the market.

TABLE OF CONTENTS

1. Introduction
1.1 Market Definition
1.2 Scope
1.3 Research Assumptions

2. Industry Flowchart

3. Research Methodology

4. Market Dynamics
4.1 Drivers
4.2 Restraints
4.3 Opportunities
4.4 Challenges
5. Impact Analysis

5.1 Impact of Russia-Ukraine Crisis
5.2 Impact of Economic Slowdown on Major Countries
5.2.1 Introduction
5.2.2 United States
5.2.3 Canada
5.2.4 Germany
5.2.5 France
5.2.6 UK
5.2.7 China
5.2.8 Japan
5.2.9 South Korea
5.2.10 India

6. Value Chain Analysis

7. Porter’s 5 Forces Model

8. Pest Analysis

9. Light Commercial Vehicles Market Segmentation, By Vehicle Type
9.1 Introduction
9.2 Trend Analysis
9.3 Vans
9.4 Pickup Trucks
9.5 Light Trucks

10. Light Commercial Vehicles Market Segmentation, By Fuel Type
10.1 Introduction
10.2 Trend Analysis
10.3 Gasoline-powered LCVs
10.4 Diesel-powered LCVs
10.5 Electric LCVs

11. Light Commercial Vehicles Market Segmentation, By End-Use Industry
11.1 Introduction
11.2 Trend Analysis
11.3 Transportation and Logistics
11.4 Construction and Infrastructure
11.5 Agriculture and Farming
11.6 Service and Utility
11.7 Public Sector and Municipalities

12. Regional Analysis
12.1 Introduction
12.2 North America
12.2.1 Trend Analysis
12.2.2 North America Light Commercial Vehicles Market, By Country
12.2.3 North America Light Commercial Vehicles Market Segmentation, By Vehicle Type
12.2.4 North America Light Commercial Vehicles Market Segmentation, By Fuel Type
12.2.5 North America Light Commercial Vehicles Market Segmentation, By End-Use Industry
12.2.6 USA
12.2.6.1 USA Light Commercial Vehicles Market Segmentation, By Vehicle Type
12.2.6.2 USA Light Commercial Vehicles Market Segmentation, By Fuel Type
12.2.6.3 USA Light Commercial Vehicles Market Segmentation, By End-Use Industry
12.2.7 Canada
12.2.7.1 Canada Light Commercial Vehicles Market Segmentation, By Vehicle Type
12.2.7.2 Canada Light Commercial Vehicles Market Segmentation, By Fuel Type
12.2.7.3 Canada Light Commercial Vehicles Market Segmentation, By End-Use Industry
12.2.8 Mexico
12.2.8.1 Mexico Light Commercial Vehicles Market Segmentation, By Vehicle Type
12.2.8.2 Mexico Light Commercial Vehicles Market Segmentation, By Fuel Type
12.2.8.3 Mexico Light Commercial Vehicles Market Segmentation, By End-Use Industry
12.3 Europe
12.3.1 Trend Analysis
12.3.2 Eastern Europe
12.3.2.1 Eastern Europe Light Commercial Vehicles Market, By Country
12.3.2.2 Eastern Europe Light Commercial Vehicles Market Segmentation, By Vehicle Type
12.3.2.3 Eastern Europe Light Commercial Vehicles Market Segmentation, By Fuel Type
12.3.2.4 Eastern Europe Light Commercial Vehicles Market Segmentation, By End-Use Industry
12.3.2.5 Poland
12.3.2.5.1 Poland Light Commercial Vehicles Market Segmentation, By Vehicle Type
12.3.2.5.2 Poland Light Commercial Vehicles Market Segmentation, By Fuel Type
12.3.2.5.3 Poland Light Commercial Vehicles Market Segmentation, By End-Use Industry
12.3.2.6 Romania
12.3.2.6.1 Romania Light Commercial Vehicles Market Segmentation, By Vehicle Type
12.3.2.6.2 Romania Light Commercial Vehicles Market Segmentation, By Fuel Type
12.3.2.6.4 Romania Light Commercial Vehicles Market Segmentation, By End-Use Industry
12.3.2.7 Hungary
12.3.2.7.1 Hungary Light Commercial Vehicles Market Segmentation, By Vehicle Type
12.3.2.7.2 Hungary Light Commercial Vehicles Market Segmentation, By Fuel Type
12.3.2.7.3 Hungary Light Commercial Vehicles Market Segmentation, By End-Use Industry
12.3.2.8 Turkey
12.3.2.8.1 Turkey Light Commercial Vehicles Market Segmentation, By Vehicle Type
12.3.2.8.2 Turkey Light Commercial Vehicles Market Segmentation, By Fuel Type
12.3.2.8.3 Turkey Light Commercial Vehicles Market Segmentation, By End-Use Industry
12.3.2.9 Rest of Eastern Europe
12.3.2.9.1 Rest of Eastern Europe Light Commercial Vehicles Market Segmentation, By Vehicle Type
12.3.2.9.2 Rest of Eastern Europe Light Commercial Vehicles Market Segmentation, By Fuel Type
12.3.2.9.3 Rest of Eastern Europe Light Commercial Vehicles Market Segmentation, By End-Use Industry
12.3.3 Western Europe
12.3.3.1 Western Europe Light Commercial Vehicles Market, By Country
12.3.3.2 Western Europe Light Commercial Vehicles Market Segmentation, By Vehicle Type
12.3.3.3 Western Europe Light Commercial Vehicles Market Segmentation, By Fuel Type
12.3.3.4 Western Europe Light Commercial Vehicles Market Segmentation, By End-Use Industry
12.3.3.5 Germany
12.3.3.5.1 Germany Light Commercial Vehicles Market Segmentation, By Vehicle Type
12.3.3.5.2 Germany Light Commercial Vehicles Market Segmentation, By Fuel Type
12.3.3.5.3 Germany Light Commercial Vehicles Market Segmentation, By End-Use Industry
12.3.3.6 France
12.3.3.6.1 France Light Commercial Vehicles Market Segmentation, By Vehicle Type
12.3.3.6.2 France Light Commercial Vehicles Market Segmentation, By Fuel Type
12.3.3.6.3 France Light Commercial Vehicles Market Segmentation, By End-Use Industry
12.3.3.7 UK
12.3.3.7.1 UK Light Commercial Vehicles Market Segmentation, By Vehicle Type
12.3.3.7.2 UK Light Commercial Vehicles Market Segmentation, By Fuel Type
12.3.3.7.3 UK Light Commercial Vehicles Market Segmentation, By End-Use Industry
12.3.3.8 Italy
12.3.3.8.1 Italy Light Commercial Vehicles Market Segmentation, By Vehicle Type
12.3.3.8.2 Italy Light Commercial Vehicles Market Segmentation, By Fuel Type
12.3.3.8.3 Italy Light Commercial Vehicles Market Segmentation, By End-Use Industry
12.3.3.9 Spain
12.3.3.9.1 Spain Light Commercial Vehicles Market Segmentation, By Vehicle Type
12.3.3.9.2 Spain Light Commercial Vehicles Market Segmentation, By Fuel Type
12.3.3.9.3 Spain Light Commercial Vehicles Market Segmentation, By End-Use Industry
12.3.3.10 Netherlands
12.3.3.10.1 Netherlands Light Commercial Vehicles Market Segmentation, By Vehicle Type
12.3.3.10.2 Netherlands Light Commercial Vehicles Market Segmentation, By Fuel Type
12.3.3.10.3 Netherlands Light Commercial Vehicles Market Segmentation, By End-Use Industry
12.3.3.11 Switzerland
12.3.3.11.1 Switzerland Light Commercial Vehicles Market Segmentation, By Vehicle Type
12.3.3.11.2 Switzerland Light Commercial Vehicles Market Segmentation, By Fuel Type
12.3.3.11.3 Switzerland Light Commercial Vehicles Market Segmentation, By End-Use Industry
12.3.3.1.12 Austria
12.3.3.12.1 Austria Light Commercial Vehicles Market Segmentation, By Vehicle Type
12.3.3.12.2 Austria Light Commercial Vehicles Market Segmentation, By Fuel Type
12.3.3.12.3 Austria Light Commercial Vehicles Market Segmentation, By End-Use Industry
12.3.3.13 Rest of Western Europe
12.3.3.13.1 Rest of Western Europe Light Commercial Vehicles Market Segmentation, By Vehicle Type
12.3.3.13.2 Rest of Western Europe Light Commercial Vehicles Market Segmentation, By Fuel Type
12.3.3.13.3 Rest of Western Europe Light Commercial Vehicles Market Segmentation, By End-Use Industry
12.4 Asia-Pacific
12.4.1 Trend Analysis
12.4.2 Asia-Pacific Light Commercial Vehicles Market, By Country
12.4.3 Asia-Pacific Light Commercial Vehicles Market Segmentation, By Vehicle Type
12.4.4 Asia-Pacific Light Commercial Vehicles Market Segmentation, By Fuel Type
12.4.5 Asia-Pacific Light Commercial Vehicles Market Segmentation, By End-Use Industry
12.4.6 China
12.4.6.1 China Light Commercial Vehicles Market Segmentation, By Vehicle Type
12.4.6.2 China Light Commercial Vehicles Market Segmentation, By Fuel Type
12.4.6.3 China Light Commercial Vehicles Market Segmentation, By End-Use Industry
12.4.7 India
12.4.7.1 India Light Commercial Vehicles Market Segmentation, By Vehicle Type
12.4.7.2 India Light Commercial Vehicles Market Segmentation, By Fuel Type
12.4.7.3 India Light Commercial Vehicles Market Segmentation, By End-Use Industry
12.4.8 Japan
12.4.8.1 Japan Light Commercial Vehicles Market Segmentation, By Vehicle Type
12.4.8.2 Japan Light Commercial Vehicles Market Segmentation, By Fuel Type
12.4.8.3 Japan Light Commercial Vehicles Market Segmentation, By End-Use Industry
12.4.9 South Korea
12.4.9.1 South Korea Light Commercial Vehicles Market Segmentation, By Vehicle Type
12.4.9.2 South Korea Light Commercial Vehicles Market Segmentation, By Fuel Type
12.4.9.3 South Korea Light Commercial Vehicles Market Segmentation, By End-Use Industry
12.4.10 Vietnam
12.4.10.1 Vietnam Light Commercial Vehicles Market Segmentation, By Vehicle Type
12.4.10.2 Vietnam Light Commercial Vehicles Market Segmentation, By Fuel Type
12.4.10.3 Vietnam Light Commercial Vehicles Market Segmentation, By End-Use Industry
12.4.11 Singapore
12.4.11.1 Singapore Light Commercial Vehicles Market Segmentation, By Vehicle Type
12.4.11.2 Singapore Light Commercial Vehicles Market Segmentation, By Fuel Type
12.4.11.3 Singapore Light Commercial Vehicles Market Segmentation, By End-Use Industry
12.4.12 Australia
12.4.12.1 Australia Light Commercial Vehicles Market Segmentation, By Vehicle Type
12.4.12.2 Australia Light Commercial Vehicles Market Segmentation, By Fuel Type
12.4.12.3 Australia Light Commercial Vehicles Market Segmentation, By End-Use Industry
12.4.13 Rest of Asia-Pacific
12.4.13.1 Rest of Asia-Pacific Light Commercial Vehicles Market Segmentation, By Vehicle Type
12.4.13.2 Rest of Asia-Pacific Light Commercial Vehicles Market Segmentation, By Fuel Type
12.4.13.3 Rest of Asia-Pacific Light Commercial Vehicles Market Segmentation, By End-Use Industry
12.5 Middle East & Africa
12.5.1 Trend Analysis
12.5.2 Middle East
12.5.2.1 Middle East Light Commercial Vehicles Market, By Country
12.5.2.2 Middle East Light Commercial Vehicles Market Segmentation, By Vehicle Type
12.5.2.3 Middle East Light Commercial Vehicles Market Segmentation, By Fuel Type
12.5.2.4 Middle East Light Commercial Vehicles Market Segmentation, By End-Use Industry
12.5.2.5 UAE
12.5.2.5.1 UAE Light Commercial Vehicles Market Segmentation, By Vehicle Type
12.5.2.5.2 UAE Light Commercial Vehicles Market Segmentation, By Fuel Type
12.5.2.5.3 UAE Light Commercial Vehicles Market Segmentation, By End-Use Industry
12.5.2.6 Egypt
12.5.2.6.1 Egypt Light Commercial Vehicles Market Segmentation, By Vehicle Type
12.5.2.6.2 Egypt Light Commercial Vehicles Market Segmentation, By Fuel Type
12.5.2.6.3 Egypt Light Commercial Vehicles Market Segmentation, By End-Use Industry
12.5.2.7 Saudi Arabia
12.5.2.7.1 Saudi Arabia Light Commercial Vehicles Market Segmentation, By Vehicle Type
12.5.2.7.2 Saudi Arabia Light Commercial Vehicles Market Segmentation, By Fuel Type
12.5.2.7.3 Saudi Arabia Light Commercial Vehicles Market Segmentation, By End-Use Industry
12.5.2.8 Qatar
12.5.2.8.1 Qatar Light Commercial Vehicles Market Segmentation, By Vehicle Type
12.5.2.8.2 Qatar Light Commercial Vehicles Market Segmentation, By Fuel Type
12.5.2.8.3 Qatar Light Commercial Vehicles Market Segmentation, By End-Use Industry
12.5.2.9 Rest of Middle East
12.5.2.9.1 Rest of Middle East Light Commercial Vehicles Market Segmentation, By Vehicle Type
12.5.2.9.2 Rest of Middle East Light Commercial Vehicles Market Segmentation, By Fuel Type
12.5.2.9.3 Rest of Middle East Light Commercial Vehicles Market Segmentation, By End-Use Industry
12.5.3 Africa
12.5.3.1 Africa Light Commercial Vehicles Market, By Country
12.5.3.2 Africa Light Commercial Vehicles Market Segmentation, By Vehicle Type
12.5.3.3 Africa Light Commercial Vehicles Market Segmentation, By Fuel Type
12.5.3.4 Africa Light Commercial Vehicles Market Segmentation, By End-Use Industry
12.5.3.5 Nigeria
12.5.3.5.1 Nigeria Light Commercial Vehicles Market Segmentation, By Vehicle Type
12.5.3.5.2 Nigeria Light Commercial Vehicles Market Segmentation, By Fuel Type
12.5.3.5.3 Nigeria Light Commercial Vehicles Market Segmentation, By End-Use Industry
12.5.3.6 South Africa
12.5.3.6.1 South Africa Light Commercial Vehicles Market Segmentation, By Vehicle Type
12.5.3.6.2 South Africa Light Commercial Vehicles Market Segmentation, By Fuel Type
12.5.3.6.3 South Africa Light Commercial Vehicles Market Segmentation, By End-Use Industry
12.5.3.7 Rest of Africa
12.5.3.7.1 Rest of Africa Light Commercial Vehicles Market Segmentation, By Vehicle Type
12.5.3.7.2 Rest of Africa Light Commercial Vehicles Market Segmentation, By Fuel Type
12.5.3.7.3 Rest of Africa Light Commercial Vehicles Market Segmentation, By End-Use Industry
12.6 Latin America
12.6.1 Trend Analysis
12.6.2 Latin America Light Commercial Vehicles Market, By Country
12.6.3 Latin America Light Commercial Vehicles Market Segmentation, By Vehicle Type
12.6.4 Latin America Light Commercial Vehicles Market Segmentation, By Fuel Type
12.6.5 Latin America Light Commercial Vehicles Market Segmentation, By End-Use Industry
12.6.6 Brazil
12.6.6.1 Brazil Light Commercial Vehicles Market Segmentation, By Vehicle Type
12.6.6.2 Brazil Light Commercial Vehicles Market Segmentation, By Fuel Type
12.6.6.3 Brazil Light Commercial Vehicles Market Segmentation, By End-Use Industry
12.6.7 Argentina
12.6.7.1 Argentina Light Commercial Vehicles Market Segmentation, By Vehicle Type
12.6.7.2 Argentina Light Commercial Vehicles Market Segmentation, By Fuel Type
12.6.7.3 Argentina Light Commercial Vehicles Market Segmentation, By End-Use Industry
12.6.8 Colombia
12.6.8.1 Colombia Light Commercial Vehicles Market Segmentation, By Vehicle Type
12.6.8.2 Colombia Light Commercial Vehicles Market Segmentation, By Fuel Type
12.6.8.3 Colombia Light Commercial Vehicles Market Segmentation, By End-Use Industry
12.6.9 Rest of Latin America
12.6.9.1 Rest of Latin America Light Commercial Vehicles Market Segmentation, By Vehicle Type
12.6.9.2 Rest of Latin America Light Commercial Vehicles Market Segmentation, By Fuel Type
12.6.9.3 Rest of Latin America Light Commercial Vehicles Market Segmentation, By End-Use Industry

13. Company Profiles
13.1 Ashok Leyland
13.1.1 Company Overview
13.1.2 Financial
13.1.3 Products/ Services Offered
13.1.4 SWOT Analysis
13.1.5 The SNS View
13.2 Hyundai Motor Company
13.2.1 Company Overview
13.2.2 Financial
13.2.3 Products/ Services Offered
13.2.4 SWOT Analysis
13.2.5 The SNS View
13.3 Ford Motor Company
13.3.1 Company Overview
13.3.2 Financial
13.3.3 Products/ Services Offered
13.3.4 SWOT Analysis
13.3.5 The SNS View
13.4 Isuzu Motors
13.4.1 Company Overview
13.4.2 Financial
13.4.3 Products/ Services Offered
13.4.4 SWOT Analysis
13.4.5 The SNS View
13.5 Gaz Group
13.5.1 Company Overview
13.5.2 Financial
13.5.3 Products/ Services Offered
13.5.4 SWOT Analysis
13.5.5 The SNS View
13.6 General Motors
13.6.1 Company Overview
13.6.2 Financial
13.6.3 Products/ Services Offered
13.6.4 SWOT Analysis
13.6.5 The SNS View
13.7 Honda Motor Company
13.7.1 Company Overview
13.7.2 Financial
13.7.3 Products/ Services Offered
13.7.4 SWOT Analysis
13.7.5 The SNS View
13.8 Renault Group
13.8.1 Company Overview
13.8.2 Financial
13.8.3 Products/ Services Offered
13.8.4 SWOT Analysis
13.8.5 The SNS View
13.9 Tata Motors
13.9.1 Company Overview
13.9.2 Financial
13.9.3 Products/ Services Offered
13.9.4 SWOT Analysis
13.9.5 The SNS View
13.10 Toyota Motors
13.10.1 Company Overview
13.10.2 Financial
13.10.3 Products/ Services Offered
13.10.4 SWOT Analysis
13.10.5 The SNS View

14. Competitive Landscape
14.1 Competitive Benchmarking
14.2 Market Share Analysis
14.3 Recent Developments
14.3.1 Industry News
14.3.2 Company News
14.3.3 Mergers & Acquisitions

15. Use Case and Best Practices

16. Conclusion

An accurate research report requires proper strategizing as well as implementation. There are multiple factors involved in the completion of good and accurate research report and selecting the best methodology to compete the research is the toughest part. Since the research reports we provide play a crucial role in any company’s decision-making process, therefore we at SNS Insider always believe that we should choose the best method which gives us results closer to reality. This allows us to reach at a stage wherein we can provide our clients best and accurate investment to output ratio.

Each report that we prepare takes a timeframe of 350-400 business hours for production. Starting from the selection of titles through a couple of in-depth brain storming session to the final QC process before uploading our titles on our website we dedicate around 350 working hours. The titles are selected based on their current market cap and the foreseen CAGR and growth.


The 5 steps process:

Step 1: Secondary Research:

Secondary Research or Desk Research is as the name suggests is a research process wherein, we collect data through the readily available information. In this process we use various paid and unpaid databases which our team has access to and gather data through the same. This includes examining of listed companies’ annual reports, Journals, SEC filling etc. Apart from this our team has access to various associations across the globe across different industries. Lastly, we have exchange relationships with various university as well as individual libraries.

Secondary Research

Step 2: Primary Research

When we talk about primary research, it is a type of study in which the researchers collect relevant data samples directly, rather than relying on previously collected data.  This type of research is focused on gaining content specific facts that can be sued to solve specific problems. Since the collected data is fresh and first hand therefore it makes the study more accurate and genuine.

We at SNS Insider have divided Primary Research into 2 parts.

Part 1 wherein we interview the KOLs of major players as well as the upcoming ones across various geographic regions. This allows us to have their view over the market scenario and acts as an important tool to come closer to the accurate market numbers. As many as 45 paid and unpaid primary interviews are taken from both the demand and supply side of the industry to make sure we land at an accurate judgement and analysis of the market.

This step involves the triangulation of data wherein our team analyses the interview transcripts, online survey responses and observation of on filed participants. The below mentioned chart should give a better understanding of the part 1 of the primary interview.

Primary Research

Part 2: In this part of primary research the data collected via secondary research and the part 1 of the primary research is validated with the interviews from individual consultants and subject matter experts.

Consultants are those set of people who have at least 12 years of experience and expertise within the industry whereas Subject Matter Experts are those with at least 15 years of experience behind their back within the same space. The data with the help of two main processes i.e., FGDs (Focused Group Discussions) and IDs (Individual Discussions). This gives us a 3rd party nonbiased primary view of the market scenario making it a more dependable one while collation of the data pointers.

Step 3: Data Bank Validation

Once all the information is collected via primary and secondary sources, we run that information for data validation. At our intelligence centre our research heads track a lot of information related to the market which includes the quarterly reports, the daily stock prices, and other relevant information. Our data bank server gets updated every fortnight and that is how the information which we collected using our primary and secondary information is revalidated in real time.

Data Bank Validation

Step 4: QA/QC Process

After all the data collection and validation our team does a final level of quality check and quality assurance to get rid of any unwanted or undesired mistakes. This might include but not limited to getting rid of the any typos, duplication of numbers or missing of any important information. The people involved in this process include technical content writers, research heads and graphics people. Once this process is completed the title gets uploader on our platform for our clients to read it.

Step 5: Final QC/QA Process:

This is the last process and comes when the client has ordered the study. In this process a final QA/QC is done before the study is emailed to the client. Since we believe in giving our clients a good experience of our research studies, therefore, to make sure that we do not lack at our end in any way humanly possible we do a final round of quality check and then dispatch the study to the client.


  •            5000 (33% Discount)


  •            8950 (40% Discount)


  •            3050 (23% Discount)

Start a Conversation

Hi! Click one of our member below to chat on Phone