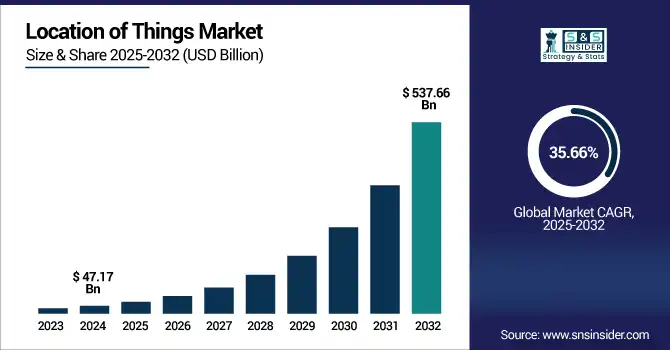
Location of Things Market was valued at USD 47.17 billion in 2024 and is expected to reach USD 537.66 billion by 2032, growing at a CAGR of 35.66% from 2025-2032.
The Location of Things market is growing rapidly due to increasing adoption of IoT-enabled devices, rising demand for real-time location data, advancements in GPS and connectivity technologies, and expanding applications across logistics, transportation, and smart cities. Enhanced decision-making and operational efficiency further drive market expansion globally.
Microsoft’s 2023 IoT Report reveals that over 80% of enterprises leverage location data to improve supply chain visibility and operational decision-making, with many reporting over a 20% reduction in logistics costs.
Additionally, the U.S. Department of Transportation has invested more than USD 1.3 billion in connected vehicle technology, focusing on real-time location and vehicle-to-everything (V2X) communication.
Leading logistics companies like UPS have deployed real-time tracking systems across over 50,000 GPS-enabled vehicles, optimizing route planning and delivery times through advanced location data analytics.
U.S. Location of Things Market was valued at USD 13.25 billion in 2024 and is expected to reach USD 148.90 billion by 2032, growing at a CAGR of 35.31% from 2025-2032.
The U.S. Location of Things market is expanding due to rising smart infrastructure projects, high IoT adoption, advanced connectivity, and growing demand for real-time tracking in transportation, retail, and logistics. Strong tech ecosystem and regulatory support further fuel growth.
The U.S. Smart Cities Initiative supports over 100 cities in deploying IoT and location-based technologies for better urban management, backed by over $160 million in federal grants.
In 2024, the U.S. Department of Transportation's Federal Highway Administration announced over $96 million in grants to 16 states for 20 projects under the Advanced Transportation Technology and Innovation (ATTAIN) program.
Drivers
Increased demand for advanced navigation and traffic management fuels precision mapping and spatial analytics capabilities.
The relentless surge in urbanization and city congestion creates a pressing need for intelligent navigation and traffic control. GPS-based route improvement and live traffic information is achievable through Location of Things technologies. This data helps smart city initiatives improve traffic flow, enhance emergency response, and aid urban planning activities. Accurate location data is crucial for autonomous vehicles and fleet management. The expansion of the location market worldwide is enabled through investments in connected infrastructure as well as real-time analytics.
The U.S. Department of Transportation's Strengthening Mobility and Revolutionizing Transportation (SMART) Grants program is set to provide up to USD 500 million over five years for smart community technologies and systems that improve transportation safety and efficiency.
The U.S. Department of Transportation has introduced the Rural Automated Vehicle (RAV) Research Program with a USD 25 million funding opportunity aimed at integrating automated vehicle technology into rural and Tribal communities to enhance safety.
Additionally, the Biden-Harris Administration announced over $96 million in grants to various states for deploying smart traffic technology, supporting projects such as integrating connected vehicle infrastructure and enhancing data collection systems to improve transportation safety and mobility.
Restraints
Data privacy concerns and regulatory uncertainties restrict the deployment of location-based services in consumer-focused applications.
The collection of location data is susceptible to privacy and control problems given that stricter data protection laws can lead to more stringent regulation. Users are getting aware that their data is tracked, and this makes them reluctant for location-based services. Regulatory requirements present compliance challenges and enhance liability risk for companies. Thus, many companies either take a conservative stance or refrain from some applications entirely, thereby impeding market development in privacy-conscious markets and the capabilities of location-based technologies in these contexts.
Opportunities
Integration of AI with geolocation data opens new frontiers in predictive analytics, automation, and customer personalization.
Integration of AI with geolocation data has transformed the spatial analysis and movement prediction domain. This allows for process delivery with real time insights, predictive modeling and automation. Retailers have hyper-personalized deals that are based on movement and logistics firms predict whether delivery will be delayed by examining real-time data and using AI-driven routing. By doing so, it extends Location of Things into strategic planning, marketing, and autonomous systems. The adoption of AI at an increasing rate is enabling new path-breaking data-driven services and therefore result in a major new opportunity by boosting the market for organizations that can utilize these technologies.
Tesla plans to launch its robotaxi service in Austin in June 2025, starting with a limited pilot rollout of about 10 autonomous Model Y vehicles. The company aims to scale the program to 1,000 robotaxis within a few months, utilizing a fleet of self-driving Teslas nationwide. T
he U.S. Department of Defense (DoD) and the U.S. Air Force (USAF) have issued a Small Business Innovation Research (SBIR) topic for 2025, focusing on the development of secure geolocation relay and analytics services.
Meanwhile, the General Services Administration (GSA) has developed the AI Guide for Government to assist federal agencies in understanding and implementing AI technologies. This guide provides insights into AI applications, including predictive analytics and geolocation data integration.
Challenges
Inconsistent location accuracy in dense urban and indoor environments affects reliability of real-time decision-making systems.
GPS signals are blocked inside buildings and dense urban settings, making locating people in an emergency, navigating indoors or tracking assets very challenging. There are alternatives, including Wi-Fi triangulation and BLE beacons, but these are costly and complicated for deployment. In critical sectors, inconsistent accuracy undermines user trust and reliability. These technical limitations need to be overcome for the full potential of the Location of Things market to be realized and for these applications to scale properly.
By Location Type
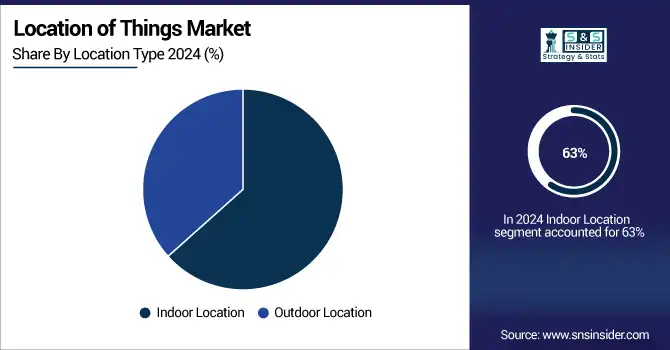
Indoor Location segment dominated the Location of Things Market with the highest revenue share of about 63% in 2024 as it is extensively used in commercial buildings, airports, shopping malls and healthcare facilities. Companies utilize indoor location services for tracking assets, crowd analytics, navigation, and personal services. With the highest demand due to the need for real-time indoor positioning & operational efficiency, which is increasing in various domains.
Outdoor Location segment is expected to grow at the fastest CAGR of about 36.99% from 2025–2032 due to rising usage & benefits of location-based services in agriculture, autonomous vehicles, environmental monitoring, and logistics. More precise location and better coverage Satellite technologies are getting more precise and the emergence of the 5G network is improving location accuracy and coverage. This segment is quickly growing at the highest growth rate due to the rapid expansion of smart cities and outdoor safety applications additionally the high demand for location-aware mobility services.
By Location Type
Government, Defence, and Public Utilities segment dominated the Location of Things Market with the highest revenue share of about 25.30% in 2024 as governments and enterprises alike invested heavily in infrastructure modernization, public security, and emergency response systems. In these sectors, geolocation is employed for monitoring, disaster management and resource distribution. Proper mission-critical real-time data has made Government and defense entities, the largest early adopter of secure and scalable location intelligence platforms.
Transportation and Logistics segment is expected to grow at the fastest CAGR of about 37.49% from 2025–2032 due to the rapid adoption of applications such as Fleet Management, Route Optimization, and Supply Chain Visibility. Delivery, fuel cost, and autonomous mobility operations all benefit from location data. A further driver for the adoption of real time tracking solutions across urban and long-haul transportation networks is the growth of e-commerce and cross-border trade.
By Application
Mapping and Navigation segment dominated the Location of Things Market with the highest revenue share of about 28% in 2024 due to its role as a fundamental aspect of the location-based application. It backs everything from consumer apps to enterprise logistics and autonomous systems. This segment has taken the lead in making location intelligence and spatial decision-making possible, thanks to high dependence on GPS data, mapping platforms, and real-time route guidance over various industries.
Media and Marketing Engagement segment is expected to grow at the fastest CAGR of about 37.36% from 2025–2032 due to rising demand for hyper-personalized, location-targeted campaigns. Contextual content delivery, ad placement optimization and consumer engagement all get a real-time boost from geolocation, as businesses are taking advantage of this. The segment is set to explode with adoption, as the business of those business is increasingly data-driven, the mainstream embrace of location-driven analytics in retail, events, and digital media.
Regional Analysis
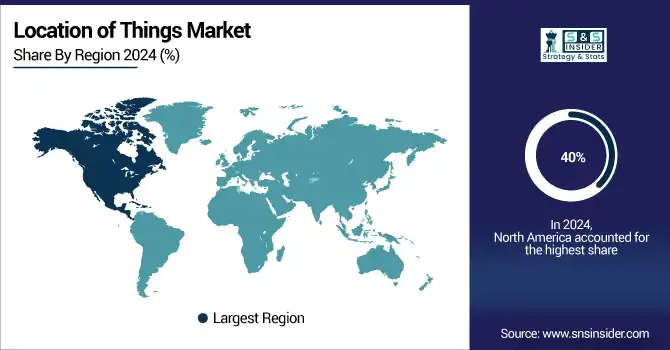
North America dominated the Location of Things Market with the highest revenue share of about 40% in 2024 due to higher productivity of IoT technology implementation, more lucrative digital infrastructure and a wide variety of leading companies. That encourages constant demand backed by its widespread deployment in smart cities, defense, logistics, and retail sectors. The region has been strengthened by supportive regulatory frameworks and high investment in R&D, which led to early and widespread adoption of location-based technologies.
The U.S. dominated the Location of Things Market due to robust IoT infrastructure, strong tech ecosystem, and widespread adoption across transportation, defense, and retail sectors.
Asia Pacific is expected to grow at the fastest CAGR of about 38.07% from 2025–2032 driven by rapid urbanization, growing smart city projects, and higher mobile phone adoption. Connected infrastructure and real-time mobility solutions are a key focus area for governments in China, India, and Southeast Asia, who are investing heavily to catalyze the transformation in cities. With rapid regional growth in e-commerce, transportation, and manufacturing, the demand for location intelligence to optimize operational efficiency and customer experience is gaining traction.
China is dominating the Location of Things Market in Asia Pacific due to massive smart city initiatives, advanced manufacturing, and rapid expansion of connected infrastructure.
Europe is a significant player in the Location of Things Market due to strong government support for smart city projects, advanced transportation networks, and growing adoption of IoT technologies across logistics, public safety, and industrial automation sectors.
Germany is dominating the Location of Things Market in Europe due to strong industrial automation, advanced manufacturing, and high investment in smart infrastructure technologies.
Middle East & Africa are emerging in the Location of Things Market driven by smart city developments, infrastructure modernization, and increased investment in security and utilities. Latin America is growing due to rising urbanization, digital transformation, and expanding logistics networks.
ESRI, Wireless Logic, HERE, TruePosition, Inc., Navizon, Inc., Bosch Software Innovations GMBH, Pitney Bowes, Inc., TIBCO Software, Trimble, Inc., Qualcomm Technologies, Inc., Ubisense Group PLC, Google, Inc., IBM Corporation, Microsoft Corporation, Telogis
In 2024, the release of ibi WebFOCUS Reporting Server 9.3.4 introduced enhancements to data management, visual discovery, and predictive analytics, empowering users to leverage data more effectively.
In June 2024, Esri rebranded its ArcGIS Platform to the ArcGIS Location Platform, introducing a dedicated site and dashboard. This update streamlines developer access to tools and services, enhancing user experience
In November 2024, Wireless Logic's Conexa eSIM was integrated into u-blox's LTE CAT 1 BIS modules, enhancing global IoT connectivity with multi-IMSI support and eUICC technology.
Report Attributes | Details |
---|---|
Market Size in 2024 | USD 47.17 Billion |
Market Size by 2032 | USD 537.66 Billion |
CAGR | CAGR of 35.66% From 2025 to 2032 |
Base Year | 2024 |
Forecast Period | 2025-2032 |
Historical Data | 2021-2023 |
Report Scope & Coverage | Market Size, Segments Analysis, Competitive Landscape, Regional Analysis, DROC & SWOT Analysis, Forecast Outlook |
Key Segments | •By Location Type(Indoor Location, Outdoor Location) •By Application(Mapping and Navigation, Asset Management, Location Intelligence, Media and Marketing Engagement) •By Vertical(Government, Defence, and Public Utilities, Transportation and Logistics, Retail and Consumer Goods, Manufacturing and Industrial, Healthcare & Life Sciences, BFSI, Others) |
Regional Analysis/Coverage | North America (US, Canada, Mexico), Europe (Germany, France, UK, Italy, Spain, Poland, Turkey, Rest of Europe), Asia Pacific (China, India, Japan, South Korea, Singapore, Australia, Rest of Asia Pacific), Middle East & Africa (UAE, Saudi Arabia, Qatar, South Africa, Rest of Middle East & Africa), Latin America (Brazil, Argentina, Rest of Latin America) |
Company Profiles | ESRI, Wireless Logic, HERE, TruePosition, Inc., Navizon, Inc., Bosch Software Innovations GMBH, Pitney Bowes, Inc., TIBCO Software, Trimble, Inc., Qualcomm Technologies, Inc., Ubisense Group PLC, Google, Inc., IBM Corporation, Microsoft Corporation, Telogis |
Ans: The Location of Things Market is projected to grow at a CAGR of 35.66% from 2025 to 2032, driven by expanding IoT and smart applications.
Ans: The Location of Things Market was valued at USD 47.17 billion in 2024, reflecting growing demand for real-time location and spatial intelligence services.
Ans: Key growth is driven by rising adoption of IoT devices, real-time tracking, and expanding use across smart cities, logistics, and transportation sectors.
Ans: The Indoor Location segment led in 2024, with a 63% revenue share, due to usage in malls, hospitals, airports, and smart buildings.
Ans: North America dominated with a 40% revenue share in 2024, supported by advanced infrastructure, strong tech firms, and early IoT adoption
Table of Contents
1. Introduction
1.1 Market Definition
1.2 Scope (Inclusion and Exclusions)
1.3 Research Assumptions
2. Executive Summary
2.1 Market Overview
2.2 Regional Synopsis
2.3 Competitive Summary
3. Research Methodology
3.1 Top-Down Approach
3.2 Bottom-up Approach
3.3. Data Validation
3.4 Primary Interviews
4. Market Dynamics Impact Analysis
4.1 Market Driving Factors Analysis
4.1.1 Drivers
4.1.2 Restraints
4.1.3 Opportunities
4.1.4 Challenges
4.2 PESTLE Analysis
4.3 Porter’s Five Forces Model
5. Statistical Insights and Trends Reporting
5.1 Data Generation Volume
5.2 Accuracy Levels of Location Services
5.3 Power Consumption Benchmarks
5.4 Location-based Event Triggers
5.5 Integration Statistics
5.6 Security Incident Rate
6. Competitive Landscape
6.1 List of Major Companies, By Region
6.2 Market Share Analysis, By Region
6.3 Product Benchmarking
6.3.1 Product specifications and features
6.3.2 Pricing
6.4 Strategic Initiatives
6.4.1 Marketing and promotional activities
6.4.2 Distribution and Supply Chain Strategies
6.4.3 Expansion plans and new Product launches
6.4.4 Strategic partnerships and collaborations
6.5 Technological Advancements
6.6 Market Positioning and Branding
7. Location of Things Market Segmentation By Application
7.1 Chapter Overview
7.2 Mapping And Navigation
7.2.1 Mapping And Navigation Market Trends Analysis (2021-2032)
7.2.2 Mapping And Navigation Market Size Estimates and Forecasts to 2032 (USD Billion)
7.3 Asset Management
7.3.1 Asset Management Market Trends Analysis (2021-2032)
7.3.2 Asset Management Market Size Estimates and Forecasts to 2032 (USD Billion)
7.4 Location Intelligence
7.4.1 Location Intelligence Market Trends Analysis (2021-2032)
7.4.2 Location Intelligence Market Size Estimates and Forecasts to 2032 (USD Billion)
7.5 Financial Advisory Consulting
7.5.1 Financial Advisory Consulting Market Trends Analysis (2021-2032)
7.5.2 Financial Advisory Consulting Market Size Estimates and Forecasts to 2032 (USD Billion)
8. Location of Things Market Segmentation By Location Type
8.1 Chapter Overview
8.2 Indoor Location
8.2.1 Indoor Location Market Trend Analysis (2021-2032)
8.2.2 Indoor Location Market Size Estimates and Forecasts to 2032 (USD Billion)
8.3 Outdoor Location
8.3.1 Outdoor Location Market Trends Analysis (2021-2032)
8.3.2 Outdoor Location Market Size Estimates and Forecasts to 2032 (USD Billion)
9. Location of Things Market Segmentation By End User
9.1 Chapter Overview
9.2 BFSI
9.2.1 BFSI Market Trends Analysis (2021-2032)
9.2.2 BFSI Market Size Estimates and Forecasts to 2032 (USD Billion)
9.3 Retail And Consumer Goods
9.3.1 Retail And Consumer Goods Market Trends Analysis (2021-2032)
9.3.2 Retail And Consumer Goods Market Size Estimates and Forecasts to 2032 (USD Billion)
9.4 Transportation And Logistics
9.4.1 Transportation And Logistics Market Trends Analysis (2021-2032)
9.4.2 Transportation And Logistics Market Size Estimates and Forecasts to 2032 (USD Billion)
9.5 Government, Defence, And Public Utilities
9.5.1 Government, Defence, And Public Utilities Market Trends Analysis (2021-2032)
9.5.2 Government, Defence, And Public Utilities Market Size Estimates and Forecasts to 2032 (USD Billion)
9.6 Healthcare & Life Sciences
9.6.1 Healthcare & Life Sciences Market Trends Analysis (2021-2032)
9.6.2 Healthcare & Life Sciences Market Size Estimates and Forecasts to 2032 (USD Billion)
9.7 Manufacturing And Industrial
9.7.1 Manufacturing And Industrial Market Trends Analysis (2021-2032)
9.7.2 Manufacturing And Industrial Market Size Estimates and Forecasts to 2032 (USD Billion)
9.8 Others
9.8.1 Others Market Trends Analysis (2021-2032)
9.8.2 Others Market Size Estimates and Forecasts to 2032 (USD Billion)
10. Regional Analysis
10.1 Chapter Overview
10.2 North America
10.2.1 Trends Analysis
10.2.2 North America Location of Things Market Estimates and Forecasts, by Country (2021-2032) (USD Billion)
10.2.3 North America Location of Things Market Estimates and Forecasts, By Application (2021-2032) (USD Billion)
10.2.4 North America Location of Things Market Estimates and Forecasts, By Location Type (2021-2032) (USD Billion)
10.2.5 North America Location of Things Market Estimates and Forecasts, By End User (2021-2032) (USD Billion)
10.2.6 USA
10.2.6.1 USA Location of Things Market Estimates and Forecasts, By Application (2021-2032) (USD Billion)
10.2.6.2 USA Location of Things Market Estimates and Forecasts, By Location Type (2021-2032) (USD Billion)
10.2.6.3 USA Location of Things Market Estimates and Forecasts, By End User (2021-2032) (USD Billion)
10.2.7 Canada
10.2.7.1 Canada Location of Things Market Estimates and Forecasts, By Application (2021-2032) (USD Billion)
10.2.7.2 Canada Location of Things Market Estimates and Forecasts, By Location Type (2021-2032) (USD Billion)
10.2.7.3 Canada Location of Things Market Estimates and Forecasts, By End User (2021-2032) (USD Billion)
10.2.8 Mexico
10.2.8.1 Mexico Location of Things Market Estimates and Forecasts, By Application (2021-2032) (USD Billion)
10.2.8.2 Mexico Location of Things Market Estimates and Forecasts, By Location Type (2021-2032) (USD Billion)
10.2.8.3 Mexico Location of Things Market Estimates and Forecasts, By End User (2021-2032) (USD Billion)
10.3 Europe
10.3.1 Trends Analysis
10.3.2 Europe Location of Things Market Estimates and Forecasts, by Country (2021-2032) (USD Billion)
10.3.3 Europe Location of Things Market Estimates and Forecasts, By Application (2021-2032) (USD Billion)
10.3.4 Europe Location of Things Market Estimates and Forecasts, By Location Type (2021-2032) (USD Billion)
10.3.5 Europe Location of Things Market Estimates and Forecasts, By End User(2021-2032) (USD Billion)
10.3.6 Germany
10.3.1.6.1 Germany Location of Things Market Estimates and Forecasts, By Application (2021-2032) (USD Billion)
10.3.1.6.2 Germany Location of Things Market Estimates and Forecasts, By Location Type (2021-2032) (USD Billion)
10.3.1.6.3 Germany Location of Things Market Estimates and Forecasts, By End User (2021-2032) (USD Billion)
10.3.7 France
10.3.7.1 France Location of Things Market Estimates and Forecasts, By Application (2021-2032) (USD Billion)
10.3.7.2 France a Location of Things Market Estimates and Forecasts, By Location Type (2021-2032) (USD Billion)
10.3.7.3 France Location of Things Market Estimates and Forecasts, By End User (2021-2032) (USD Billion)
10.3.8 UK
10.3.8.1 UK Location of Things Market Estimates and Forecasts, By Application (2021-2032) (USD Billion)
10.3.8.2 UK Location of Things Market Estimates and Forecasts, By Location Type (2021-2032) (USD Billion)
10.3.8.3 UK Location of Things Market Estimates and Forecasts, By End User (2021-2032) (USD Billion)
10.3.9 Italy
10.3.9.1 Italy Location of Things Market Estimates and Forecasts, By Application (2021-2032) (USD Billion)
10.3.9.2 Italy Location of Things Market Estimates and Forecasts, By Location Type (2021-2032) (USD Billion)
10.3.9.3 Italy Location of Things Market Estimates and Forecasts, By End User (2021-2032) (USD Billion)
10.3.10 Spain
10.3.10.1 Spain Location of Things Market Estimates and Forecasts, By Application (2021-2032) (USD Billion)
10.3.10.2 Spain Location of Things Market Estimates and Forecasts, By Location Type (2021-2032) (USD Billion)
10.3.10.3 Spain Location of Things Market Estimates and Forecasts, By End User (2021-2032) (USD Billion)
10.3.12 Poland
10.3.12.1 Poland Location of Things Market Estimates and Forecasts, by Country (2021-2032) (USD Billion)
10.3.12.1 Poland Location of Things Market Estimates and Forecasts, By Application (2021-2032) (USD Billion)
10.3.12.3 Poland Location of Things Market Estimates and Forecasts, By Location Type (2021-2032) (USD Billion)
10.3.12.3 Poland Location of Things Market Estimates and Forecasts, By End User (2021-2032) (USD Billion)
10.3.13 Turkey
10.3.13.1 Turkey Location of Things Market Estimates and Forecasts, By Application (2021-2032) (USD Billion)
10.3.13.2 Turkey Location of Things Market Estimates and Forecasts, By Location Type (2021-2032) (USD Billion)
10.3.13.3 Turkey Location of Things Market Estimates and Forecasts, By End User (2021-2032) (USD Billion)
10.3.14 Rest of Europe
10.3.14.1 Rest of Europe Location of Things Market Estimates and Forecasts, By Application (2021-2032) (USD Billion)
10.3.14.2 Rest of Europe Location of Things Market Estimates and Forecasts, By Location Type (2021-2032) (USD Billion)
10.3.14.3 Rest of Europe Location of Things Market Estimates and Forecasts, By End User(2021-2032) (USD Billion)
10.4 Asia-Pacific
10.4.1 Trends Analysis
10.4.2 Asia-Pacific Location of Things Market Estimates and Forecasts, by Country (2021-2032) (USD Billion)
10.4.3 Asia-Pacific Location of Things Market Estimates and Forecasts, By Application (2021-2032) (USD Billion)
10.4.4 Asia-Pacific Location of Things Market Estimates and Forecasts, By Location Type (2021-2032) (USD Billion)
10.4.5 Asia-Pacific Location of Things Market Estimates and Forecasts, By End User (2021-2032) (USD Billion)
10.4.6 China
10.4.6.1 China Location of Things Market Estimates and Forecasts, By Application (2021-2032) (USD Billion)
10.4.6.2 China Location of Things Market Estimates and Forecasts, By Location Type (2021-2032) (USD Billion)
10.4.6.3 China Location of Things Market Estimates and Forecasts, By End User (2021-2032) (USD Billion)
10.4.7 India
10.4.7.1 India Location of Things Market Estimates and Forecasts, By Application (2021-2032) (USD Billion)
10.4.7.2 India Location of Things Market Estimates and Forecasts, By Location Type (2021-2032) (USD Billion)
10.4.7.3 India Location of Things Market Estimates and Forecasts, By End User (2021-2032) (USD Billion)
10.4.8 Japan
10.4.8.1 Japan Location of Things Market Estimates and Forecasts, By Application (2021-2032) (USD Billion)
10.4.8.2 Japan Location of Things Market Estimates and Forecasts, By Location Type (2021-2032) (USD Billion)
10.4.8.3 Japan Location of Things Market Estimates and Forecasts, By End User (2021-2032) (USD Billion)
10.4.9 South Korea
10.4.9.1 South Korea Location of Things Market Estimates and Forecasts, By Application (2021-2032) (USD Billion)
10.4.9.2 South Korea Location of Things Market Estimates and Forecasts, By Location Type (2021-2032) (USD Billion)
10.4.9.3 South Korea Location of Things Market Estimates and Forecasts, By End User (2021-2032) (USD Billion)
10.4.10 Singapore
10.4.10.1 Singapore Location of Things Market Estimates and Forecasts, By Application (2021-2032) (USD Billion)
10.4.10.2 Singapore Location of Things Market Estimates and Forecasts, By Location Type (2021-2032) (USD Billion)
10.4.10.3 Singapore Location of Things Market Estimates and Forecasts, By End User (2021-2032) (USD Billion)
10.4.11 Australia
10.4.11.1 Australia Location of Things Market Estimates and Forecasts, By Application (2021-2032) (USD Billion)
10.4.11.2 Australia Location of Things Market Estimates and Forecasts, By Location Type (2021-2032) (USD Billion)
10.4.11.3 Australia Location of Things Market Estimates and Forecasts, By End User (2021-2032) (USD Billion)
10.4.12 Rest of Asia-Pacific
10.4.12.1 Rest of Asia-Pacific Location of Things Market Estimates and Forecasts, By Application (2021-2032) (USD Billion)
10.4.12.2 Rest of Asia-Pacific Location of Things Market Estimates and Forecasts, By Location Type (2021-2032) (USD Billion)
10.4.12.3 Rest of Asia-Pacific Location of Things Market Estimates and Forecasts, By End User (2021-2032) (USD Billion)
10.5 Middle East and Africa
10.5.1 Trends Analysis
10.5.2 Middle East and Africa East Location of Things Market Estimates and Forecasts, by Country (2021-2032) (USD Billion)
10.5.3Middle East and Africa Location of Things Market Estimates and Forecasts, By Application (2021-2032) (USD Billion)
10.5.4 Middle East and Africa Location of Things Market Estimates and Forecasts, By Location Type (2021-2032) (USD Billion)
10.5.5 Middle East and Africa Location of Things Market Estimates and Forecasts, By End User (2021-2032) (USD Billion)
10.5.6 UAE
10.5.6.1 UAE Location of Things Market Estimates and Forecasts, By Application (2021-2032) (USD Billion)
10.5.6.2 UAE Location of Things Market Estimates and Forecasts, By Location Type (2021-2032) (USD Billion)
10.5.6.3 UAE Location of Things Market Estimates and Forecasts, By End User (2021-2032) (USD Billion)
10.5.7 Saudi Arabia
10.5.7.1 Saudi Arabia Location of Things Market Estimates and Forecasts, By Application (2021-2032) (USD Billion)
10.5.7.2 Saudi Arabia Location of Things Market Estimates and Forecasts, By Location Type (2021-2032) (USD Billion)
10.5.7.3 Saudi Arabia Location of Things Market Estimates and Forecasts, By End User (2021-2032) (USD Billion)
10.5.8 Qatar
10.5.8.1 Qatar Location of Things Market Estimates and Forecasts, By Application (2021-2032) (USD Billion)
10.5.8.2 Qatar Location of Things Market Estimates and Forecasts, By Location Type (2021-2032) (USD Billion)
10.5.8.3 Qatar Location of Things Market Estimates and Forecasts, By End User (2021-2032) (USD Billion)
10.5.9 South Africa
10.5.9 1 South Africa Location of Things Market Estimates and Forecasts, By Application (2021-2032) (USD Billion)
10.5.9 2 South Africa Location of Things Market Estimates and Forecasts By Location Type (2021-2032) (USD Billion)
10.5.9 3 South Africa Location of Things Market Estimates and Forecasts, By End User (2021-2032) (USD Billion)
10.5.10 Rest of Middle East & Africa
10.5.10.1 Rest of Middle East & Africa Location of Things Market Estimates and Forecasts, By Application (2021-2032) (USD Billion)
10.5.10.2 Rest of Middle East & Africa Location of Things Market Estimates and Forecasts, By Location Type (2021-2032) (USD Billion)
10.5.10.3 Rest of Middle East & Africa Location of Things Market Estimates and Forecasts, By End User (2021-2032) (USD Billion)
10.6 Latin America
10.6.1 Trends Analysis
10.6.2 Latin America Location of Things Market Estimates and Forecasts, by Country (2021-2032) (USD Billion)
10.6.3 Latin America Location of Things Market Estimates and Forecasts, By Application (2021-2032) (USD Billion)
10.6.4 Latin America Location of Things Market Estimates and Forecasts, By Location Type (2021-2032) (USD Billion)
10.6.5 Latin America Location of Things Market Estimates and Forecasts, By End User (2021-2032) (USD Billion)
10.6.6 Brazil
10.6.6.1 Brazil Location of Things Market Estimates and Forecasts, By Application (2021-2032) (USD Billion)
10.6.6.2 Brazil Location of Things Market Estimates and Forecasts, By Location Type (2021-2032) (USD Billion)
10.6.6.3 Brazil Location of Things Market Estimates and Forecasts, By End User (2021-2032) (USD Billion)
10.6.7 Argentina
10.6.7.1 Argentina Location of Things Market Estimates and Forecasts, By Application (2021-2032) (USD Billion)
10.6.7.2 Argentina Location of Things Market Estimates and Forecasts, By Location Type (2021-2032) (USD Billion)
10.6.7.3 Argentina Location of Things Market Estimates and Forecasts, By End User (2021-2032) (USD Billion)
10.6.8 Rest of Latin America
10.6.8.1 Rest of Latin America Location of Things Market Estimates and Forecasts, By Application (2021-2032) (USD Billion)
10.6.8.2 Rest of Latin America Location of Things Market Estimates and Forecasts, By Location Type (2021-2032) (USD Billion)
10.6.8.3 Rest of Latin America Location of Things Market Estimates and Forecasts, By End User (2021-2032) (USD Billion)
12. Company Profiles
12.1 ESRI
12.1.1 Company Overview
12.1.2 Financial
12.1.3 Products/ Services Offered
12.1.4 SWOT Analysis
12.2 Wireless Logic
12.2.1 Company Overview
12.2.2 Financial
12.2.3 Products/ Services Offered
12.2.4 SWOT Analysis
12.3 HERE
12.3.1 Company Overview
12.3.2 Financial
12.3.3 Products/ Services Offered
12.3.4 SWOT Analysis
12.4 TruePosition, Inc.
12.4.1 Company Overview
12.4.2 Financial
12.4.3 Products/ Services Offered
12.4.4 SWOT Analysis
12.5 Navizon, Inc
12.5.1 Company Overview
12.5.2 Financial
12.5.3 Products/ Services Offered
12.5.4 SWOT Analysis
12.6 Bosch Software Innovations GMBH
12.6.1 Company Overview
12.6.2 Financial
12.6.3 Products/ Services Offered
12.6.4 SWOT Analysis
12.7 Pitney Bowes
12.7.1 Company Overview
12.7.2 Financial
12.7.3 Products/ Services Offered
12.7.4 SWOT Analysis
12.8 TIBCO Software
12.8.1 Company Overview
12.8.2 Financial
12.8.3 Products/ Services Offered
12.8.4 SWOT Analysis
12.9 Trimble, Inc
12.9.1 Company Overview
12.9.2 Financial
12.9.3 Products/ Services Offered
12.9.4 SWOT Analysis
12.10 Qualcomm Technologies
12.10.1 Company Overview
12.10.2 Financial
12.10.3 Products/ Services Offered
12.10.4 SWOT Analysi
12. Use Cases and Best Practices
13. Conclusion
An accurate research report requires proper strategizing as well as implementation. There are multiple factors involved in the completion of good and accurate research report and selecting the best methodology to compete the research is the toughest part. Since the research reports we provide play a crucial role in any company’s decision-making process, therefore we at SNS Insider always believe that we should choose the best method which gives us results closer to reality. This allows us to reach at a stage wherein we can provide our clients best and accurate investment to output ratio.
Each report that we prepare takes a timeframe of 350-400 business hours for production. Starting from the selection of titles through a couple of in-depth brain storming session to the final QC process before uploading our titles on our website we dedicate around 350 working hours. The titles are selected based on their current market cap and the foreseen CAGR and growth.
The 5 steps process:
Step 1: Secondary Research:
Secondary Research or Desk Research is as the name suggests is a research process wherein, we collect data through the readily available information. In this process we use various paid and unpaid databases which our team has access to and gather data through the same. This includes examining of listed companies’ annual reports, Journals, SEC filling etc. Apart from this our team has access to various associations across the globe across different industries. Lastly, we have exchange relationships with various university as well as individual libraries.
Step 2: Primary Research
When we talk about primary research, it is a type of study in which the researchers collect relevant data samples directly, rather than relying on previously collected data. This type of research is focused on gaining content specific facts that can be sued to solve specific problems. Since the collected data is fresh and first hand therefore it makes the study more accurate and genuine.
We at SNS Insider have divided Primary Research into 2 parts.
Part 1 wherein we interview the KOLs of major players as well as the upcoming ones across various geographic regions. This allows us to have their view over the market scenario and acts as an important tool to come closer to the accurate market numbers. As many as 45 paid and unpaid primary interviews are taken from both the demand and supply side of the industry to make sure we land at an accurate judgement and analysis of the market.
This step involves the triangulation of data wherein our team analyses the interview transcripts, online survey responses and observation of on filed participants. The below mentioned chart should give a better understanding of the part 1 of the primary interview.
Part 2: In this part of primary research the data collected via secondary research and the part 1 of the primary research is validated with the interviews from individual consultants and subject matter experts.
Consultants are those set of people who have at least 12 years of experience and expertise within the industry whereas Subject Matter Experts are those with at least 15 years of experience behind their back within the same space. The data with the help of two main processes i.e., FGDs (Focused Group Discussions) and IDs (Individual Discussions). This gives us a 3rd party nonbiased primary view of the market scenario making it a more dependable one while collation of the data pointers.
Step 3: Data Bank Validation
Once all the information is collected via primary and secondary sources, we run that information for data validation. At our intelligence centre our research heads track a lot of information related to the market which includes the quarterly reports, the daily stock prices, and other relevant information. Our data bank server gets updated every fortnight and that is how the information which we collected using our primary and secondary information is revalidated in real time.
Step 4: QA/QC Process
After all the data collection and validation our team does a final level of quality check and quality assurance to get rid of any unwanted or undesired mistakes. This might include but not limited to getting rid of the any typos, duplication of numbers or missing of any important information. The people involved in this process include technical content writers, research heads and graphics people. Once this process is completed the title gets uploader on our platform for our clients to read it.
Step 5: Final QC/QA Process:
This is the last process and comes when the client has ordered the study. In this process a final QA/QC is done before the study is emailed to the client. Since we believe in giving our clients a good experience of our research studies, therefore, to make sure that we do not lack at our end in any way humanly possible we do a final round of quality check and then dispatch the study to the client.
Key Segments:
By Location Type
Indoor Location
Outdoor Location
By Application
Mapping And Navigation
Asset Management
Location Intelligence
Media And Marketing Engagement
By Vertical
Government, Defence, And Public Utilities
Transportation And Logistics
Retail And Consumer Goods
Manufacturing And Industrial
Healthcare & Life Sciences
BFSI
Others
Request for Segment Customization as per your Business Requirement: Segment Customization Request
Regional Coverage:
North America
US
Canada
Mexico
Europe
Germany
France
UK
Italy
Spain
Poland
Turkey
Rest of Europe
Asia Pacific
China
India
Japan
South Korea
Singapore
Australia
Rest of Asia Pacific
Middle East & Africa
UAE
Saudi Arabia
Qatar
South Africa
Rest of Middle East & Africa
Latin America
Brazil
Argentina
Rest of Latin America
Request for Country Level Research Report: Country Level Customization Request
Available Customization
With the given market data, SNS Insider offers customization as per the company’s specific needs. The following customization options are available for the report:
Detailed Volume Analysis
Criss-Cross segment analysis (e.g. Product X Application)
Competitive Product Benchmarking
Geographic Analysis
Additional countries in any of the regions
Customized Data Representation
Detailed analysis and profiling of additional market players