Machine-to-Machine (M2M) Connections Market Analysis & Overview:
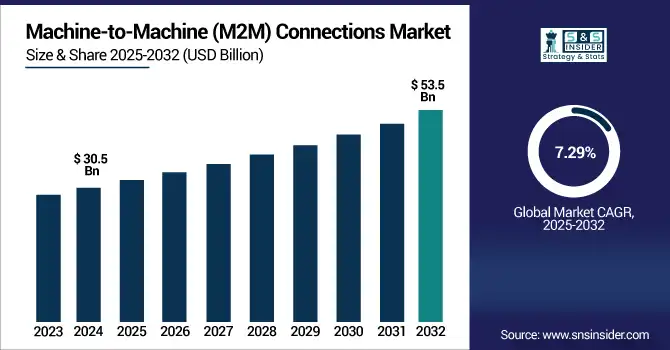
The machine-to-machine (M2M) connections market size was valued at USD 30.5 billion in 2024 and is projected to reach USD 53.5 billion by 2032, expanding at a CAGR of 7.29% during 2025–2032.
Machine-to-Machine (M2M) Connections Market growth is driven by the rapid growth of IoT ecosystems, increasing adoption of smart devices, and rising real-time data exchange between industries. Machine-to-machine (M2M) technology allows devices to communicate with one another without human intervention in areas including manufacturing, healthcare, automotive, and utilities, driving the automation of processes. The development of 5G networks, low-power wide-area networks (LPWAN), and eSIM technology also stimulates M2M deployments by improving connectivity, reducing latency, and allowing remote configuration and management of devices. Additionally, smart city projects and Industry 4.0 initiatives by governments are supporting adoption. The global M2M connections market is expected to register a large number of connection volumes in billions between 2025 and 2032, growing at a sizeable CAGR. The next phase of market growth will come from new applications in autonomous vehicles, smart grids, and telemedicine.
To Get more information on Machine-to-Machine (M2M) Connections Market - Request Free Sample Report
In the U.S., the Machine-to-Machine Connections Market trend is driven by widespread 5G growth, Industrial IoT and the federal smart infrastructure programs.. The market is expected to grow from USD 7.9 billion in 2024 to USD 25.3 billion by 2032, at a CAGR of 15.8%.
Machine-to-Machine (M2M) Connections Market Dynamics:
Drivers:
-
Surge in IoT Device Deployment Leads to Increased Demand for Seamless M2M Communication
The increasing number of IoT devices is one of the important drivers for the M2M connections market. IoT solutions are automating processes across industries that include automotive, healthcare, logistics, and manufacturing, with use cases ranging from predictive maintenance, remote monitoring, and asset tracking. This is where M2M communication plays a vital role in such IoT ecosystems by facilitating real-time data exchange between machines. Moreover, the growth of the connected home, wearables, and connected automobiles is all adding to the M2M ecosystem. The emergence of wireless technologies such as 5G, NB-IoT, and LTE-M makes M2M more efficient, reliable, and scalable, enabling faster implementation in both developed and emerging markets.
Restraints:
-
Rising Cybersecurity Threats Result in Hesitation Toward Large-Scale M2M Adoption
While M2M has its benefits, the large-scale roll-out of this kind of connection raises serious questions about data privacy and cybersecurity issues. With billions of devices autonomously exchanging data, the risk of security breaches, data interception, or data manipulation rises dramatically. With so many endpoints connected to the network, most of which will not be protected well, adding to the risk of cyber threats, ransomware, and distributed denial of service (DDoS) attacks. Ensuring end-to-end encryption, device authentication, and secure firmware updates is especially important, but difficult in legacy systems. And such dangers could dissuade companies and governments from implementing M2M networks without strong regulatory and cybersecurity frameworks. When implementing M2M on a large scale, the privacy and security of sensitive data remain a major challenge.
Kaspersky reports a thriving underground IoT threat economy, with around 700 DDoS service ads in H1 2023, implying widespread exposure of M2M devices
Opportunities:
-
Government-Backed Smart City Projects Drive Expansion of M2M Infrastructure
M2M connection providers can see a significant opportunity in smart city initiatives, which are surging across the globe. These initiatives rely on machine communication to fuel connected traffic systems, smart lighting, waste management, utility monitoring, and surveillance networks. M2M connections assist local governments with operational efficiency, environmental impact, and citizen service delivery for M2M by enabling real-time data collection, and in turn, automated identify-reaction mechanisms. As governments are now paying more attention to digital infrastructure and sustainable urban development, we are likely to see a huge increase in M2M solutions. Moreover, AI, edge computing, and M2M are all in the same basket, and this combination in smart cities is creating new opportunities for more intelligent and autonomous cities, which in turn increases demand for scalable M2M wired and wireless networks.
More than 70% of municipalities now combine AI and IoT for predictive analytics—enabling proactive systems such as traffic management and environmental monitoring
Challenges:
-
Lack of Standardization Causes Integration Issues Across M2M Networks
The biggest challenge in the market of M2M connections market is the absence of standardization between devices, networks, and platforms. Different vendors are using their proprietary technologies, and it is difficult to maintain interoperability between M2M systems. The fragmentation leads to non-trivial integration and may add additional cost and complexity to deployment for the enterprises. Scaling can be a challenging problem, especially when a large-scale IoT application needs to deploy thousands of these heterogeneous devices, and there exists no universal communication standard. The challenge is evident between cross-border and multi-vendor architectures such as those in International logistics or Smart city networks. Solving this problem will require coordinated industry actions and regulatory support through open, interoperable M2M interface standards.
Machine-to-Machine (M2M) Connections Market Segmentation Analysis:
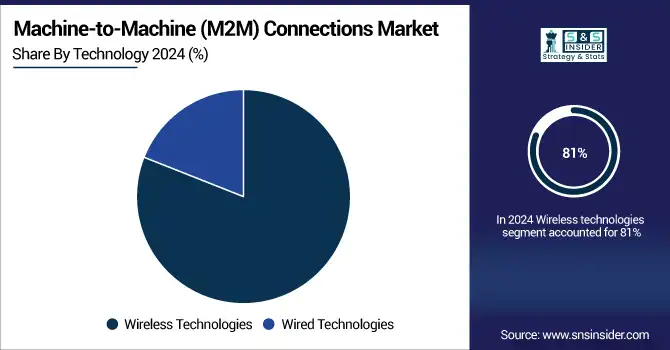
By Technology:
Wireless technologies dominated the M2M market in 2024 and accounted for 81% of the machine-to-machine connections market share, as a result of high 5G deployment, increasing mobile network penetration, and the requirement of volume scalability for IoT and remote asset monitoring. Wireless M2M opens the doors to multiple possibilities from smart cities & industrial automation to offer low-latency & budget-friendly communication. Wireless connections will account for over half of all M2M deployments by 2032, especially LPWAN and NB-IoT and LTE-M networks.
In May 2025, UK-based Wireless Logic (M2M connectivity provider for 25,000+ customers via 53 mobile operators) sold a minority stake to General Atlantic, valuing the company at £3.5 billion, driven by over 20% year-on-year revenue and profit growth, underscoring robust wireless‑M2M market expansion
Wireless M2M is expected to register the fastest CAGR from 2025 to 2032, driven by expanding IoT ecosystems and smart infrastructure projects. Wireless networks are low-cost and scalable, enabling deployments for multi-device, large-scale applications across agriculture, transportation, and utilities. With the edge computing concept in particular and AI integration in general, future growth will also be powered by advances in 5G, enabling ultra-reliable, real-time M2M communication without any geographical boundaries.
By Communication Type:
Cellular M2M dominated the market in 2024 and accounted for a significant revenue share, owing to extensive coverage, reliability, and robust support from telecom operators. GSM, LTE, and now 5G are used in all of the most mission-critical applications out there today, including in fleet tracking, healthcare, and smart utilities. Cellular M2M will continue to be the backbone for all mission-critical deployments in 2032, and this will be facilitated by the standardization of global SIMs and seamless roaming capabilities.
LPWAN is expected to register the fastest CAGR from 2025 to 2032, due to the low-power and long-range attributes of LPWAN suitable for smart agriculture, metering, and remote monitoring. LPWAN offers great scalability with affordability of the connectivity, deep building penetration, and a longer battery life for the devices. The accelerated adoption of NB-IoT and LoRaWAN across developing and rural markets is driven by the widespread NB-IoT and LoRaWAN deployments by governments and utility companies
By Application:
Smart Metering dominated the market in 2024 and represented a significant revenue share, due to utility-scale upgrades mostly in electric, gas, and water management. From municipalities to regulated & unregulated energy firms alike, virtually every country has deployed millions of M2M-enabled meters to facilitate real-time tracking of consumption & grid optimization. Smart Metering will continue to lead the markets until 2032, fueled by mandates for energy efficiency, objectives for cost savings, and a large-scale rollout of two-way communication systems in developed and emerging economies.
Smart cities are projected to register the fastest CAGR from 2025 to 2032, as urban governments take on M2M for intelligent lighting, traffic control, waste management, and surveillance. Urban population, sustainability targets, and high investments in IoT-based infrastructure are the key drivers boosting the growth. M2M networks will be pivotal to automate real-time services and predictive service delivery, which will be the core of future smart city expansion.
By End-Use:
Utilities dominated the M2M market in 2024 and accounted for a significant revenue share, as smart grids, automated meter reading, and remote diagnostics were rapidly adopted. M2M will also see investment from utility providers looking for real-time energy distribution, leakage, and outage control. Utilities will continue leading by 2032, driven by decarbonization, renewable integration, and regulatory mandates that promote digital transformation across power, water, and gas networks.
Automotive & transportation is expected to register the fastest CAGR during the forecast period, owing to the rapid transformation of connected cars, V2X (vehicle-to-everything) communication, and smart fleet management. With M2M, people can improve navigation in real-time, and predictive maintenance can be done based on the analytics they do for the drivers' driving behavior. Autonomous vehicle tests, logistics optimization, and in-vehicle emergency communications system mandates in several
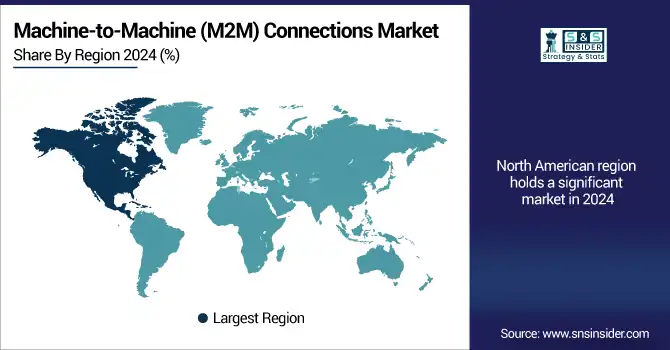
Machine-to-Machine (M2M) Connections Market Regional Outlook:
North America dominated the M2M market due to the well-established 5G infrastructure, early adoption of IoT in various industries, and the growing smart utility and smart transportation initiatives supported by government bodies. Connected car deployments, industrial automation, and smart grid modernization are prominent in the U.S. The region remains in the first place until 2032 as the enterprises are investing in real-time M2M solutions mostly in healthcare, logistics, and security systems.
Asia-Pacific is expected to register the fastest CAGR from 2025 to 2032. Due to rapid urbanization, increasing smart city projects, and high mobile penetration. China, India, Japan, and South Korea are investing heavily in LPWAN, smart manufacturing, and connected infrastructure. Government actions and industrial digitalization will drive M2M demand in a diversity of sectors heart of transportation, energy, agriculture and public services.
Europe's M2M market is driven by High regulatory push for smart grids, eCall mandates for vehicles, and factory automation investments. The widespread rollout of 5G will likely fast-track M2M adoption by 2032 and innovative applications including smart cities and increased demand for cross-border, seamlessly interoperable M2M communication networks.
Germany's position as a global manufacturing leader, trailblazer for Industry 4.0, and an established IoT ecosystem have contributed to its leadership of Europe's M2M market. Smart factory, automotive telematics-driven, and public private partnership driven connected infrastructure deployments will propel future growth and lay the foundation to make Germany a compelling M2M hub for scalable solutions.
Get Customized Report as per Your Business Requirement - Enquiry Now
Key Players:
AT&T Inc., Verizon Communications Inc., Vodafone Group Plc, Telefónica S.A., Deutsche Telekom AG, Orange S.A., China Mobile Ltd., China Telecom Corporation Limited, Telit Cinterion, Sierra Wireless, Thales Group, u-blox Holding AG, Huawei Technologies Co., Ltd., Quectel Wireless Solutions Co., Ltd., Sequans Communications S.A., Nordic Semiconductor ASA, Telenor Group, NTT Communications Corporation, Cisco Systems, Inc., Ericsson AB and others.
Recent Developments:
In January 2025, AT&T Inc. launched Connected Spaces, a plug-and-play M2M IoT sensor kit designed for SMBs to monitor environmental metrics such as temperature, motion, and leaks in real time.
In March 2025, Verizon Communications Inc. added Skylo and Singtel to its ThingSpace IoT orchestration platform, expanding satellite-enabled global M2M connectivity across over 200 regions.
In April 2025, Vodafone Group Plc surpassed 200 million IoT and M2M connections globally, driven by new integrations with smart health monitoring devices across its international network.
In April 2025, Telefónica S.A. partnered with Dexory to deploy an AI-powered M2M warehouse automation solution, enhancing real-time inventory tracking and operational visibility.
|
Report Attributes |
Details |
|---|---|
|
Market Size in 2024 |
USD 30.5 Billion |
|
Market Size by 2032 |
USD 53.5 Billion |
|
CAGR |
CAGR of 7.29% From 2025 to 2032 |
|
Base Year |
2024 |
|
Forecast Period |
2025-2032 |
|
Historical Data |
2021-2023 |
|
Report Scope & Coverage |
Market Size, Segments Analysis, Competitive Landscape, Regional Analysis, DROC & SWOT Analysis, Forecast Outlook |
|
Key Segments |
• By Technology (Wired Technologies, Wireless Technologies) |
|
Regional Analysis/Coverage |
North America (US, Canada), Europe (Germany, France, UK, Italy, Spain, Poland, Rest of Europe), Asia Pacific (China, India, Japan, South Korea, ASEAN Countries, Australia, Rest of Asia Pacific), Middle East & Africa (UAE, Saudi Arabia, Qatar,Egypt, South Africa, Rest of Middle East & Africa), Latin America (Brazil, Argentina, Mexico, Colombia, Rest of Latin America) |
|
Company Profiles |
AT&T Inc., Verizon Communications Inc., Vodafone Group Plc, Telefónica S.A., Deutsche Telekom AG, Orange S.A., China Mobile Ltd., China Telecom Corporation Limited, Telit Cinterion, Sierra Wireless, Thales Group, u-blox Holding AG, Huawei Technologies Co., Ltd., Quectel Wireless Solutions Co., Ltd., Sequans Communications S.A., Nordic Semiconductor ASA, Telenor Group, NTT Communications Corporation, Cisco Systems, Inc., Ericsson AB and others in the report |
Get in Touch
