Get More Information on Metaverse Market - Request Sample Report
The Metaverse Market size was valued at USD 83.6 billion in 2023 and is expected to reach USD 2882.9 billion by 2032 and grow at a CAGR of 48.2% over the forecast period 2024-2032.
Spatial technologies are innovative as they integrate human interaction with digital objects that are parts of the real world. Companies are increasingly adopting the technology to create immersive products and services for users, promoting innovation for the customers. For instance, in January 2024, Unity Technologies unveiled spatial collaboration with Apple Inc. aimed at advancing spatial experiences, particularly in augmented reality and spatial computing. However, the company seeks to take the application of spatial technology a notch higher by devising services that can allow developers to offer immersive experiences across the applications with digital content that seamlessly matches the physical landscape. In 2023, global investments in metaverse-related projects, including VR/AR and blockchain technologies, exceeded $120 billion. As part of that, investment into metaverse-focused platforms and applications was significant, in some cases exceeding $ 1 billion. As such, by the end of 2023, the total number of patents relating to the metaverse technology reportedly amounted to more than 5,000. As a result, the technologies AR, VR, MR and 3D visualization tools are pushing the market growth higher and further, offering new opportunities for more immersive experience to the users.
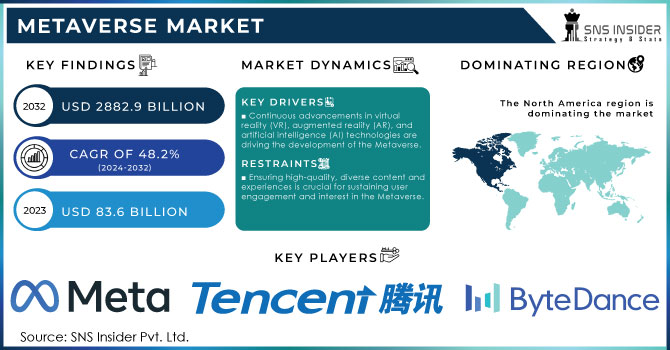
The industries are increasingly including AR, VR, MR, and 3D visualization applications for improved visualization, simulation, and prototyping. Growing investments and partnerships across the industries as well as customer needs shaping the demand are increasingly stimulating the market expansion. Entertainment, gaming, and education are further spearheading the demand for more immersive experiences, encouraging firms to invest in the technologies via the new application development. Cryptocurrencies are shaping the transactions, becoming the base of digital world economy by decentralizing the digital economy that facilitates efficient transactions across the metaverse. NFTs are revolutionizing ownership by certifying the uniqueness of digital assets, adding new value dimensions and driving the creation of diverse digital collectibles.
Market dynamics
Drivers
Continuous advancements in virtual reality (VR), augmented reality (AR), and artificial intelligence (AI) technologies are driving the development of the Metaverse.
Growing use of Metaverse in Healthcare industry drives the market.
Consumers are increasingly seeking immersive digital experiences, driving demand for Metaverse platforms and content.
The rise of digital economies and online marketplaces presents opportunities for commerce and social interaction within the Metaverse.
Various technological developments, specifically those in virtual reality and artificial intelligence, play a crucial role in shaping the Metaverse’s development. In the year 2023, global shipments, sales, and distribution of VR and AR gadgets were more than 12 million units, indicating the need and use for standard hardware that supports Metaverse. In addition, several other agencies and governments are taking the steps of sponsoring, making these more and more vital. In South Korea spent more than $186 to ensure that the national metaverse technology succeeds as well as establish itself as the metaverse hub globally by 2023. AI is centered in the Metaverse, and AI mainly deals with changing the interaction between humans and their digital lives by providing more realistic and responsive virtual environments. For instance, AI-driven avatars and virtual assistants are becoming more prevalent, offering personalized experiences that adapt to individual user preferences. These technological advancements are not only enhancing user experiences but are also driving the evolution of the Metaverse as a dynamic, interconnected digital space where people can work, play, and socialize in ways previously unimaginable.
The increasing use of metaverse in healthcare drives the market. Doctors can now virtually connect with patients anywhere, driving virtual wellness and consultations. Technologies such as AR, VR, and AI will transform medicine. Imagine doctors practicing surgery on digital twin dummies, or patients receiving personalized therapy in virtual environments. This technology, combined with secure data storage via blockchain, holds immense potential for improved engagement, education, and overall healthcare.
Restraints
Overcoming technical hurdles such as latency, bandwidth limitations, and device compatibility remains a significant barrier to widespread adoption.
Ensuring high-quality, diverse content and experiences is crucial for sustaining user engagement and interest in the Metaverse.
Evolving regulatory frameworks and legal considerations regarding virtual property rights, taxation, and governance pose challenges to Metaverse development and operation.
Opportunities
Metaverse presents vast opportunities for content creators, developers, and businesses to monetize digital assets, services, and experiences.
Platforms within the Metaverse offer opportunities for social interaction, community building, and new forms of entertainment and communication.
E-commerce and digital transactions within the Metaverse enable new revenue streams for businesses and enhance the overall shopping experience.
Segment analysis
By Product
The hardware segment dominated the market due to firms focusing on improving user experiences and immersion and is expected to maintain the largest revenue share. Companies are innovating with advanced hardware such as VR/AR headsets and haptic devices to enhance virtual realism. Developing interfaces for accessing 3D content across various devices, including next-gen TVs and smart glasses such as HoloLens, will drive revenue growth. For example, Facebook Reality Labs plans to invest over USD 10.02 billion in AR and VR hardware development. The software segment, witnessing significant growth, involves creating integrated virtual simulations for diverse activities and businesses, with popular platforms such as Minecraft and Roblox driving revenue growth alongside increasing smartphone penetration and app developer rates.
By Application
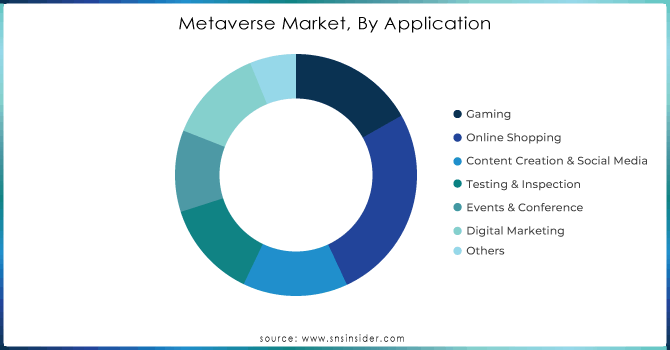
In 2023, the Gaming segment dominated the Metaverse Market held a revenue share of more than 26%, driven by ongoing innovations and efforts to enhance immersion and realism in games. Businesses increasingly leverage gaming to bolster their corporate image, further driving the revenue growth. Market applications include gaming, online shopping, content creation & social media, events & conferences, digital marketing, testing, and others. The content creation & social media segment is projected to grow notably, fueled by the reliance on internet and social platforms, spawning an increase in content creators. Virtual reality training, particularly for aircraft inspection and cabin crew training, provides immersive, safe learning environments, enhancing skills without physical presence.
Need any customization research on Metaverse Market - Enquiry Now
By technology
The virtual reality and augmented reality segment dominated the market with held more than 35% revenue in 2023 driven by their ability to create experience interaction with virtual environments like never before. Specifically, VR and AR provide users with immersive experiences, which capture many senses and are oriented toward engagement. These solutions are relevant for a wide range of industries, including gaming, entertainment, education, and healthcare as a consequence, the demand for VR and AR has been on the rise. The growing interest in VR and ARs from virtual meetings and training simulations to product visualization, cater to diverse needs, further boosting their popularity.
MR is expected to experience the highest CAGR from 2024 to 2032. MR uniquely combines aspects of both VR and AR, creating a seamless blend of virtual and real-world environments. MR solutions are immersive and interactive, which makes the users of these technologies feel like they are present in the experience. At the same time, they make it possible to interact with virtual objects in the physical world, which creates versatile affordances across industries. Specifically, MRs can be used for gaming, learning, business organization, and healthcare. The category is practiced on headsets and glasses, the use of which is expected to increase with the continued development of software.
Regional analysis
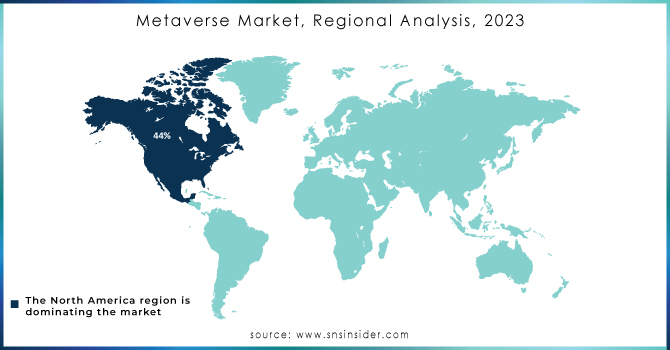
The North America region dominated the market in 2023, and accounted for more than 44% of the share. This fact could be attributed to the characteristics of the region’s population as a result of their being the early adopters of the latest technological advancements. One of the trends is the investment in VR headsets, gaming consoles with metaverse concepts, and high-speed internet access to enable more pleasant VR experiences. These factors create a strong market foundation for metaverse products and services. Additionally, the existing broad gaming culture in the region contributes substantially to Roblox Corporation’s and Epic Games’ development of Roblox and Fortnite, the platforms that incorporate key metaverse elements. The metaverse market in the U.S. is set to grow between 2024 and 2032 in a relatively significant growth rate. This fact would happen as a result of the prices of VR and AR technologies becoming more affordable and the growing consumers’ and businesses’ interests in the digitalized experiences. The CAGR of Asia Pacific is expected to be the highest between 2024 and 2032. This fact is determined by invested in smart cities, digital economy, and 5G technology in the region in such countries as Japan, South Korea, and China playing a key role.
The key market players include Meta Platforms, Inc., Tencent Holdings Ltd,.ByteDance Ltd., NetEase, Inc., Nvidia Corporation, Epic Games, Inc., Roblox Corporation, Unity Technologies, Inc., Lilith Games Nextech AR Solutions Corp , The Sandbox Active Theory, Decentraland , Microsoft Corporation & Other Players
Report Attributes | Details |
Market Size in 2023 | USD 83.6 Bn |
Market Size by 2032 | USD 2882.9 Bn |
CAGR | CAGR of 48.2% From 2024 to 2032 |
Base Year | 2023 |
Forecast Period | 2024-2032 |
Historical Data | 2020-2022 |
Report Scope & Coverage | Market Size, Segments Analysis, Competitive Landscape, Regional Analysis, DROC & SWOT Analysis, Forecast Outlook |
Key Segments | • By Product (Infrastructure, Hardware, Software, Services) • By Technology (Blockchain, Virtual Reality (VR) & Augmented Reality (AR), Mixed Reality (MR), Others) • By Platform (Desktop, Mobile, Headsets) • By Application (Gaming, Online Shopping, Content Creation & social media, Events & Conference, Digital Marketing (Advertising), Testing and Inspection, Others) • By End-use (BFSI, Retail, Media & Entertainment, Education, Aerospace and Defense, Automotive, Others) |
Regional Analysis/Coverage | North America (US, Canada, Mexico), Europe (Eastern Europe [Poland, Romania, Hungary, Turkey, Rest of Eastern Europe] Western Europe] Germany, France, UK, Italy, Spain, Netherlands, Switzerland, Austria, Rest of Western Europe]), Asia Pacific (China, India, Japan, South Korea, Vietnam, Singapore, Australia, Rest of Asia Pacific), Middle East & Africa (Middle East [UAE, Egypt, Saudi Arabia, Qatar, Rest of Middle East], Africa [Nigeria, South Africa, Rest of Africa], Latin America (Brazil, Argentina, Colombia, Rest of Latin America) |
Company Profiles | Meta Platforms, Inc., Tencent Holdings Ltd, ByteDance Ltd., NetEase, Inc., Nvidia Corporation, Epic Games, Inc., Roblox Corporation, Unity Technologies, Inc., Lilith Games Nextech AR Solutions Corp, The Sandbox Active Theory, Decentraland, Microsoft Corporation |
Key Drivers | • People use websites, chat applications, and social networking platforms like Facebook to connect with one another online. • Investors may benefit by selling crypto because it is available on exchanges all around the world |
Restraints | • A rise in cyber-attacks and a high-risk environment might stymie industry expansion. |
Ans:-The Metaverse Market was valued at USD 83.6 billion in 2023.
Ans:- Increasing focus on integrating digital and physical worlds using the Internet, growing momentum and popularity of Mixed Reality (MR), Augmented Reality (AR), and Virtual Reality (VR).
Ans:- The key market players include Meta Platforms, Inc., Tencent Holdings Ltd,.ByteDance Ltd., NetEase, Inc., Nvidia Corporation, Epic Games, Inc., Roblox Corporation,Unity Technologies, Inc., Lilith Games Nextech AR Solutions Corp, The Sandbox Active Theory, Decentraland,Microsoft Corporation, and others.
Ans:- North America accounted for the largest market share in the metaverse market.
Ans:- The primary growth tactics of global metaverse market players include agreements, business expansion, technology advancement, mergers, and acquisitions.
Table of Contents
1. Introduction
1.1 Market Definition
1.2 Scope (Inclusion and Exclusions)
1.3 Research Assumptions
2. Executive Summary
2.1 Market Overview
2.2 Regional Synopsis
2.3 Competitive Summary
3. Research Methodology
3.1 Top-Down Approach
3.2 Bottom-up Approach
3.3. Data Validation
3.4 Primary Interviews
4. Market Dynamics Impact Analysis
4.1 Market Driving Factors Analysis
4.1.1 Drivers
4.1.2 Restraints
4.1.3 Opportunities
4.1.4 Challenges
4.2 PESTLE Analysis
4.3 Porter’s Five Forces Model
5. Statistical Insights and Trends Reporting
5.1 Adoption Rates of Emerging Technologies
5.2 Network Infrastructure Expansion, by Region
5.3 Cybersecurity Incidents, by Region (2020-2023)
5.4 Cloud Services Usage, by Region
6. Competitive Landscape
6.1 List of Major Companies, By Region
6.2 Market Share Analysis, By Region
6.3 Product Benchmarking
6.3.1 Product specifications and features
6.3.2 Pricing
6.4 Strategic Initiatives
6.4.1 Marketing and promotional activities
6.4.2 Distribution and supply chain strategies
6.4.3 Expansion plans and new product launches
6.4.4 Strategic partnerships and collaborations
6.5 Technological Advancements
6.6 Market Positioning and Branding
7. Metaverse Market Segmentation, By Product
7.1 Chapter Overview
7.2 Infrastructure
7.2.1 Infrastructure Market Trends Analysis (2020-2032)
7.2.2 Infrastructure Market Size Estimates and Forecasts to 2032 (USD Billion)
7.3 Hardware
7.3.1 Hardware Market Trends Analysis (2020-2032)
7.3.2 Hardware Market Size Estimates and Forecasts to 2032 (USD Billion)
7.3 Software
7.3.1 Software Market Trends Analysis (2020-2032)
7.3.2 Software Market Size Estimates and Forecasts to 2032 (USD Billion)
7.3 Services
7.3.1 Services Market Trends Analysis (2020-2032)
7.3.2 Services Market Size Estimates and Forecasts to 2032 (USD Billion)
8. Metaverse Market Segmentation, By Platform
8.1 Chapter Overview
8.2 Desktop
8.2.1 Desktop Market Trends Analysis (2020-2032)
8.2.2 Desktop Market Size Estimates And Forecasts To 2032 (USD Billion)
8.3 Mobile
8.3.1 Mobile Market Trends Analysis (2020-2032)
8.3.2 Mobile Market Size Estimates And Forecasts To 2032 (USD Billion)
8.3 Headsets
8.3.1 Headsets Market Trends Analysis (2020-2032)
8.3.2 Headsets Market Size Estimates And Forecasts To 2032 (USD Billion)
9. Metaverse Market Segmentation, By Technology
9.1 Chapter Overview
9.2 Virtual Reality (VR) & Augmented Reality (AR)
9.2.1 Virtual Reality (VR) & Augmented Reality (AR) Market Trends Analysis (2020-2032)
9.2.2 Virtual Reality (VR) & Augmented Reality (AR) Market Size Estimates And Forecasts To 2032 (USD Billion)
9.3 Blockchain
9.3.1 Blockchain Market Trends Analysis (2020-2032)
9.3.2 Blockchain Market Size Estimates And Forecasts To 2032 (USD Billion)
9.4 Mixed Reality (MR)
9.4.1 Mixed Reality (MR) Market Trends Analysis (2020-2032)
9.4.2 Mixed Reality (MR) Market Size Estimates And Forecasts To 2032 (USD Billion)
9.5 Others
9.5.1 Others Market Trends Analysis (2020-2032)
9.5.2 Others Market Size Estimates And Forecasts To 2032 (USD Billion)
10. Metaverse Market Segmentation, By Application
10.1 Chapter Overview
10.2 Gaming
10.2.1 Gaming Market Trends Analysis (2020-2032)
10.2.2 Gaming Market Size Estimates And Forecasts To 2032 (USD Billion)
10.3 Online Shopping
10.3.1 Online Shopping Market Trends Analysis (2020-2032)
10.3.2 Online Shopping Market Size Estimates And Forecasts To 2032 (USD Billion)
10.4 Content Creation & Social Media
10.4.1 Content Creation & Social Media Market Trends Analysis (2020-2032)
10.4.2 Content Creation & Social Media Market Size Estimates And Forecasts To 2032 (USD Billion)
10.5 Testing & Inspection
10.5.1 Testing & Inspection Market Trends Analysis (2020-2032)
10.5.2 Testing & Inspection Market Size Estimates And Forecasts To 2032 (USD Billion)
10.6 Events & Conference
10.6.1 Events & Conference Market Trends Analysis (2020-2032)
10.6.2 Events & Conference Market Size Estimates And Forecasts To 2032 (USD Billion)
10.7 Digital Marketing (Advertising)
10.7.1 Digital Marketing (Advertising) Market Trends Analysis (2020-2032)
10.7.2 Digital Marketing (Advertising) Market Size Estimates And Forecasts To 2032 (USD Billion)
10.8 Others
10.8.1 Others Market Trends Analysis (2020-2032)
10.8.2 Others Market Size Estimates And Forecasts To 2032 (USD Billion)
11. Metaverse Market Segmentation, By End-user
11.1 Chapter Overview
11.2 BFSI
11.2.1 BFSI Market Trends Analysis (2020-2032)
11.2.2 BFSI Market Size Estimates And Forecasts To 2032 (USD Billion)
11.3 Healthcare
11.3.1 Healthcare Market Trends Analysis (2020-2032)
11.3.2 Healthcare Market Size Estimates And Forecasts To 2032 (USD Billion)
11.4 Aerospace & Defense
11.4.1 Aerospace & Defense Market Trends Analysis (2020-2032)
11.4.2 Aerospace & Defense Market Size Estimates And Forecasts To 2032 (USD Billion)
11.5 Media & Entertainment
11.5.1 Media & Entertainment Market Trends Analysis (2020-2032)
11.5.2 Media & Entertainment Market Size Estimates And Forecasts To 2032 (USD Billion)
11.6 Tourism & Hospitality
11.6.1 Tourism & Hospitality Market Trends Analysis (2020-2032)
11.6.2 Tourism & Hospitality Market Size Estimates And Forecasts To 2032 (USD Billion)
11.6 Retail
11.6.1 Retail Market Trends Analysis (2020-2032)
11.6.2 Retail Market Size Estimates And Forecasts To 2032 (USD Billion)
11.6 Education
11.6.1 Education Market Trends Analysis (2020-2032)
11.6.2 Education Market Size Estimates And Forecasts To 2032 (USD Billion)
11.6 Automotive
11.6.1 Automotive Market Trends Analysis (2020-2032)
11.6.2 Automotive Market Size Estimates And Forecasts To 2032 (USD Billion)
11.7 Others
11.7.1 Others Market Trends Analysis (2020-2032)
11.7.2 Others Market Size Estimates And Forecasts To 2032 (USD Billion)
12. Regional Analysis
12.1 Chapter Overview
12.2 North America
12.2.1 Trends Analysis
12.2.2 North America Metaverse Market Estimates And Forecasts, By Country (2020-2032) (USD Billion)
12.2.3 North America Metaverse Market Estimates And Forecasts, By Product (2020-2032) (USD Billion)
12.2.4 North America Metaverse Market Estimates And Forecasts, By Platform (2020-2032) (USD Billion)
12.2.5 North America Metaverse Market Estimates And Forecasts, By Technology (2020-2032) (USD Billion)
12.2.6 North America Metaverse Market Estimates And Forecasts, By Application (2020-2032) (USD Billion)
12.2.7 North America Metaverse Market Estimates And Forecasts, By End-user (2020-2032) (USD Billion)
12.2.8 USA
12.2.8.1 USA Metaverse Market Estimates And Forecasts, By Product (2020-2032) (USD Billion)
12.2.8.2 USA Metaverse Market Estimates And Forecasts, By Platform (2020-2032) (USD Billion)
12.2.8.3 USA Metaverse Market Estimates And Forecasts, By Technology (2020-2032) (USD Billion)
12.2.8.4 USA Metaverse Market Estimates And Forecasts, By Application (2020-2032) (USD Billion)
12.2.8.5 USA Metaverse Market Estimates And Forecasts, By End-user (2020-2032) (USD Billion)
12.2.9 Canada
12.2.9.1 Canada Metaverse Market Estimates And Forecasts, By Product (2020-2032) (USD Billion)
12.2.9.2 Canada Metaverse Market Estimates And Forecasts, By Platform (2020-2032) (USD Billion)
12.2.9.3 Canada Metaverse Market Estimates And Forecasts, By Technology (2020-2032) (USD Billion)
12.2.9.4 Canada Metaverse Market Estimates And Forecasts, By Application (2020-2032) (USD Billion)
12.2.9.5 Canada Metaverse Market Estimates And Forecasts, By End-user (2020-2032) (USD Billion)
12.2.10 Mexico
12.2.10.1 Mexico Metaverse Market Estimates And Forecasts, By Product (2020-2032) (USD Billion)
12.2.10.2 Mexico Metaverse Market Estimates And Forecasts, By Platform (2020-2032) (USD Billion)
12.2.10.3 Mexico Metaverse Market Estimates And Forecasts, By Technology (2020-2032) (USD Billion)
12.2.10.4 Mexico Metaverse Market Estimates And Forecasts, By Application (2020-2032) (USD Billion)
12.2.10.5 Mexico Metaverse Market Estimates And Forecasts, By End-user (2020-2032) (USD Billion)
12.3 Europe
12.3.1 Eastern Europe
12.3.1.1 Trends Analysis
12.3.1.2 Eastern Europe Metaverse Market Estimates And Forecasts, By Country (2020-2032) (USD Billion)
12.3.1.3 Eastern Europe Metaverse Market Estimates And Forecasts, By Product (2020-2032) (USD Billion)
12.3.1.4 Eastern Europe Metaverse Market Estimates And Forecasts, By Platform (2020-2032) (USD Billion)
12.3.1.5 Eastern Europe Metaverse Market Estimates And Forecasts, By Technology (2020-2032) (USD Billion)
12.3.1.6 Eastern Europe Metaverse Market Estimates And Forecasts, By Application (2020-2032) (USD Billion)
12.3.1.7 Eastern Europe Metaverse Market Estimates And Forecasts, By End-user (2020-2032) (USD Billion)
12.3.1.8 Poland
12.3.1.8.1 Poland Metaverse Market Estimates And Forecasts, By Product (2020-2032) (USD Billion)
12.3.1.8.2 Poland Metaverse Market Estimates And Forecasts, By Platform (2020-2032) (USD Billion)
12.3.1.8.3 Poland Metaverse Market Estimates And Forecasts, By Technology (2020-2032) (USD Billion)
12.3.1.8.4 Poland Metaverse Market Estimates And Forecasts, By Application (2020-2032) (USD Billion)
12.3.1.8.5 Poland Metaverse Market Estimates And Forecasts, By End-user (2020-2032) (USD Billion)
12.3.1.9 Romania
12.3.1.9.1 Romania Metaverse Market Estimates And Forecasts, By Product (2020-2032) (USD Billion)
12.3.1.9.2 Romania Metaverse Market Estimates And Forecasts, By Platform (2020-2032) (USD Billion)
12.3.1.9.3 Romania Metaverse Market Estimates And Forecasts, By Technology (2020-2032) (USD Billion)
12.3.1.9.4 Romania Metaverse Market Estimates And Forecasts, By Application (2020-2032) (USD Billion)
12.3.1.9.5 Romania Metaverse Market Estimates And Forecasts, By End-user (2020-2032) (USD Billion)
12.3.1.10 Hungary
12.3.1.10.1 Hungary Metaverse Market Estimates And Forecasts, By Product (2020-2032) (USD Billion)
12.3.1.10.2 Hungary Metaverse Market Estimates And Forecasts, By Platform (2020-2032) (USD Billion)
12.3.1.10.3 Hungary Metaverse Market Estimates And Forecasts, By Technology (2020-2032) (USD Billion)
12.3.1.10.4 Hungary Metaverse Market Estimates And Forecasts, By Application (2020-2032) (USD Billion)
12.3.1.10.5 Hungary Metaverse Market Estimates And Forecasts, By End-user (2020-2032) (USD Billion)
12.3.1.11 Turkey
12.3.1.11.1 Turkey Metaverse Market Estimates And Forecasts, By Product (2020-2032) (USD Billion)
12.3.1.11.2 Turkey Metaverse Market Estimates And Forecasts, By Platform (2020-2032) (USD Billion)
12.3.1.11.3 Turkey Metaverse Market Estimates And Forecasts, By Technology (2020-2032) (USD Billion)
12.3.1.11.4 Turkey Metaverse Market Estimates And Forecasts, By Application (2020-2032) (USD Billion)
12.3.1.11.5 Turkey Metaverse Market Estimates And Forecasts, By End-user (2020-2032) (USD Billion)
12.3.1.12 Rest Of Eastern Europe
12.3.1.12.1 Rest Of Eastern Europe Metaverse Market Estimates And Forecasts, By Product (2020-2032) (USD Billion)
12.3.1.12.2 Rest Of Eastern Europe Metaverse Market Estimates And Forecasts, By Platform (2020-2032) (USD Billion)
12.3.1.12.3 Rest Of Eastern Europe Metaverse Market Estimates And Forecasts, By Technology (2020-2032) (USD Billion)
12.3.1.12.4 Rest Of Eastern Europe Metaverse Market Estimates And Forecasts, By Application (2020-2032) (USD Billion)
12.3.1.12.5 Rest Of Eastern Europe Metaverse Market Estimates And Forecasts, By End-user (2020-2032) (USD Billion)
12.3.2 Western Europe
12.3.2.1 Trends Analysis
12.3.2.2 Western Europe Metaverse Market Estimates And Forecasts, By Country (2020-2032) (USD Billion)
12.3.2.3 Western Europe Metaverse Market Estimates And Forecasts, By Product (2020-2032) (USD Billion)
12.3.2.4 Western Europe Metaverse Market Estimates And Forecasts, By Platform (2020-2032) (USD Billion)
12.3.2.5 Western Europe Metaverse Market Estimates And Forecasts, By Technology (2020-2032) (USD Billion)
12.3.2.6 Western Europe Metaverse Market Estimates And Forecasts, By Application (2020-2032) (USD Billion)
12.3.2.7 Western Europe Metaverse Market Estimates And Forecasts, By End-user (2020-2032) (USD Billion)
12.3.2.8 Germany
12.3.2.8.1 Germany Metaverse Market Estimates And Forecasts, By Product (2020-2032) (USD Billion)
12.3.2.8.2 Germany Metaverse Market Estimates And Forecasts, By Platform (2020-2032) (USD Billion)
12.3.2.8.3 Germany Metaverse Market Estimates And Forecasts, By Technology (2020-2032) (USD Billion)
12.3.2.8.4 Germany Metaverse Market Estimates And Forecasts, By Application (2020-2032) (USD Billion)
12.3.2.8.5 Germany Metaverse Market Estimates And Forecasts, By End-user (2020-2032) (USD Billion)
12.3.2.9 France
12.3.2.9.1 France Metaverse Market Estimates And Forecasts, By Product (2020-2032) (USD Billion)
12.3.2.9.2 France Metaverse Market Estimates And Forecasts, By Platform (2020-2032) (USD Billion)
12.3.2.9.3 France Metaverse Market Estimates And Forecasts, By Technology (2020-2032) (USD Billion)
12.3.2.9.4 France Metaverse Market Estimates And Forecasts, By Application (2020-2032) (USD Billion)
12.3.2.9.5 France Metaverse Market Estimates And Forecasts, By End-user (2020-2032) (USD Billion)
12.3.2.10 UK
12.3.2.10.1 UK Metaverse Market Estimates And Forecasts, By Product (2020-2032) (USD Billion)
12.3.2.10.2 UK Metaverse Market Estimates And Forecasts, By Platform (2020-2032) (USD Billion)
12.3.2.10.3 UK Metaverse Market Estimates And Forecasts, By Technology (2020-2032) (USD Billion)
12.3.2.10.4 UK Metaverse Market Estimates And Forecasts, By Application (2020-2032) (USD Billion)
12.3.2.10.5 UK Metaverse Market Estimates And Forecasts, By End-user (2020-2032) (USD Billion)
12.3.2.11 Italy
12.3.2.11.1 Italy Metaverse Market Estimates And Forecasts, By Product (2020-2032) (USD Billion)
12.3.2.11.2 Italy Metaverse Market Estimates And Forecasts, By Platform (2020-2032) (USD Billion)
12.3.2.11.3 Italy Metaverse Market Estimates And Forecasts, By Technology (2020-2032) (USD Billion)
12.3.2.11.4 Italy Metaverse Market Estimates And Forecasts, By Application (2020-2032) (USD Billion)
12.3.2.11.5 Italy Metaverse Market Estimates And Forecasts, By End-user (2020-2032) (USD Billion)
12.3.2.12 Spain
12.3.2.12.1 Spain Metaverse Market Estimates And Forecasts, By Product (2020-2032) (USD Billion)
12.3.2.12.2 Spain Metaverse Market Estimates And Forecasts, By Platform (2020-2032) (USD Billion)
12.3.2.12.3 Spain Metaverse Market Estimates And Forecasts, By Technology (2020-2032) (USD Billion)
12.3.2.12.4 Spain Metaverse Market Estimates And Forecasts, By Application (2020-2032) (USD Billion)
12.3.2.12.5 Spain Metaverse Market Estimates And Forecasts, By End-user (2020-2032) (USD Billion)
12.3.2.13 Netherlands
12.3.2.13.1 Netherlands Metaverse Market Estimates And Forecasts, By Product (2020-2032) (USD Billion)
12.3.2.13.2 Netherlands Metaverse Market Estimates And Forecasts, By Platform (2020-2032) (USD Billion)
12.3.2.13.3 Netherlands Metaverse Market Estimates And Forecasts, By Technology (2020-2032) (USD Billion)
12.3.2.13.4 Netherlands Metaverse Market Estimates And Forecasts, By Application (2020-2032) (USD Billion)
12.3.2.13.5 Netherlands Metaverse Market Estimates And Forecasts, By End-user (2020-2032) (USD Billion)
12.3.2.14 Switzerland
12.3.2.14.1 Switzerland Metaverse Market Estimates And Forecasts, By Product (2020-2032) (USD Billion)
12.3.2.14.2 Switzerland Metaverse Market Estimates And Forecasts, By Platform (2020-2032) (USD Billion)
12.3.2.14.3 Switzerland Metaverse Market Estimates And Forecasts, By Technology (2020-2032) (USD Billion)
12.3.2.14.4 Switzerland Metaverse Market Estimates And Forecasts, By Application (2020-2032) (USD Billion)
12.3.2.12.5 Switzerland Metaverse Market Estimates And Forecasts, By End-user (2020-2032) (USD Billion)
12.3.2.15 Austria
12.3.2.15.1 Austria Metaverse Market Estimates And Forecasts, By Product (2020-2032) (USD Billion)
12.3.2.15.2 Austria Metaverse Market Estimates And Forecasts, By Platform (2020-2032) (USD Billion)
12.3.2.15.3 Austria Metaverse Market Estimates And Forecasts, By Technology (2020-2032) (USD Billion)
12.3.2.15.4 Austria Metaverse Market Estimates And Forecasts, By Application (2020-2032) (USD Billion)
12.3.2.15.5 Austria Metaverse Market Estimates And Forecasts, By End-user (2020-2032) (USD Billion)
12.3.2.16 Rest Of Western Europe
12.3.2.16.1 Rest Of Western Europe Metaverse Market Estimates And Forecasts, By Product (2020-2032) (USD Billion)
12.3.2.16.2 Rest Of Western Europe Metaverse Market Estimates And Forecasts, By Platform (2020-2032) (USD Billion)
12.3.2.16.3 Rest Of Western Europe Metaverse Market Estimates And Forecasts, By Technology (2020-2032) (USD Billion)
12.3.2.16.4 Rest Of Western Europe Metaverse Market Estimates And Forecasts, By Application (2020-2032) (USD Billion)
12.3.2.16.5 Rest Of Western Europe Metaverse Market Estimates And Forecasts, By End-user (2020-2032) (USD Billion)
12.4 Asia Pacific
12.4.1 Trends Analysis
12.4.2 Asia Pacific Metaverse Market Estimates And Forecasts, By Country (2020-2032) (USD Billion)
12.4.3 Asia Pacific Metaverse Market Estimates And Forecasts, By Product (2020-2032) (USD Billion)
12.4.4 Asia Pacific Metaverse Market Estimates And Forecasts, By Platform (2020-2032) (USD Billion)
12.4.5 Asia Pacific Metaverse Market Estimates And Forecasts, By Technology (2020-2032) (USD Billion)
12.4.6 Asia Pacific Metaverse Market Estimates And Forecasts, By Application (2020-2032) (USD Billion)
12.4.7 Asia Pacific Metaverse Market Estimates And Forecasts, By End-user (2020-2032) (USD Billion)
12.4.8 China
12.4.8.1 China Metaverse Market Estimates And Forecasts, By Product (2020-2032) (USD Billion)
12.4.8.2 China Metaverse Market Estimates And Forecasts, By Platform (2020-2032) (USD Billion)
12.4.8.3 China Metaverse Market Estimates And Forecasts, By Technology (2020-2032) (USD Billion)
12.4.8.4 China Metaverse Market Estimates And Forecasts, By Application (2020-2032) (USD Billion)
12.4.8.5 China Metaverse Market Estimates And Forecasts, By End-user (2020-2032) (USD Billion)
12.4.9 India
12.4.9.1 India Metaverse Market Estimates And Forecasts, By Product (2020-2032) (USD Billion)
12.4.9.2 India Metaverse Market Estimates And Forecasts, By Platform (2020-2032) (USD Billion)
12.4.9.3 India Metaverse Market Estimates And Forecasts, By Technology (2020-2032) (USD Billion)
12.4.9.4 India Metaverse Market Estimates And Forecasts, By Application (2020-2032) (USD Billion)
12.4.9.5 India Metaverse Market Estimates And Forecasts, By End-user (2020-2032) (USD Billion)
12.4.10 Japan
12.4.10.1 Japan Metaverse Market Estimates And Forecasts, By Product (2020-2032) (USD Billion)
12.4.10.2 Japan Metaverse Market Estimates And Forecasts, By Platform (2020-2032) (USD Billion)
12.4.10.3 Japan Metaverse Market Estimates And Forecasts, By Technology (2020-2032) (USD Billion)
12.4.10.4 Japan Metaverse Market Estimates And Forecasts, By Application (2020-2032) (USD Billion)
12.4.10.5 Japan Metaverse Market Estimates And Forecasts, By End-user (2020-2032) (USD Billion)
12.4.11 South Korea
12.4.11.1 South Korea Metaverse Market Estimates And Forecasts, By Product (2020-2032) (USD Billion)
12.4.11.2 South Korea Metaverse Market Estimates And Forecasts, By Platform (2020-2032) (USD Billion)
12.4.11.3 South Korea Metaverse Market Estimates And Forecasts, By Technology (2020-2032) (USD Billion)
12.4.11.4 South Korea Metaverse Market Estimates And Forecasts, By Application (2020-2032) (USD Billion)
12.4.11.5 South Korea Metaverse Market Estimates And Forecasts, By End-user (2020-2032) (USD Billion)
12.4.12 Vietnam
12.4.12.1 Vietnam Metaverse Market Estimates And Forecasts, By Product (2020-2032) (USD Billion)
12.4.12.2 Vietnam Metaverse Market Estimates And Forecasts, By Platform (2020-2032) (USD Billion)
12.4.12.3 Vietnam Metaverse Market Estimates And Forecasts, By Technology (2020-2032) (USD Billion)
12.4.12.4 Vietnam Metaverse Market Estimates And Forecasts, By Application (2020-2032) (USD Billion)
12.4.12.5 Vietnam Metaverse Market Estimates And Forecasts, By End-user (2020-2032) (USD Billion)
12.4.13 Singapore
12.4.13.1 Singapore Metaverse Market Estimates And Forecasts, By Product (2020-2032) (USD Billion)
12.4.13.2 Singapore Metaverse Market Estimates And Forecasts, By Platform (2020-2032) (USD Billion)
12.4.13.3 Singapore Metaverse Market Estimates And Forecasts, By Technology (2020-2032) (USD Billion)
12.4.13.4 Singapore Metaverse Market Estimates And Forecasts, By Application (2020-2032) (USD Billion)
12.4.13.5 Singapore Metaverse Market Estimates And Forecasts, By End-user (2020-2032) (USD Billion)
12.4.14 Australia
12.4.14.1 Australia Metaverse Market Estimates And Forecasts, By Product (2020-2032) (USD Billion)
12.4.14.2 Australia Metaverse Market Estimates And Forecasts, By Platform (2020-2032) (USD Billion)
12.4.14.3 Australia Metaverse Market Estimates And Forecasts, By Technology (2020-2032) (USD Billion)
12.4.14.4 Australia Metaverse Market Estimates And Forecasts, By Application (2020-2032) (USD Billion)
12.4.14.5 Australia Metaverse Market Estimates And Forecasts, By End-user (2020-2032) (USD Billion)
12.4.15 Rest Of Asia Pacific
12.4.15.1 Rest Of Asia Pacific Metaverse Market Estimates And Forecasts, By Product (2020-2032) (USD Billion)
12.4.15.2 Rest Of Asia Pacific Metaverse Market Estimates And Forecasts, By Platform (2020-2032) (USD Billion)
12.4.15.3 Rest Of Asia Pacific Metaverse Market Estimates And Forecasts, By Technology (2020-2032) (USD Billion)
12.4.15.4 Rest Of Asia Pacific Metaverse Market Estimates And Forecasts, By Application (2020-2032) (USD Billion)
12.4.15.5 Rest Of Asia Pacific Metaverse Market Estimates And Forecasts, By End-user (2020-2032) (USD Billion)
12.5 Middle East And Africa
12.5.1 Middle East
12.5.1.1 Trends Analysis
12.5.1.2 Middle East Metaverse Market Estimates And Forecasts, By Country (2020-2032) (USD Billion)
12.5.1.3 Middle East Metaverse Market Estimates And Forecasts, By Product (2020-2032) (USD Billion)
12.5.1.4 Middle East Metaverse Market Estimates And Forecasts, By Platform (2020-2032) (USD Billion)
12.5.1.5 Middle East Metaverse Market Estimates And Forecasts, By Technology (2020-2032) (USD Billion)
12.5.1.6 Middle East Metaverse Market Estimates And Forecasts, By Application (2020-2032) (USD Billion)
12.5.1.7 Middle East Metaverse Market Estimates And Forecasts, By End-user (2020-2032) (USD Billion)
12.5.1.8 UAE
12.5.1.8.1 UAE Metaverse Market Estimates And Forecasts, By Product (2020-2032) (USD Billion)
12.5.1.8.2 UAE Metaverse Market Estimates And Forecasts, By Platform (2020-2032) (USD Billion)
12.5.1.8.3 UAE Metaverse Market Estimates And Forecasts, By Technology (2020-2032) (USD Billion)
12.5.1.8.4 UAE Metaverse Market Estimates And Forecasts, By Application (2020-2032) (USD Billion)
12.5.1.8.5 UAE Metaverse Market Estimates And Forecasts, By End-user (2020-2032) (USD Billion)
12.5.1.9 Egypt
12.5.1.9.1 Egypt Metaverse Market Estimates And Forecasts, By Product (2020-2032) (USD Billion)
12.5.1.9.2 Egypt Metaverse Market Estimates And Forecasts, By Platform (2020-2032) (USD Billion)
12.5.1.9.3 Egypt Metaverse Market Estimates And Forecasts, By Technology (2020-2032) (USD Billion)
12.5.1.9.4 Egypt Metaverse Market Estimates And Forecasts, By Application (2020-2032) (USD Billion)
12.5.1.9.5 Egypt Metaverse Market Estimates And Forecasts, By End-user (2020-2032) (USD Billion)
12.5.1.10 Saudi Arabia
12.5.1.10.1 Saudi Arabia Metaverse Market Estimates And Forecasts, By Product (2020-2032) (USD Billion)
12.5.1.10.2 Saudi Arabia Metaverse Market Estimates And Forecasts, By Platform (2020-2032) (USD Billion)
12.5.1.10.3 Saudi Arabia Metaverse Market Estimates And Forecasts, By Technology (2020-2032) (USD Billion)
12.5.1.10.4 Saudi Arabia Metaverse Market Estimates And Forecasts, By Application (2020-2032) (USD Billion)
12.5.1.10.5 Saudi Arabia Metaverse Market Estimates And Forecasts, By End-user (2020-2032) (USD Billion)
12.5.1.11 Qatar
12.5.1.11.1 Qatar Metaverse Market Estimates And Forecasts, By Product (2020-2032) (USD Billion)
12.5.1.11.2 Qatar Metaverse Market Estimates And Forecasts, By Platform (2020-2032) (USD Billion)
12.5.1.11.3 Qatar Metaverse Market Estimates And Forecasts, By Technology (2020-2032) (USD Billion)
12.5.1.11.4 Qatar Metaverse Market Estimates And Forecasts, By Application (2020-2032) (USD Billion)
12.5.1.11.5 Qatar Metaverse Market Estimates And Forecasts, By End-user (2020-2032) (USD Billion)
12.5.1.12 Rest Of Middle East
12.5.1.12.1 Rest Of Middle East Metaverse Market Estimates And Forecasts, By Product (2020-2032) (USD Billion)
12.5.1.12.2 Rest Of Middle East Metaverse Market Estimates And Forecasts, By Platform (2020-2032) (USD Billion)
12.5.1.12.3 Rest Of Middle East Metaverse Market Estimates And Forecasts, By Technology (2020-2032) (USD Billion)
12.5.1.12.4 Rest Of Middle East Metaverse Market Estimates And Forecasts, By Application (2020-2032) (USD Billion)
12.5.1.12.5 Rest Of Middle East Metaverse Market Estimates And Forecasts, By End-user (2020-2032) (USD Billion)
12.5.2 Africa
12.5.2.1 Trends Analysis
12.5.2.2 Africa Metaverse Market Estimates And Forecasts, By Country (2020-2032) (USD Billion)
12.5.2.3 Africa Metaverse Market Estimates And Forecasts, By Product (2020-2032) (USD Billion)
12.5.2.4 Africa Metaverse Market Estimates And Forecasts, By Platform (2020-2032) (USD Billion)
12.5.2.5 Africa Metaverse Market Estimates And Forecasts, By Technology (2020-2032) (USD Billion)
12.5.2.6 Africa Metaverse Market Estimates And Forecasts, By Application (2020-2032) (USD Billion)
12.5.2.7 Africa Metaverse Market Estimates And Forecasts, By End-user (2020-2032) (USD Billion)
12.5.2.8 South Africa
12.5.2.8.1 South Africa Metaverse Market Estimates And Forecasts, By Product (2020-2032) (USD Billion)
12.5.2.8.2 South Africa Metaverse Market Estimates And Forecasts, By Platform (2020-2032) (USD Billion)
12.5.2.8.3 South Africa Metaverse Market Estimates And Forecasts, By Technology (2020-2032) (USD Billion)
12.5.2.8.4 South Africa Metaverse Market Estimates And Forecasts, By Application (2020-2032) (USD Billion)
12.5.2.8.5 South Africa Metaverse Market Estimates And Forecasts, By End-user (2020-2032) (USD Billion)
12.5.2.9 Nigeria
12.5.2.9.1 Nigeria Metaverse Market Estimates And Forecasts, By Product (2020-2032) (USD Billion)
12.5.2.9.2 Nigeria Metaverse Market Estimates And Forecasts, By Platform (2020-2032) (USD Billion)
12.5.2.9.3 Nigeria Metaverse Market Estimates And Forecasts, By Technology (2020-2032) (USD Billion)
12.5.2.9.4 Nigeria Metaverse Market Estimates And Forecasts, By Application (2020-2032) (USD Billion)
12.5.2.9.5 Nigeria Metaverse Market Estimates And Forecasts, By End-user (2020-2032) (USD Billion)
12.5.2.10 Rest Of Africa
12.5.2.10.1 Rest Of Africa Metaverse Market Estimates And Forecasts, By Product (2020-2032) (USD Billion)
12.5.2.10.2 Rest Of Africa Metaverse Market Estimates And Forecasts, By Platform (2020-2032) (USD Billion)
12.5.2.10.3 Rest Of Africa Metaverse Market Estimates And Forecasts, By Technology (2020-2032) (USD Billion)
12.5.2.10.4 Rest Of Africa Metaverse Market Estimates And Forecasts, By Application (2020-2032) (USD Billion)
12.5.2.10.5 Rest Of Africa Metaverse Market Estimates And Forecasts, By End-user (2020-2032) (USD Billion)
12.6 Latin America
12.6.1 Trends Analysis
12.6.2 Latin America Metaverse Market Estimates And Forecasts, By Country (2020-2032) (USD Billion)
12.6.3 Latin America Metaverse Market Estimates And Forecasts, By Product (2020-2032) (USD Billion)
12.6.4 Latin America Metaverse Market Estimates And Forecasts, By Platform (2020-2032) (USD Billion)
12.6.5 Latin America Metaverse Market Estimates And Forecasts, By Technology (2020-2032) (USD Billion)
12.6.6 Latin America Metaverse Market Estimates And Forecasts, By Application (2020-2032) (USD Billion)
12.6.7 Latin America Metaverse Market Estimates And Forecasts, By End-user (2020-2032) (USD Billion)
12.6.8 Brazil
12.6.8.1 Brazil Metaverse Market Estimates And Forecasts, By Product (2020-2032) (USD Billion)
12.6.8.2 Brazil Metaverse Market Estimates And Forecasts, By Platform (2020-2032) (USD Billion)
12.6.8.3 Brazil Metaverse Market Estimates And Forecasts, By Technology (2020-2032) (USD Billion)
12.6.8.4 Brazil Metaverse Market Estimates And Forecasts, By Application (2020-2032) (USD Billion)
12.6.8.5 Brazil Metaverse Market Estimates And Forecasts, By End-user (2020-2032) (USD Billion)
12.6.9 Argentina
12.6.9.1 Argentina Metaverse Market Estimates And Forecasts, By Product (2020-2032) (USD Billion)
12.6.9.2 Argentina Metaverse Market Estimates And Forecasts, By Platform (2020-2032) (USD Billion)
12.6.9.3 Argentina Metaverse Market Estimates And Forecasts, By Technology (2020-2032) (USD Billion)
12.6.9.4 Argentina Metaverse Market Estimates And Forecasts, By Application (2020-2032) (USD Billion)
12.6.9.5 Argentina Metaverse Market Estimates And Forecasts, By End-user (2020-2032) (USD Billion)
12.6.10 Colombia
12.6.10.1 Colombia Metaverse Market Estimates And Forecasts, By Product (2020-2032) (USD Billion)
12.6.10.2 Colombia Metaverse Market Estimates And Forecasts, By Platform (2020-2032) (USD Billion)
12.6.10.3 Colombia Metaverse Market Estimates And Forecasts, By Technology (2020-2032) (USD Billion)
12.6.10.4 Colombia Metaverse Market Estimates And Forecasts, By Application (2020-2032) (USD Billion)
12.6.10.5 Colombia Metaverse Market Estimates And Forecasts, By End-user (2020-2032) (USD Billion)
12.6.11 Rest Of Latin America
12.6.11.1 Rest Of Latin America Metaverse Market Estimates And Forecasts, By Product (2020-2032) (USD Billion)
12.6.11.2 Rest Of Latin America Metaverse Market Estimates And Forecasts, By Platform (2020-2032) (USD Billion)
12.6.11.3 Rest Of Latin America Metaverse Market Estimates And Forecasts, By Technology (2020-2032) (USD Billion)
12.6.11.4 Rest Of Latin America Metaverse Market Estimates And Forecasts, By Application (2020-2032) (USD Billion)
12.6.11.5 Rest Of Latin America Metaverse Market Estimates And Forecasts, By End-user (2020-2032) (USD Billion)
13. Company Profiles
13.1 Meta Platforms, Inc.
13.1.1 Company Overview
13.1.2 Financial
13.1.3 Products/ Services Offered
13.1.4 SWOT Analysis
13.2 Tencent Holdings Ltd.
13.2.1 Company Overview
13.2.2 Financial
13.2.3 Products/ Services Offered
13.2.4 SWOT Analysis
13.3 ByteDance Ltd.
13.3.1 Company Overview
13.3.2 Financial
13.3.3 Products/ Services Offered
13.3.4 SWOT Analysis
13.4 NetEase, Inc.
13.4.1 Company Overview
13.4.2 Financial
13.4.3 Products/ Services Offered
13.4.4 SWOT Analysis
13.5 Nvidia Corporation
13.5.1 Company Overview
13.5.2 Financial
13.5.3 Products/ Services Offered
13.5.4 SWOT Analysis
13.6 Epic Games, Inc.
13.6.1 Company Overview
13.6.2 Financial
13.6.3 Products/ Services Offered
13.6.4 SWOT Analysis
13.7 Roblox Corporation
13.7.1 Company Overview
13.7.2 Financial
13.7.3 Products/ Services Offered
13.7.4 SWOT Analysis
13.8 Unity Technologies, Inc.
13.8.1 Company Overview
13.8.2 Financial
13.8.3 Products/ Services Offered
13.8.4 SWOT Analysis
13.9 Lilith Games
13.9.1 Company Overview
13.9.2 Financial
13.9.3 Products/ Services Offered
13.9.4 SWOT Analysis
13.10 Nextech AR Solutions Corp
13.12.1 Company Overview
13.12.2 Financial
13.12.3 Products/ Services Offered
13.12.4 SWOT Analysis
14. Use Cases and Best Practices
15. Conclusion
An accurate research report requires proper strategizing as well as implementation. There are multiple factors involved in the completion of good and accurate research report and selecting the best methodology to compete the research is the toughest part. Since the research reports we provide play a crucial role in any company’s decision-making process, therefore we at SNS Insider always believe that we should choose the best method which gives us results closer to reality. This allows us to reach at a stage wherein we can provide our clients best and accurate investment to output ratio.
Each report that we prepare takes a timeframe of 350-400 business hours for production. Starting from the selection of titles through a couple of in-depth brain storming session to the final QC process before uploading our titles on our website we dedicate around 350 working hours. The titles are selected based on their current market cap and the foreseen CAGR and growth.
The 5 steps process:
Step 1: Secondary Research:
Secondary Research or Desk Research is as the name suggests is a research process wherein, we collect data through the readily available information. In this process we use various paid and unpaid databases which our team has access to and gather data through the same. This includes examining of listed companies’ annual reports, Journals, SEC filling etc. Apart from this our team has access to various associations across the globe across different industries. Lastly, we have exchange relationships with various university as well as individual libraries.
Step 2: Primary Research
When we talk about primary research, it is a type of study in which the researchers collect relevant data samples directly, rather than relying on previously collected data. This type of research is focused on gaining content specific facts that can be sued to solve specific problems. Since the collected data is fresh and first hand therefore it makes the study more accurate and genuine.
We at SNS Insider have divided Primary Research into 2 parts.
Part 1 wherein we interview the KOLs of major players as well as the upcoming ones across various geographic regions. This allows us to have their view over the market scenario and acts as an important tool to come closer to the accurate market numbers. As many as 45 paid and unpaid primary interviews are taken from both the demand and supply side of the industry to make sure we land at an accurate judgement and analysis of the market.
This step involves the triangulation of data wherein our team analyses the interview transcripts, online survey responses and observation of on filed participants. The below mentioned chart should give a better understanding of the part 1 of the primary interview.
Part 2: In this part of primary research the data collected via secondary research and the part 1 of the primary research is validated with the interviews from individual consultants and subject matter experts.
Consultants are those set of people who have at least 12 years of experience and expertise within the industry whereas Subject Matter Experts are those with at least 15 years of experience behind their back within the same space. The data with the help of two main processes i.e., FGDs (Focused Group Discussions) and IDs (Individual Discussions). This gives us a 3rd party nonbiased primary view of the market scenario making it a more dependable one while collation of the data pointers.
Step 3: Data Bank Validation
Once all the information is collected via primary and secondary sources, we run that information for data validation. At our intelligence centre our research heads track a lot of information related to the market which includes the quarterly reports, the daily stock prices, and other relevant information. Our data bank server gets updated every fortnight and that is how the information which we collected using our primary and secondary information is revalidated in real time.
Step 4: QA/QC Process
After all the data collection and validation our team does a final level of quality check and quality assurance to get rid of any unwanted or undesired mistakes. This might include but not limited to getting rid of the any typos, duplication of numbers or missing of any important information. The people involved in this process include technical content writers, research heads and graphics people. Once this process is completed the title gets uploader on our platform for our clients to read it.
Step 5: Final QC/QA Process:
This is the last process and comes when the client has ordered the study. In this process a final QA/QC is done before the study is emailed to the client. Since we believe in giving our clients a good experience of our research studies, therefore, to make sure that we do not lack at our end in any way humanly possible we do a final round of quality check and then dispatch the study to the client.
Key Segments:
By Product
Infrastructure
Chips & Processors
Network Capabilities
Cloud & Edge Infrastructure
Cybersecurity
Hardware
Holographic Displays
eXtended Reality (XR) Hardware
Haptic Sensors & Devices
Smart Glasses
Omni Treadmills
AR/VR Devices
Others
Software
Asset Creation Tools
Programming Engine
Virtual Platforms
Avatar Development
Services
User Experiences
Asset Marketplaces
Financial Services
By Platform
Desktop
Mobile
Headsets
By Technology
Virtual Reality (VR) & Augmented Reality (AR)
Blockchain
Mixed Reality (MR)
Others
By Application
Gaming
Online Shopping
Content Creation & Social Media
Testing & Inspection
Events & Conference
Digital Marketing (Advertising)
Others
By End-user
Aerospace & Defense
Healthcare
Education
Media & Entertainment
Tourism & Hospitality
BFSI
Retail
Automotive
Others
Request for Segment Customization as per your Business Requirement: Segment Customization Request
REGIONAL COVERAGE:
North America
US
Canada
Mexico
Europe
Eastern Europe
Poland
Romania
Hungary
Turkey
Rest of Eastern Europe
Western Europe
Germany
France
UK
Italy
Spain
Netherlands
Switzerland
Austria
Rest of Western Europe
Asia Pacific
China
India
Japan
South Korea
Vietnam
Singapore
Australia
Rest of Asia Pacific
Middle East & Africa
Middle East
UAE
Egypt
Saudi Arabia
Qatar
Rest of the Middle East
Africa
Nigeria
South Africa
Rest of Africa
Latin America
Brazil
Argentina
Colombia
Request for Country Level Research Report: Country Level Customization Request
Available Customization
With the given market data, SNS Insider offers customization as per the company’s specific needs. The following customization options are available for the report:
Product Analysis
Criss-Cross segment analysis (e.g. Product X Application)
Product Matrix which gives a detailed comparison of product portfolio of each company
Geographic Analysis
Additional countries in any of the regions
Company Information
Detailed analysis and profiling of additional market players (Up to five)
The Low Code Development Platform Market size was recorded at USD 22.80 Billion in 2023 and is expected to surpass USD 271.7 Billion by 2032, growing at a CAGR of 31.7% over the forecast period of 2024-2032.
The AI Orchestration Market size was USD 7.88 billion in 2023 and is expected to Reach USD 47.22 billion by 2032 and grow at a CAGR of 22.01 % by 2024-2032.
The Web 3.0 blockchain Market size was USD 0.42 billion in 2023 and is expected to Reach USD 5.8 billion by 2030 and grow at a CAGR of 45% over the forecast period of 2024-2031.
The Smart Space Market size was USD 39.2 billion in 2022 and is expected to Reach USD 108.7 billion by 2030 and grow at a CAGR of 13.6 % over the forecast period of 2023-2030.
The IoT MVNO Market size was USD 2.8 Billion in 2023 and is expected to Reach USD 12.80 Billion by 2032 and grow at a CAGR of 18.4% over the forecast period of 2024-2032.
The Smart Home Market size was valued at USD 105 Billion in 2023 and is expected to grow to USD 550 Billion By 2032 and grow at a CAGR of 20.2% over the forecast period of 2024-2032.
Hi! Click one of our member below to chat on Phone