Machine Vision Lighting Market Size & Trends:
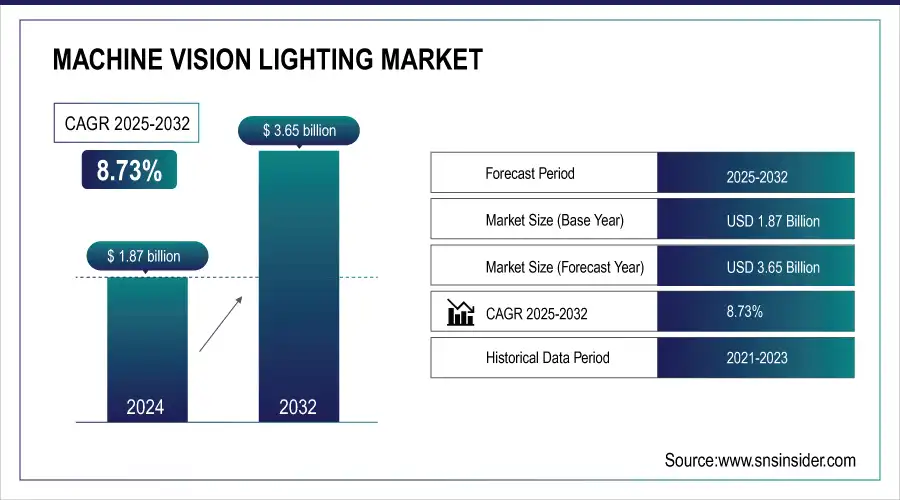
The Machine Vision Lighting Market size was valued at USD 1.87 Billion in 2024 and is projected to reach USD 3.65 Billion by 2032, growing at a CAGR of 8.73 % during 2025-2032.
To Get more information On Machine Vision Lighting Market - Request Free Sample Report
The machine vision lighting industry is growing quite significantly in the manufacturing, automotive and electronics industries, where the need for precision together with the introduction of the lighting is increasing. As quality control takes advantage of automation and machine vision systems are calling for more from lighting for better image clarity and accuracy of inspection. These trends are in the form of a shift to long-life, energy efficient, customizable LED illumination systems and a preference for lighting with uniform brightness and high intensity. These upgrades increase inspection performance in challenging environments and high-speed processing lines. With the development of automation technology, market will continue to grow as industries strive for automation, efficiency, and production quality, which is driving the market growth as manufacturing sector is becoming more complex.
Metaphase Lighting Technologies to present its leading LED Lighting solutions, With the recently redesigned RBL Bar Light providing intense output for IP69K-rated environments to the ultra-high output UB-LL LED Line Light (750 mm), featuring output to 2.5 million lux for demanding machine vision applications, at Automate 2025
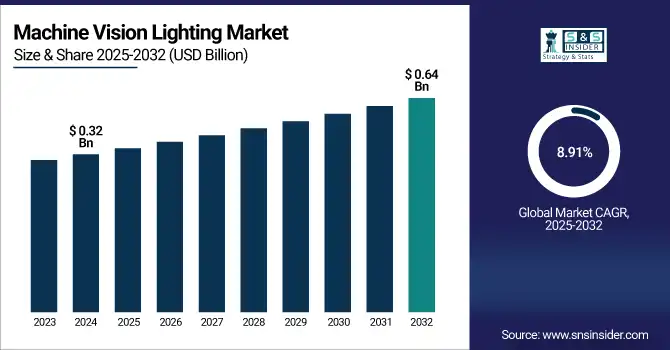
The U.S. machine vision lighting market size was valued at USD 0.32 Billion in 2024 and is projected to reach USD 0.64 Billion by 2032, growing at a CAGR of 8.91%, due to rising penetration of automation, robotics, and the need for high precision, energy-efficient lighting solutions among end users in the automotive, electronics, and pharmaceutical verticals.
Machine Vision Lighting Market Dynamics:
Drivers:
-
Dual-Mode Sensing Technology Revolutionizes Machine Vision, Boosting Efficiency and Real-Time Responsiveness
The increasing need for high precision, machine vision solutions in real time can be attributed to advances in dual mode sensing in static and dynamic phenomenon. This advancement allows for the accurate, simultaneous capture of both motion and colour/intensity information, addressing the deficiencies of previous image sensors that operate on these two functions independent of each other. In this era when industries, such as autonomous vehicles, robotics and surveillance require more responsive and efficient visual systems, compact, and low-power cubic phototransistors are expected to bring more remarkable performance, resulting in a lower energy cost, to the systems. THD also reinforces the demand for scalable, high performance machine vision technology making way for intelligent and reliable applications in multiple industries.
Researchers at Zhejiang University in Hangzhou, China, have developed a dual-gate MoS₂ phototransistor with a 120 dB dynamic range, 15 µs response time, and ultra-low power consumption of 10 pW per pixel. This device, featured in Advanced Materials, captures both static grayscale and dynamic events, supporting high-density integration with a simulated 128×128 array.
Restraints:
-
Increased Maintenance Demands Lead to Higher Costs in Long-Term Machine Vision Lighting Performance
High performance machine vision lighting solutions also tend to have high-maintenance. Users of these systems must have them serviced regularly for them to maintain their high-performance levels and this is especially true for industrial situations in which lighting systems are exposed to dust, vibration, and moisture and other such unforgiving conditions. The complexity of advanced technologies including LED and laser systems, accentuates that components might lose sensitivity or require adjustment. This type of system now plays a major role in the economy in many businesses, and the costs for the servicing and replacement of parts cannot only be considerable, but may represent an important factor in the long-term profitability of such businesses. There is also the cost of expertise required to repair it, which adds a cost to running high-performance systems over a longer lifespan.
Opportunities:
-
Advancements in Machine Vision Technology Enhance Performance and Drive Innovation Across Industries
Machine vision technology now offers solutions that can adapt to changing lighting conditions and can process high resolution events rapidly ultimately enhancing accuracy in industries that depend on advanced vision systems. The result is faster, more precise, and more responsive performances. By eliminating the held-ups of classic exposure controls with on-the-fly adjustability, these innovations pave the way toward new opportunities in applications, such as autonomous driving, augmented reality, and medical robotics. With the increasing need for more intelligent and dependable vision systems, these innovations promise to drive market growth for applications demanding greater versatility and higher performance. They are anticipated to transform the reliability and capabilities of applications in a wide range of industries, enabling significant market growth for advanced vision solutions.
The NEC system's ability to handle dynamic lighting conditions enhances vision systems in autonomous driving, augmented reality, and medical robotics. By integrating event cameras with a novel TEDI algorithm, it improves detection accuracy by 47.3% in autonomous driving, achieves 11% higher pose estimation in AR, and enables continuous SLAM in overexposed environments, ensuring clearer intraoperative visualization in medical applications.
Challenges:
-
Integration of Lighting with Vision Systems Enhances Performance and Increases Complexity
Integrating advanced lighting technologies with machine vision systems presents significant challenges, particularly in achieving precise calibration and ensuring compatibility between the two components. The challenge comes from the requirement to synchronize the lighting and the vision system in order to sustain high quality images from varying environments. Lighting variations (in brightness, contrast, and color temperature) can impact the imaging system’s capability to acquire data accurately. Furthermore, the introduction of additional features, such as adaptive illumination or dynamic exposure control, can make system design even more complex, as these features need to interactively interface with the exposure control of the vision system. Such challenges may cause an increase in time and expense required for development, thus demanding that integration more efficiently and reliably secure system performance.
Machine Vision Lighting Market Segmentation Analysis:
By Product Type
Xenon Segment held a dominant machine vision lighting market share of around 46% in 2024 and is projected to experience fastest growth in the market during 2025-2032, at a CAGR of 10.50%. Increase in demand for Xenon segment in the machine vision lighting market, can be attributed to its high-intensity brightness and quality of light that can penetrate through the harsh environments in different industrial applications. Its accelerated growth is driven by the rising need of the high-end lighting in the areas of the automobile, and the production and the robot were precision and reliability are essentials.
By Spectrum Lights
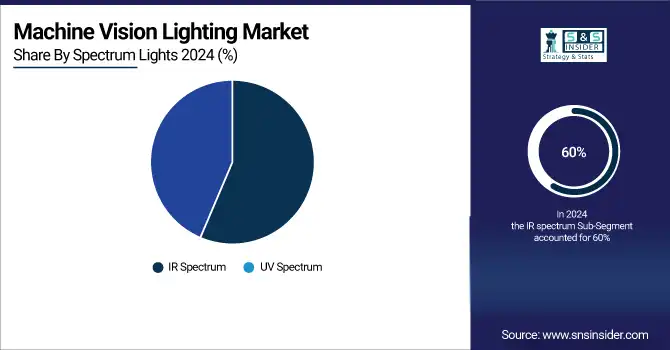
The IR spectrum segment held a dominant machine vision lighting market share of around 60% in 2024. This segment is driven by its ability to provide clear and precise imaging in low-light or dark environments. With growing demand for high-precision applications in industries including automotive, security, and manufacturing, infrared lighting's role in enhancing machine vision systems continues to expand.
The UV spectrum segment is expected to experience the fastest growth in the machine vision lighting market over 2025-2032 with CAGR 9.93%, due to the rising need for high precision imaging for various applications including material inspection, semiconductor manufacturing, and forensics. The high contrast and fine detail visibility of UV lighting for quality control has resulted in its growth over virtually every industry, including where detailed surface analysis is necessary.
By Application
The Automotive segment held a machine vision lighting market share of around 31% in 2024, driven by the growing number of digital document processing to maintain the record of vehicles, insurance service, and regulatory compliance. Given the increasing automation and efficient e in vehicle documentation, the need for higher grade document readers in the automobile industry is rising.
The Electronics & Semiconductor segment is projected to grow fastest in the machine vision lighting during 2025-2032, with a CAGR of 10.33%. This growth is driven by the increasing demand for precision in microelectronics manufacturing, advancements in semiconductor fabrication processes, and the need for high-resolution vision systems for quality control.
By End-User
The Manufacturing segment held a dominant machine vision lighting market share of around 46% in 2024. This expansion is based on the advancing need of automation and quality control on production lines. Increasing demand for the high speed and accurate inspection and defect detection is driving the growth of the market, as producers implement the latest machine vision lighting solutions to strengthen productivity and product quality.
The Healthcare segment is projected to grow fastest in the machine vision lighting market during 2025-2032, with a CAGR of 10.59%. The healthcare segment’s rapid growth in machine vision lighting is due to the growing need for accurate diagnosing, surgical aid, and medical imaging. With hospitals moving to more high-tech vision systems to achieve improved accuracy and real-time feedback, lighting technology is also advancing quality of care and operational efficiencies in healthcare.
Machine Vision Lighting Market Regional Overview:
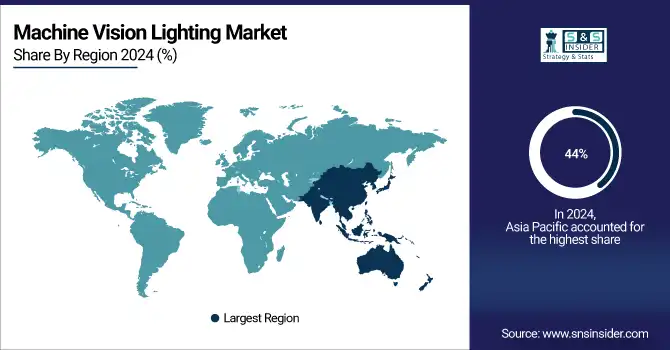
In 2024, the Asia-Pacific dominated the machine vision lighting market and accounted for 44% of revenue share. The market is fueled by the burgeoning industrialization, rising demand for automation solutions, and the high demand for quality and high-speed vision systems in manufacturing, electronics, and automotive applications.
Get Customized Report as per Your Business Requirement - Enquiry Now
In Asia-Pacific region, China dominated machine vision lighting market, driven by rapid industrialization and significant investments in automation technologies.
North America is projected to register the fastest CAGR of 9.97% during 2025-2032, driven by rapid advancements in automation, AI, and robotics technologies. Increased adoption across key industries such as manufacturing, automotive, and healthcare, alongside the growing demand for high-performance vision systems, fuels market expansion in the region.
The U.S. leads the country in machine vision lighting market, driven by automation, AI developments, and surging demand for precision vision system.
In 2024, Europe emerged as a promising region in the machine vision lighting market, due to the huge demand for automation, robotics and AI in various end use industries. Germany is also the forerunner nation in this development by taking a leading part in the implementation of new manufacturing technologies. The automotive, industrial and electronics industries are major drivers of the market growth in the region.
LATAM and MEA is experiencing steady growth in the machine vision lighting market, driven by expanding industrial automation, infrastructure development, and increasing adoption of advanced technologies. As sectors including manufacturing and logistics evolve, the demand for high-precision vision systems rises to enhance operational efficiency and product quality across industries.
Key Players:
The machine vision lighting market companies Keyence, Omron, Cognex, FLIR, Basler, Teledyne, Sony, Micro-Epsilon, Advanced Illumination, LUCID Vision Labs, Inc., Tri-Tronics, Advanced Materials, Meta Phase, and Others.
Recent Developments:
-
In July 2024, LUCID Vision Labs launched the Triton2 EVS event-based camera series, offering high-speed, shutter less imaging for machine vision in extreme lighting conditions, enhancing object recognition.
-
Teledyne DALSA began production of its Linea Lite 8k Super Resolution GigE Vision camera, offering compact design, enhanced subpixel defect detection, and high-speed imaging for advanced machine vision applications.
| Report Attributes | Details |
|---|---|
| Market Size in 2024 | USD 1.87 Billion |
| Market Size by 2032 | USD 3.65 Billion |
| CAGR | CAGR of 8.73% From 2025 to 2032 |
| Base Year | 2024 |
| Forecast Period | 2025-2032 |
| Historical Data | 2021-2023 |
| Report Scope & Coverage | Market Size, Segments Analysis, Competitive Landscape, Regional Analysis, DROC & SWOT Analysis, Forecast Outlook |
| Key Segments | • By Product Type(LED, Xenon, Fluorescent, Fiber Optic, Halogen and Other Product Types) • By Spectrum Lights(UV Spectrum and IR Spectrum) • By Application (Electronics & Semiconductor, Automotive, Pharmaceuticals, Food & Beverage, Packaging and Other Product Types) • By End User (Manufacturing, Healthcare, Logistics & Retail and Other End Users) |
| Regional Analysis/Coverage | North America (US, Canada, Mexico), Europe (Germany, France, UK, Italy, Spain, Poland, Turkey, Rest of Europe), Asia Pacific (China, India, Japan, South Korea, Singapore, Australia, Taiwan, Rest of Asia Pacific), Middle East & Africa (UAE, Saudi Arabia, Qatar, South Africa, Rest of Middle East & Africa), Latin America (Brazil, Argentina, Rest of Latin America) |
| Company Profiles | The machine vision lighting market companies Keyence, Omron, Cognex, FLIR, Basler, Teledyne, Sony, Micro-Epsilon, Advanced Illumination, LUCID Vision Labs, Inc., Tri-Tronics, Advanced Materials, Meta Phase and Others. |
Frequently Asked Questions
Asia-Pacific dominated the Machine Vision Lighting Market in 2024.
The “Xenon” segment dominated the Machine Vision Lighting Market.
Key drivers of the Machine Vision Lighting Market include advancements in automation, AI, and the growing need for high-precision inspection in various industries.
The Machine Vision Lighting was USD 1.87 Billion in 2024 and is expected to Reach USD 3.65 Billion by 2032.
The Machine Vision Lighting Market is expected to grow at a CAGR of 8.73 % during 2025-2032.
Get in Touch
