4D Imaging Radar Market Report Scope & Overview:
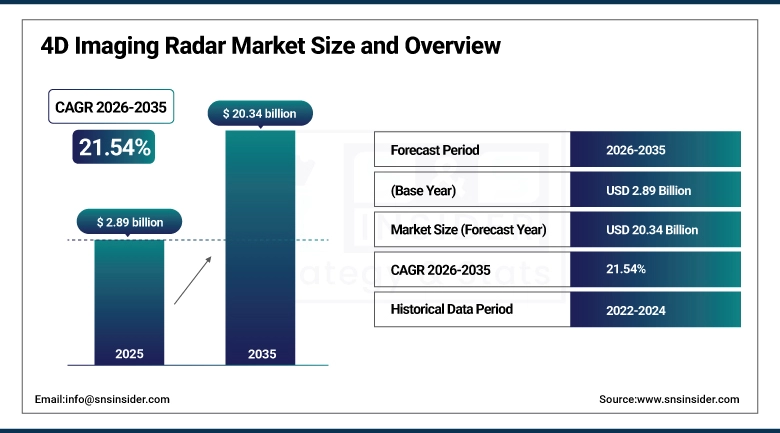
The 4D Imaging Radar Market size was valued at USD 2.89 Billion in 2025 and is projected to reach USD 20.34 Billion by 2035, growing at a CAGR of 21.54% during 2026–2035.
The 4D Imaging Radar Market is growing due to the increasing need for advanced driver-assistance systems (ADAS) and autonomous vehicles, as the high-resolution sensing capabilities play a critical role in the safe operation of the vehicle. The increasing automotive safety regulations and the growing adoption of electric vehicles are also contributing to the 4D Imaging Radar Market’s growth. The increasing technological capabilities of the radar, including the detection of objects and real-time mapping, are also boosting the 4D Imaging Radar Market’s growth. The increasing investment in smart mobility and intelligent transportation systems is also accelerating the adoption of 4D imaging radar solutions across the globe.
4D Imaging Radar Market Size and Growth Forecast:
-
Market Size in 2025: USD 2.89 Billion
-
Market Size by 2035: USD 20.34 Billion
-
CAGR: 21.54% during 2026–2035
-
Base Year: 2025
-
Forecast Period: 2026–2035
-
Historical Data: 2022–2024
To Get more information on 4D Imaging Radar Market - Request Free Sample Report
4D Imaging Radar Market Key Trends:
-
Increasing adoption of advanced driver-assistance systems (ADAS) and autonomous driving technologies is driving demand for high-resolution 4D imaging radar systems in modern vehicles.
-
Rising focus on vehicle safety and stringent government regulations are accelerating the integration of advanced radar solutions across passenger and commercial vehicles.
-
Advancements in radar technology, including improved range, accuracy, and object classification capabilities, are enhancing overall system performance and reliability.
-
Growing penetration of electric vehicles (EVs) is creating new opportunities for compact, energy-efficient radar systems in next-generation automotive platforms.
-
Integration of artificial intelligence and sensor fusion technologies is enabling better real-time decision-making and environmental perception.
-
Increasing investments in smart mobility and intelligent transportation infrastructure are supporting large-scale deployment of 4D imaging radar solutions globally.
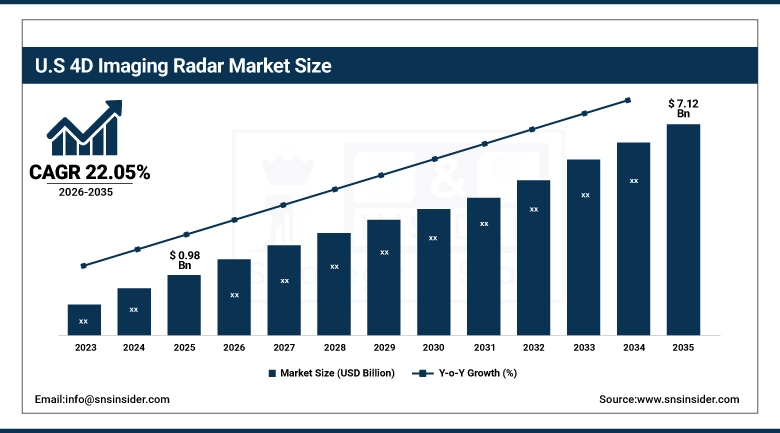
U.S. 4D Imaging Radar Market Size Outlook:
The U.S. 4D Imaging Radar Market size was valued at USD 0.98 Billion in 2025 and is projected to reach USD 7.12 Billion by 2035, growing at a CAGR of 22.05% during 2026–2035. The U.S. 4D Imaging Radar Market is growing due to rising adoption of autonomous vehicles, advanced driver-assistance systems, strict safety regulations, technological advancements, and increased investments in smart mobility and intelligent transportation.
4D Imaging Radar Market Key Drivers:
-
Rising adoption of autonomous vehicles and advanced driver-assistance systems (ADAS) is driving significant growth of 4D imaging radar solutions worldwide.
The increasing adoption of autonomous vehicles and advanced driver-assistance systems (ADAS) is creating a strong need for high-resolution 4D imaging radar solutions. The emphasis on vehicle safety, as well as the increasing government regulations, is accelerating the adoption of radar solutions. The increasing accuracy, range, and detection capabilities of radar technology are improving the overall performance of the solutions. The increasing adoption of electric vehicles (EVs) and connected cars is creating a strong need for efficient radar solutions. The increasing investment in smart mobility and smart transportation infrastructure is also accelerating the adoption of the technology.
4D Imaging Radar Market Key Restraints:
-
High development and production costs, along with integration complexities and regulatory variations, are limiting widespread adoption of 4D imaging radar systems globally.
The high cost of developing and manufacturing 4D imaging radar systems can be a barrier to the adoption of this technology. The complexities involved in integrating the radar system with existing electronic and sensor system architectures can also be a barrier. The lack of skilled professionals for designing and implementing radar system technologies can also be a barrier to the adoption of this technology. Differences in regulations and standards for autonomous driving in different regions can also be a barrier. Electromagnetic interference and cybersecurity risks associated with connected cars can also be a barrier.
4D Imaging Radar Market Key Opportunities:
-
Integration of AI, machine learning, and sensor fusion technologies in 4D imaging radar systems is creating significant market expansion opportunities across automotive, industrial, and smart mobility applications.
Integration of AI, ML, and sensor fusion technologies in 4D imaging radar systems is generating new growth opportunities. Increasing application areas for autonomous trucks, drones, and industrial robots are new areas for growth. Enhancements to smart city infrastructure and smart traffic management systems are generating new areas for radar-based vehicle detection and monitoring. Ongoing innovations in compact and high-resolution radar sensors are opening new areas for growth in emerging automotive and mobility segments. New areas for growth are emerging through partnerships and collaborations between automotive OEMs and technology providers.
4D Imaging Radar Market Segments:
-
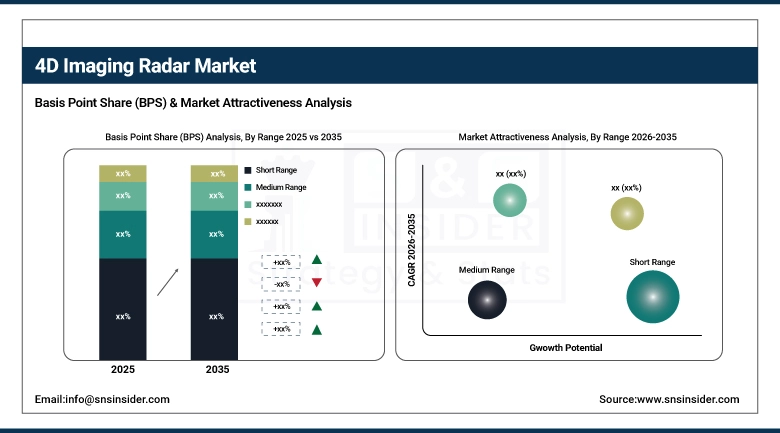
By Range: In 2025, Short Range dominated with 45% share; Long Range fastest growing segment during 2026–2035
-
By Application: In 2025, ADAS dominated with 50% share; Patient Diagnostics & Monitoring fastest growing segment during 2026–2035
-
By End-User: In 2025, Automotive dominated with 48% share; Healthcare fastest growing segment during 2026–2035
By Range, Short Range segment dominates the Market, Long Range segment expected to grow fastest
The market share for the Short Range segment is the largest in the 4D Imaging Radar Market in 2025. This is because this segment is used in various automotive applications for ADAS, including collision avoidance, blind-spot detection, and parking assistant. Short-range radar is cost-effective and easy to implement in vehicles, and it offers reliable results for detecting objects at closer ranges.
The Long Range segment is expected to show the highest growth rate in 2026-2035. This is because this segment is being used in autonomous vehicles, traffic management, and aerospace applications. Long-range radar offers better detection and safety features for vehicles, and this segment is essential for the development of autonomous vehicles.
By Application, ADAS segment dominates the Market, Patient Diagnostics & Monitoring segment expected to grow fastest
The ADAS segment accounted for the highest share of the 4D Imaging Radar Market in 2025. The segment is driven by the increasing need for driver assistance technology, collision avoidance technology, and autonomous driving technology. The need for accurate object detection in real-time and mapping of the surrounding environment is driving radar technology in automotive applications.
The Patient Diagnostics & Monitoring segment is expected to achieve high growth in the 2026-2035 forecast period. The segment is driven by healthcare applications such as patient monitoring, fall detection, and non-contact vital signs. The high accuracy of radar technology in healthcare applications is driving radar in healthcare settings.
By End-User, Automotive segment dominates the Market, Healthcare segment expected to grow fastest
The automotive segment holds the highest share in the 4D imaging radar market in 2025. This is due to the increased adoption of radar in passenger cars, trucks, and electric vehicles for safety and driving assistance features. Radar is widely used in modern cars for safety and driving assistance features. This has led to the adoption of radar by automakers to comply with safety regulations and to increase the performance of their cars.
The healthcare segment is estimated to have the highest CAGR in the forecast period of 2026-2035. This is due to the increased adoption of radar-based patient monitoring systems and hospital automation. The need for remote and non-contact healthcare has led to the adoption of radar-based wearable diagnostic devices.
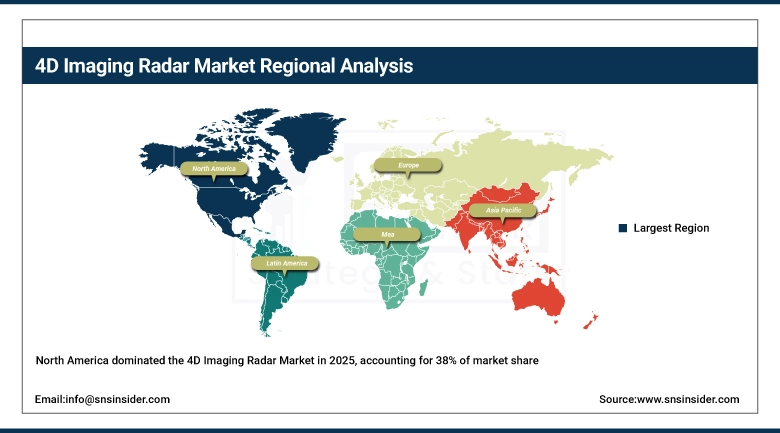
4D Imaging Radar Market Regional Analysis:
North America 4D Imaging Radar Market Insights:
North America has the highest market share in the 4D Imaging Radar Market in terms of revenue in the year 2025, i.e., about 38%. This region has key industry players in the automotive industry, defense sector, and technology companies that are heavily investing in autonomous driving and smart mobility. This region has high government spending in the defense and ITS industry and has advanced infrastructure for research and development.
Get Customized Report as per Your Business Requirement - Enquiry Now
Asia-Pacific 4D Imaging Radar Market Insights:
The highest CAGR of 23.1% is expected for Asia-Pacific during 2026–2035, driven by strong electric and autonomous vehicle uptake, rapid growth of smart city initiatives, and increasing industrial automation. However, countries such as China, Japan and, India are providing great investments in advanced radars for automotive safety, public surveillance, and, industrial robotics paving way for impressive growth in the region.
Europe 4D Imaging Radar Market Insights:
Europe's position in the 4D Imaging Radar Market is supported by the presence of leading automotive OEMs, defense manufacturers, and research institutions. Key market drivers include fuelling vehicle safety, strict emission regulations and increasing use of autonomous driving technologies, which sustains sustained radar deployments in automotive and industrial applications segments.
Latin America 4D Imaging Radar Market Insights:
The 4D Imaging Radar Market in Latin America is expected to grow at a healthy rate due to the increasing adoption of automotive safety systems, infrastructure upgrade initiatives, and industrial automation. Market growth is being aided by government incentives for vehicle safety technologies and smart mobility projects.
Middle East & Africa (MEA) 4D Imaging Radar Market Insights:
The region of MEA is witnessing steady growth in the 4D Imaging Radar Market, driven by the growth of defense modernization initiatives, industrial automation, and smart transportation. The investments made by the government and private sectors in surveillance, UAVs, and autonomous mobility are contributing to the growth of radar technologies.
4D Imaging Radar Market Competitive Landscape:
Arbe Robotics Ltd. a technology company building cutting-edge ultra-high-resolution 4D imaging radar chipsets and perception solutions for automotive, industrial and autonomous mobility applications. With its radar technology offering precise environmental imaging for ADAS and autonomous vehicles, the company is positioned to bring better object detection, situational awareness, and safety to vehicles in all condition. These autonomy capabilities range the spectrum from ADAS to full self-driving and are being adopted by OEMs and industrial partners around the world today.
-
2026: Arbe Robotics reports expansion of high-definition 4D imaging radar for off-highway and autonomous vehicle applications, securing serial-production orders with global OEMs and strengthening partnerships in defense and smart infrastructure markets.
Austin, Texas-based Uhnder, Inc. is developing fully digital 4D imaging radar-on-chip solutions for automotive and next-generation mobility applications. The firm says its Software defined digital architecture based Radar Tech features high resolution object detection, interference mitigation, and enhanced perception for ADAS and autonomous systems. Uhnder innovations are engineered to enhance safety, mitigate false positives, and empower automotive OEMs to deploy breakthrough radar sensing across broader market vehicles.
-
2026: Uhnder Inc. highlights adoption of fully software-defined 4D imaging radar-on-chip for ADAS and autonomous systems, enabling enhanced object detection, interference mitigation, and robust 4D environmental perception across automotive platforms.
4D Imaging Radar Companies are:
-
Uhnder
-
Oculii
-
Zendar
-
Aptiv
-
Texas Instruments
-
NXP
-
Analog Devices
-
Mistral Solutions
-
Echodyne
-
Bitsensing
-
Vayyar
-
Aeva
-
Ainstein
-
GhostWave
-
Steradian
-
RoboSense
-
Uhnder Automotive Radar
-
Retina AI Radar
| Report Attributes | Details |
|---|---|
| Market Size in 2025 | USD 2.89 Billion |
| Market Size by 2035 | USD 20.34 Billion |
| CAGR | CAGR of 21.54% From 2026 to 2035 |
| Base Year | 2025 |
| Forecast Period | 2026-2035 |
| Historical Data | 2022-2024 |
| Report Scope & Coverage | Market Size, Segments Analysis, Competitive Landscape, Regional Analysis, DROC & SWOT Analysis, Forecast Outlook |
| Key Segments | • By Range (Short Range, Medium Range, Long Range) • By Application (ADAS, Security & Surveillance, Patient Diagnostics & Monitoring) • By End-User (Automotive, Aerospace & Defense, Healthcare, Industrial) |
| Regional Analysis/Coverage | North America (US, Canada), Europe (Germany, UK, France, Italy, Spain, Russia, Poland, Rest of Europe), Asia Pacific (China, India, Japan, South Korea, Australia, ASEAN Countries, Rest of Asia Pacific), Middle East & Africa (UAE, Saudi Arabia, Qatar, South Africa, Rest of Middle East & Africa), Latin America (Brazil, Argentina, Mexico, Colombia, Rest of Latin America). |
| Company Profiles | Arbe Robotics, Uhnder, Oculii, Zendar, Aptiv, Texas Instruments, NXP, Analog Devices, Smartmicro, Mistral Solutions, Echodyne, Bitsensing, Vayyar, Aeva, Ainstein, GhostWave, Steradian, RoboSense, Uhnder Automotive Radar, and Retina AI Radar. |
Frequently Asked Questions
The Gas-insulated Switchgear Market is expected to grow at a CAGR of 21.54% during 2026-2035.
The 4D Imaging Radar Market size was valued at USD 2.89 Billion in 2025 and is projected to reach USD 20.34 Billion by 2035.
Increasing adoption of autonomous vehicles, ADAS, and smart mobility solutions is the major growth factor of the 4D Imaging Radar Market.
The Short Range segment dominated the 4D Imaging Radar Market in 2025.
North America region dominated the 4D Imaging Radar Market in 2025.
Get in Touch
