To get more information on Material Handling Equipment Market - Request Free Sample Report
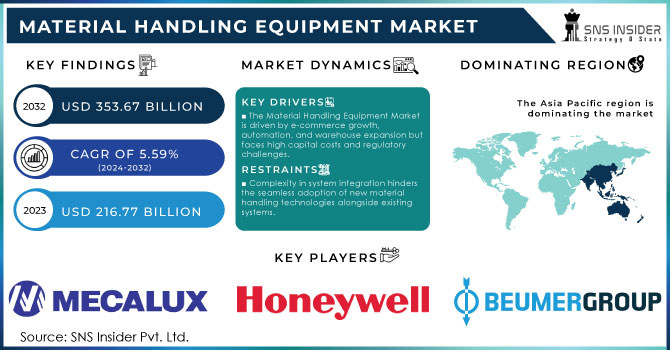
The Material Handling Equipment Market size was estimated at USD 216.77 Billion in 2023 and is expected to reach USD 353.67 Billion by 2032 at a CAGR of 5.59% during the forecast period of 2024-2032.
The robots have been adopted in the material handling sector, which has in turn, has altered the various operations and production processes. Several manufacturing facilities are using automated mobile robots in their production facilities to enhance productivity. Thus, the high usage of this equipment in the supply chain vertical will yield more profits to the delivery partners. Additionally, the industry will also respond once the demand for automation and usage of robots increases, which in turn, will increase the demand for more automated products.
Overall, as per firms’ private investment in industrial equipment and machinery, which is an indicator of the US economy, and thus, a healthy US economy will encourage activity in the other industries’ largest downstream markets. However, whether an increase in the investment in the industrial equipment and machinery upturn will stimulate and result in the expansion of demand and production of this product is yet to be seen. From the report, the market is expected to grow from factors like increased worker safety awareness, escalating demands for managing bulk materials, and industry 4.0 with the greater use of the Internet of Things. The market for this product will also have high demand because of the increased need to reduce downtime and the concern for enhancing supply chain efficiency. The Material Handling Equipment Market is being driven by the increased pace of adoption and the continuous technological developments in the market, which has led to the establishment of fully automated industrial facilities. Companies continue to modernize their production facilities and infrastructure to increase their production capacity.
Moreover, the e-commerce application segment is poised to witness substantial growth throughout the forecast period because of the increased adoption of shopping online mechanisms, large online retailers like Amazon, and the expansion of our logistics infrastructure. This means that several warehouse owners are investing in efficient material handling equipment to enhance the overall management of the supply chain.
In January 2023: Crown equipment corporation, expanded its product portfolio with Internal combustion and Electric counterbalance forklifts that can offer a carrying capacity up to 5.5 tons.
MARKET DYNAMICS
DRIVERS
The Material Handling Equipment Market is driven by e-commerce growth, automation, and warehouse expansion but faces high capital costs and regulatory challenges.
One of the most substantial drivers of the Material Handling Equipment Market is the exponential growth of e-commerce. Although only one decade ago, e-commerce has been a relatively limited market, it is now a global phenomenon that changes the behavior of consumers and forces the logistics industry to keep up with the pace. The need for fast and efficient supply chain operations contributes to the growing demand for advanced material handling systems. Specifically, the majority of the target systems, which include automated guided vehicles, conveyor systems, automated storage & retrieval systems, and warehouse robotics, serve the purpose of high-speed sorting, packing, and distributing large amounts of products. Moreover, the increasing frequency of omni-channel retail, where customers prefer that their online and offline shopping experiences with the same brand are smoothly integrated, adds to the complexity of logistics and requires more advanced material handling solutions.
Another factor that also contributes to that happening is that the most prominent e-commerce companies, such as Amazon, Alibaba, and Walmart, have been setting new standards for order fulfilment for all other businesses that want to remain competitive. Both the frequency and the speed of the order placement dictate that the warehouses work 24/7 and handle a great amount of goods, minimizing the time and resources spent on human intervention. In addition, the operation of these systems is connected with Warehouse Management Systems (WMS) and Warehouse Control Systems in order to improve accuracy, efficiency, and throughput.
The emphasis on worker safety and ergonomics drives the adoption of material handling equipment that reduces manual labor, minimizes injury risks, and enhances workplace efficiency.
The increasing emphasis on improving workplace safety and ergonomics is propelling the use of material handling equipment. In addition, the workplace manual handling of goods in warehouses or production floors often results in workplace injuries, which include musculoskeletal disorders. As companies have become more concerned about their workplace health and safety obligations, they have been investing in equipment that will significantly decrease the manual labor required and practically eliminate the risk generating injury.
Material handling systems include automated pallet jacks, lifting devices that reduce their ergonomic discomfort to workers, or robotic arms. These are designed to eliminate pressure on the physiques of the workers, resulting in a better and safer work environment. High level forklifts and pallet jacks that have been installed with sensors that will avoid collision with any objects in their proximity. Further, the robotic systems may handle parts that would have been impossible for human operators unassisted to lift. The result of using this machinery is not only safer workers but also better productivity. This is because tasks may be carried out more quickly, with fewer errors. Additionally, the integration of the ergonomic designs in the machinery ensures that the workers will operate the machinery at their comfort, minimizing the exhaustion of workers and exposure of workers to possible work injuries. Finally, the companies that have invested in material handling machines have detected that it significantly reduces their insurance costs and also that workers lose fewer workdays.
RESTRAIN
Complexity in system integration hinders the seamless adoption of new material handling technologies alongside existing systems.
Businesses often experience problems when they try to integrate the new material handling systems with the older technology they use. Many firms use both old equipment and new technologies, which are not always compatible. As a result, enterprises have to deal with some delays and additional costs while making sure that all the systems interact well and work efficiently at the same time.
In addition, the introduction of such tools and technologies as artificial intelligence, machine learning and the Internet of Things also requires extensive knowledge and preparations. Business owners need to hire employees who will work with this equipment; therefore, the operational costs increase as well.
Technological obsolescence poses a challenge as rapidly evolving innovations can quickly render material handling equipment outdated.
With the rapid technological evolution in the material handling sector, companies that invest in new equipment face the risk of experiencing technological obsolescence. Although a specific system is seen as cutting-edge at present, there are usually newer and more efficient types of systems in the consumer marketplace.
Therefore, firms may be discouraged from investing heavily in high-end material handling equipment because their acquisition could be considered as obsolete and lose their value relatively soon after implementation. Therefore, the need for continuous upgrading, and the possibilities that a firm’s rivals would adopt newer types of technologies, ultimately postpones some of these businesses’ decisions to make significant investments in material handling equipment.
By Product
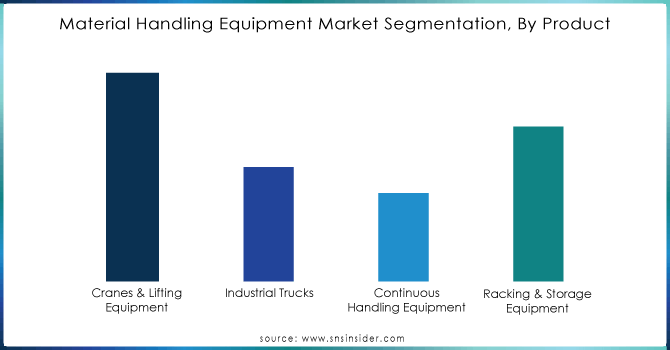
The cranes and lifting equipment segment dominated the market and accounted for over 38.2% share of the market revenue in 2023. Wide utilization in various end-use industries such as construction, manufacturing, motor vehicle lifts, and lifting accessories is anticipated to drive the market for material handling equipment. Continuous handling equipment assures smooth run picking, sorting, and packaging whereas traditional handling equipment is prone to picking errors.
Need any customization research on Material Handling Equipment Market - Enquiry Now
By Application
E-commerce segment led the market and accounted for over 32.6% share of the market revenue in 2023. Increased penetration of online shopping platforms, existence of large online merchants, and rising logistics infrastructure are expected to drive the demand for this product in the e-commerce industry. Several grocery stores have turned into convenience stores offering fast-food-like products such as frozen food, ready-to-eat products, and fresh items, thereby promoting the growth of the food industry.
KEY REGIONAL ANALYSIS
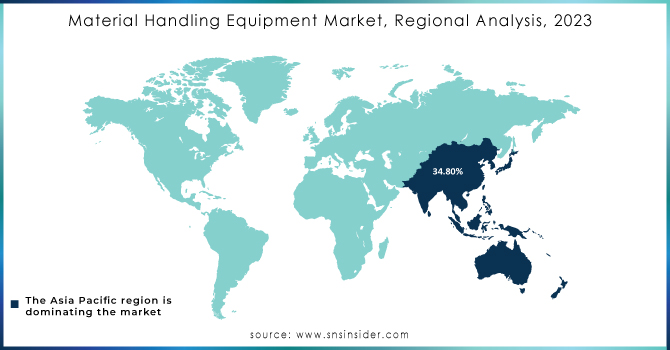
The Asia-Pacific is dominating the Material Handling Equipment Market in 2023, and the market share more than 34.8%. The growth of the Asian market is attributed to the robust economic progress of India, China, and certain countries within ASEAN, with cumulative development of the market in the Asia Pacific. The growing investment in infrastructure development to develop larger logistics parks and delivery centers supporting the e-commerce shoppers entail the market size in the forecast period. Furthermore, China is estimated to witness phenomenal growth, with the country’s potential as the manufacturing hub for the equipment industry. Also, the country holds the largest market share with the growing automotive and manufacturing facilities supported by construction activities across the country.
The major key players are BEUMER GROUP, Daifuku Co., Ltd., Honeywell International, Inc., KION GROUP AG, Mecalux, S.A, Murata Manufacturing Co.., Ltd., SSI SCHAEFER, Swisslog Holding AG, TOYOTA INDUSTRIES CORPORATION, Vanderlande Industries B.V., and others
In April 2023: Crown equipment corporation, a global manufacturer and supplier of material handling equipment has launched its newly developed SP1500 high level order pickers with pioneering features such as ergonomically developed operator compartment with customizable controls for quicker and safer order picking.
In March 2023: KION Group, a leader in the material handling equipment sector has made a strategic alliance with the Li-Cycle, a lithium-ion resource leader to strengthen their battery recycling and sustainability offerings position in the industry.
Report Attributes | Details |
---|---|
Market Size in 2023 | USD 216.77 Billion |
Market Size by 2032 | USD 353.67 Billion |
CAGR | CAGR of 5.59% From 2024 to 2032 |
Base Year | 2023 |
Forecast Period | 2024-2032 |
Historical Data | 2020-2022 |
Report Scope & Coverage | Market Size, Segments Analysis, Competitive Landscape, Regional Analysis, DROC & SWOT Analysis, Forecast Outlook |
Key Segments | • By Product(Cranes & Lifting Equipment, Industrial Trucks, Continuous Handling Equipment, Racking & Storage Equipment) • By Application (Automotive, Food & Beverages, Chemical, Semiconductor & Electronics, E-commerce, Aviation, Pharmaceutical, Others) |
Regional Analysis/Coverage | North America (US, Canada, Mexico), Europe (Eastern Europe [Poland, Romania, Hungary, Turkey, Rest of Eastern Europe] Western Europe] Germany, France, UK, Italy, Spain, Netherlands, Switzerland, Austria, Rest of Western Europe]), Asia Pacific (China, India, Japan, South Korea, Vietnam, Singapore, Australia, Rest of Asia Pacific), Middle East & Africa (Middle East [UAE, Egypt, Saudi Arabia, Qatar, Rest of Middle East], Africa [Nigeria, South Africa, Rest of Africa], Latin America (Brazil, Argentina, Colombia, Rest of Latin America) |
Company Profiles | BEUMER GROUP, Daifuku Co., Ltd., Honeywell International, Inc., KION GROUP AG, Mecalux, S.A, Murata Manufacturing Co., Ltd., SSI SCHAEFER, Swisslog Holding AG, TOYOTA INDUSTRIES CORPORATION, Vanderlande Industries B.V. |
Key Drivers | • The Material Handling Equipment Market is driven by e-commerce growth, automation, and warehouse expansion but faces high capital costs and regulatory challenges. • The emphasis on worker safety and ergonomics drives the adoption of material handling equipment that reduces manual labor, minimizes injury risks, and enhances workplace efficiency. |
RESTRAINTS | • Complexity in system integration hinders the seamless adoption of new material handling technologies alongside existing systems. • Technological obsolescence poses a challenge as rapidly evolving innovations can quickly render material handling equipment outdated. |
Ans: The Material Handling Equipment Market is expected to grow at a CAGR of 5.59%.
Ans: Material Handling Equipment Market size was USD 216.77 Billion in 2023 and is expected to Reach USD 353.67 Billion by 2032.
Ans: The Cranes & Lifting Equipment segmentation is the dominating segment by Product in the Material Handling Equipment Market.
Ans: The Material Handling Equipment Market is driven by e-commerce growth, automation, and warehouse expansion but faces high capital costs and regulatory challenges.
Ans: Asia-Pacific is the dominating region in the Material Handling Equipment Market.
Table of Content
1. Introduction
1.1 Market Definition
1.2 Scope (Inclusion and Exclusions)
1.3 Research Assumptions
2. Executive Summary
2.1 Market Overview
2.2 Regional Synopsis
2.3 Competitive Summary
3. Research Methodology
3.1 Top-Down Approach
3.2 Bottom-up Approach
3.3. Data Validation
3.4 Primary Interviews
4. Market Dynamics Impact Analysis
4.1 Market Driving Factors Analysis
4.1.2 Drivers
4.1.2 Restraints
4.1.3 Opportunities
4.1.4 Challenges
4.2 PESTLE Analysis
4.3 Porter’s Five Forces Model
5. Statistical Insights and Trends Reporting
5.1 Manufacturing Output, by Region, (2020-2023)
5.2 Utilization Rates, by Region, (2020-2023)
5.3 Maintenance and Downtime Metrix
5.4 Technological Adoption Rates, by Region
5.6 Export/Import Data, by Region (2023)
6. Competitive Landscape
6.1 List of Major Companies, By Region
6.2 Market Share Analysis, By Region
6.3 Product Benchmarking
6.3.1 Product specifications and features
6.3.2 Pricing
6.4 Strategic Initiatives
6.4.1 Marketing and promotional activities
6.4.2 Distribution and Supply Chain Strategies
6.4.3 Expansion plans and new product launches
6.4.4 Strategic partnerships and collaborations
6.5 Technological Advancements
6.6 Market Positioning and Branding
7. Material Handling Equipment Market Segmentation, By Product
7.1 Chapter Overview
7.2 Cranes & Lifting Equipment
7.2.1 Cranes & Lifting Equipment Market Trends Analysis (2020-2032)
7.2.2 Cranes & Lifting Equipment Market Size Estimates and Forecasts to 2032 (USD Billion)
7.3 Industrial Truck
7.3.1 Industrial Truck Market Trends Analysis (2020-2032)
7.3.2 Industrial Truck Market Size Estimates and Forecasts to 2032 (USD Billion)
7.4 Continuous Handling Equipment
7.4.1 Continuous Handling Equipment Trends Analysis (2020-2032)
7.4.2 Continuous Handling Equipment Size Estimates and Forecasts to 2032 (USD Billion)
7.5 Racking & Storage Equipment
7.4.1 Racking & Storage Equipment Trends Analysis (2020-2032)
7.4.2 Racking & Storage Equipment Market Size Estimates and Forecasts to 2032 (USD Billion)
8. Material Handling Equipment Market Segmentation, By Application
8.1 Chapter Overview
8.2 Automotive
8.2.1 Automotive Market Trends Analysis (2020-2032)
8.2.2 Automotive Market Size Estimates and Forecasts to 2032 (USD Billion)
8.3 Food & Beverages
8.3.1 Food & Beverages Market Trends Analysis (2020-2032)
8.3.2 Food & Beverages Market Size Estimates and Forecasts to 2032 (USD Billion)
8.4 Chemical
8.4.1 Chemical Market Trends Analysis (2020-2032)
8.4.2 Chemical Market Size Estimates and Forecasts to 2032 (USD Billion)
8.5 Semiconductor & Electronics
8.5.1 Semiconductor & Electronics Market Trends Analysis (2020-2032)
8.5.2 Semiconductor & Electronics Market Size Estimates and Forecasts to 2032 (USD Billion)
8.6 E-commerce
8.6.1 E-commerce Market Trends Analysis (2020-2032)
8.6.2 E-commerce Market Size Estimates and Forecasts to 2032 (USD Billion)
8.7 Aviation
8.7.1 Aviation Market Trends Analysis (2020-2032)
8.7.2 Aviation Market Size Estimates and Forecasts to 2032 (USD Billion)
8.8 Pharmaceutical
8.8.1 Pharmaceutical Market Trends Analysis (2020-2032)
8.8.2 Pharmaceutical Market Size Estimates and Forecasts to 2032 (USD Billion)
8.9 Others
8.9.1 Others Market Trends Analysis (2020-2032)
8.9.2 Others Market Size Estimates and Forecasts to 2032 (USD Billion)
9. Regional Analysis
9.1 Chapter Overview
9.2 North America
9.2.1 Trends Analysis
9.2.2 North America Material Handling Equipment Market Estimates and Forecasts, by Country (2020-2032) (USD Billion)
9.2.3 North America Material Handling Equipment Market Estimates and Forecasts, by Product (2020-2032) (USD Billion)
9.2.4 North America Material Handling Equipment Market Estimates and Forecasts, by Application (2020-2032) (USD Billion)
9.2.5 USA
9.2.5.1 USA Material Handling Equipment Market Estimates and Forecasts, by Product (2020-2032) (USD Billion)
9.2.5.2 USA Material Handling Equipment Market Estimates and Forecasts, by Application (2020-2032) (USD Billion)
9.2.6 Canada
9.2.6.1 Canada Material Handling Equipment Market Estimates and Forecasts, by Product (2020-2032) (USD Billion)
9.2.6.2 Canada Material Handling Equipment Market Estimates and Forecasts, by Application (2020-2032) (USD Billion)
9.2.7 Mexico
9.2.7.1 Mexico Material Handling Equipment Market Estimates and Forecasts, by Product (2020-2032) (USD Billion)
9.2.7.2 Mexico Material Handling Equipment Market Estimates and Forecasts, by Application (2020-2032) (USD Billion)
9.3 Europe
9.3.1 Eastern Europe
9.3.1.1 Trends Analysis
9.3.1.2 Eastern Europe Material Handling Equipment Market Estimates and Forecasts, by Country (2020-2032) (USD Billion)
9.3.1.3 Eastern Europe Material Handling Equipment Market Estimates and Forecasts, by Product (2020-2032) (USD Billion)
9.3.1.4 Eastern Europe Material Handling Equipment Market Estimates and Forecasts, by Application (2020-2032) (USD Billion)
9.3.1.5 Poland
9.3.1.5.1 Poland Material Handling Equipment Market Estimates and Forecasts, by Product (2020-2032) (USD Billion)
9.3.1.5.2 Poland Material Handling Equipment Market Estimates and Forecasts, by Application (2020-2032) (USD Billion)
9.3.1.6 Romania
9.3.1.6.1 Romania Material Handling Equipment Market Estimates and Forecasts, by Product (2020-2032) (USD Billion)
9.3.1.6.2 Romania Material Handling Equipment Market Estimates and Forecasts, by Application (2020-2032) (USD Billion)
9.3.1.7 Hungary
9.3.1.7.1 Hungary Material Handling Equipment Market Estimates and Forecasts, by Product (2020-2032) (USD Billion)
9.3.1.7.2 Hungary Material Handling Equipment Market Estimates and Forecasts, by Application (2020-2032) (USD Billion)
9.3.1.8 Turkey
9.3.1.8.1 Turkey Material Handling Equipment Market Estimates and Forecasts, by Product (2020-2032) (USD Billion)
9.3.1.8.2 Turkey Material Handling Equipment Market Estimates and Forecasts, by Application (2020-2032) (USD Billion)
9.3.1.9 Rest of Eastern Europe
9.3.1.9.1 Rest of Eastern Europe Material Handling Equipment Market Estimates and Forecasts, by Product (2020-2032) (USD Billion)
9.3.1.9.2 Rest of Eastern Europe Material Handling Equipment Market Estimates and Forecasts, by Application (2020-2032) (USD Billion)
9.3.2 Western Europe
9.3.2.1 Trends Analysis
9.3.2.2 Western Europe Material Handling Equipment Market Estimates and Forecasts, by Country (2020-2032) (USD Billion)
9.3.2.3 Western Europe Material Handling Equipment Market Estimates and Forecasts, by Product (2020-2032) (USD Billion)
9.3.2.4 Western Europe Material Handling Equipment Market Estimates and Forecasts, by Application (2020-2032) (USD Billion)
9.3.2.5 Germany
9.3.2.5.1 Germany Material Handling Equipment Market Estimates and Forecasts, by Product (2020-2032) (USD Billion)
9.3.2.5.2 Germany Material Handling Equipment Market Estimates and Forecasts, by Application (2020-2032) (USD Billion)
9.3.2.6 France
9.3.2.6.1 France Material Handling Equipment Market Estimates and Forecasts, by Product (2020-2032) (USD Billion)
9.3.2.6.2 France Material Handling Equipment Market Estimates and Forecasts, by Application (2020-2032) (USD Billion)
9.3.2.7 UK
9.3.2.7.1 UK Material Handling Equipment Market Estimates and Forecasts, by Product (2020-2032) (USD Billion)
9.3.2.7.2 UK Material Handling Equipment Market Estimates and Forecasts, by Application (2020-2032) (USD Billion)
9.3.2.8 Italy
9.3.2.8.1 Italy Material Handling Equipment Market Estimates and Forecasts, by Product (2020-2032) (USD Billion)
9.3.2.8.2 Italy Material Handling Equipment Market Estimates and Forecasts, by Application (2020-2032) (USD Billion)
9.3.2.9 Spain
9.3.2.9.1 Spain Material Handling Equipment Market Estimates and Forecasts, by Product (2020-2032) (USD Billion)
9.3.2.9.2 Spain Material Handling Equipment Market Estimates and Forecasts, by Application (2020-2032) (USD Billion)
9.3.2.10 Netherlands
9.3.2.10.1 Netherlands Material Handling Equipment Market Estimates and Forecasts, by Product (2020-2032) (USD Billion)
9.3.2.10.2 Netherlands Material Handling Equipment Market Estimates and Forecasts, by Application (2020-2032) (USD Billion)
9.3.2.11 Switzerland
9.3.2.11.1 Switzerland Material Handling Equipment Market Estimates and Forecasts, by Product (2020-2032) (USD Billion)
9.3.2.11.2 Switzerland Material Handling Equipment Market Estimates and Forecasts, by Application (2020-2032) (USD Billion)
9.3.2.12 Austria
9.3.2.12.1 Austria Material Handling Equipment Market Estimates and Forecasts, by Product (2020-2032) (USD Billion)
9.3.2.12.2 Austria Material Handling Equipment Market Estimates and Forecasts, by Application (2020-2032) (USD Billion)
9.3.2.13 Rest of Western Europe
9.3.2.13.1 Rest of Western Europe Material Handling Equipment Market Estimates and Forecasts, by Product (2020-2032) (USD Billion)
9.3.2.13.2 Rest of Western Europe Material Handling Equipment Market Estimates and Forecasts, by Application (2020-2032) (USD Billion)
9.4 Asia-Pacific
9.4.1 Trends Analysis
9.4.2 Asia-Pacific Material Handling Equipment Market Estimates and Forecasts, by Country (2020-2032) (USD Billion)
9.4.3 Asia-Pacific Material Handling Equipment Market Estimates and Forecasts, by Product (2020-2032) (USD Billion)
9.4.4 Asia-Pacific Material Handling Equipment Market Estimates and Forecasts, by Application (2020-2032) (USD Billion)
9.4.5 China
9.4.5.1 China Material Handling Equipment Market Estimates and Forecasts, by Product (2020-2032) (USD Billion)
9.4.5.2 China Material Handling Equipment Market Estimates and Forecasts, by Application (2020-2032) (USD Billion)
9.4.6 India
9.4.5.1 India Material Handling Equipment Market Estimates and Forecasts, by Product (2020-2032) (USD Billion)
9.4.5.2 India Material Handling Equipment Market Estimates and Forecasts, by Application (2020-2032) (USD Billion)
9.4.5 Japan
9.4.5.1 Japan Material Handling Equipment Market Estimates and Forecasts, by Product (2020-2032) (USD Billion)
9.4.5.2 Japan Material Handling Equipment Market Estimates and Forecasts, by Application (2020-2032) (USD Billion)
9.4.6 South Korea
9.4.6.1 South Korea Material Handling Equipment Market Estimates and Forecasts, by Product (2020-2032) (USD Billion)
9.4.6.2 South Korea Material Handling Equipment Market Estimates and Forecasts, by Application (2020-2032) (USD Billion)
9.4.7 Vietnam
9.4.7.1 Vietnam Material Handling Equipment Market Estimates and Forecasts, by Product (2020-2032) (USD Billion)
9.2.7.2 Vietnam Material Handling Equipment Market Estimates and Forecasts, by Application (2020-2032) (USD Billion)
9.4.8 Singapore
9.4.8.1 Singapore Material Handling Equipment Market Estimates and Forecasts, by Product (2020-2032) (USD Billion)
9.4.8.2 Singapore Material Handling Equipment Market Estimates and Forecasts, by Application (2020-2032) (USD Billion)
9.4.9 Australia
9.4.9.1 Australia Material Handling Equipment Market Estimates and Forecasts, by Product (2020-2032) (USD Billion)
9.4.9.2 Australia Material Handling Equipment Market Estimates and Forecasts, by Application (2020-2032) (USD Billion)
9.4.10 Rest of Asia Pacific
9.4.10.1 Rest of Asia Pacific Material Handling Equipment Market Estimates and Forecasts, by Product (2020-2032) (USD Billion)
9.4.10.2 Rest of Asia Pacific Material Handling Equipment Market Estimates and Forecasts, by Application (2020-2032) (USD Billion)
9.5 Middle East and Africa
9.5.1 Middle East
9.5.1.1 Trends Analysis
9.5.1.2 Middle East Material Handling Equipment Market Estimates and Forecasts, by Country (2020-2032) (USD Billion)
9.5.1.3 Middle East Material Handling Equipment Market Estimates and Forecasts, by Product (2020-2032) (USD Billion)
9.5.1.4 Middle East Material Handling Equipment Market Estimates and Forecasts, by Application (2020-2032) (USD Billion)
9.5.1.5 UAE
9.5.1.5.1 UAE Material Handling Equipment Market Estimates and Forecasts, by Product (2020-2032) (USD Billion)
9.5.1.5.2 UAE Material Handling Equipment Market Estimates and Forecasts, by Application (2020-2032) (USD Billion)
9.5.1.6 Egypt
9.5.1.6.1 Egypt Material Handling Equipment Market Estimates and Forecasts, by Product (2020-2032) (USD Billion)
9.5.1.6.2 Egypt Material Handling Equipment Market Estimates and Forecasts, by Application (2020-2032) (USD Billion)
9.5.1.7 Saudi Arabia
9.5.1.7.1 Saudi Arabia Material Handling Equipment Market Estimates and Forecasts, by Product (2020-2032) (USD Billion)
9.5.1.7.2 Saudi Arabia Material Handling Equipment Market Estimates and Forecasts, by Application (2020-2032) (USD Billion)
9.5.1.8 Qatar
9.5.1.8.1 Qatar Material Handling Equipment Market Estimates and Forecasts, by Product (2020-2032) (USD Billion)
9.5.1.8.2 Qatar Material Handling Equipment Market Estimates and Forecasts, by Application (2020-2032) (USD Billion)
9.5.1.9 Rest of Middle East
9.5.1.9.1 Rest of Middle East Material Handling Equipment Market Estimates and Forecasts, by Product (2020-2032) (USD Billion)
9.5.1.9.2 Rest of Middle East Material Handling Equipment Market Estimates and Forecasts, by Application (2020-2032) (USD Billion)
9.5.2 Africa
9.5.2.1 Trends Analysis
9.5.2.2 Africa Material Handling Equipment Market Estimates and Forecasts, by Country (2020-2032) (USD Billion)
9.5.2.3 Africa Material Handling Equipment Market Estimates and Forecasts, by Product (2020-2032) (USD Billion)
9.5.2.4 Africa Material Handling Equipment Market Estimates and Forecasts, by Application (2020-2032) (USD Billion)
9.5.2.5 South Africa
9.5.2.5.1 South Africa Material Handling Equipment Market Estimates and Forecasts, by Product (2020-2032) (USD Billion)
9.5.2.5.2 South Africa Material Handling Equipment Market Estimates and Forecasts, by Application (2020-2032) (USD Billion)
9.5.2.6 Nigeria
9.5.2.6.1 Nigeria Material Handling Equipment Market Estimates and Forecasts, by Product (2020-2032) (USD Billion)
9.5.2.6.2 Nigeria Material Handling Equipment Market Estimates and Forecasts, by Application (2020-2032) (USD Billion)
9.5.2.7 Rest of Africa
9.5.2.7.1 Rest of Africa Material Handling Equipment Market Estimates and Forecasts, by Product (2020-2032) (USD Billion)
9.5.2.7.2 Rest of Africa Material Handling Equipment Market Estimates and Forecasts, by Application (2020-2032) (USD Billion)
9.6 Latin America
9.6.1 Trends Analysis
9.6.2 Latin America Material Handling Equipment Market Estimates and Forecasts, by Country (2020-2032) (USD Billion)
9.6.3 Latin America Material Handling Equipment Market Estimates and Forecasts, by Product (2020-2032) (USD Billion)
9.6.4 Latin America Material Handling Equipment Market Estimates and Forecasts, by Application (2020-2032) (USD Billion)
9.6.5 Brazil
9.6.5.1 Brazil Material Handling Equipment Market Estimates and Forecasts, by Product (2020-2032) (USD Billion)
9.6.5.2 Brazil Material Handling Equipment Market Estimates and Forecasts, by Application (2020-2032) (USD Billion)
9.6.6 Argentina
9.6.6.1 Argentina Material Handling Equipment Market Estimates and Forecasts, by Product (2020-2032) (USD Billion)
9.6.6.2 Argentina Material Handling Equipment Market Estimates and Forecasts, by Application (2020-2032) (USD Billion)
9.6.7 Colombia
9.6.7.1 Colombia Material Handling Equipment Market Estimates and Forecasts, by Product (2020-2032) (USD Billion)
9.6.7.2 Colombia Material Handling Equipment Market Estimates and Forecasts, by Application (2020-2032) (USD Billion)
9.6.8 Rest of Latin America
9.6.8.1 Rest of Latin America Material Handling Equipment Market Estimates and Forecasts, by Product (2020-2032) (USD Billion)
9.6.8.2 Rest of Latin America Material Handling Equipment Market Estimates and Forecasts, by Application (2020-2032) (USD Billion)
10. Company Profiles
10.1 BEUMER GROUP
10.1.1 Company Overview
10.1.2 Financial
10.1.3 Products/ Services Offered
110.1.4 SWOT Analysis
10.2 Daifuku Co., Ltd.
10.2.1 Company Overview
10.2.2 Financial
10.2.3 Products/ Services Offered
10.2.4 SWOT Analysis
10.3 Honeywell International, Inc.
10.3.1 Company Overview
10.3.2 Financial
10.3.3 Products/ Services Offered
10.3.4 SWOT Analysis
10.4 KION GROUP AG
10.4.1 Company Overview
10.4.2 Financial
10.4.3 Products/ Services Offered
10.4.4 SWOT Analysis
10.5 Mecalux, S.A
10.5.1 Company Overview
10.5.2 Financial
10.5.3 Products/ Services Offered
10.5.4 SWOT Analysis
10.6 Murata Manufacturing Co., Ltd.
10.6.1 Company Overview
10.6.2 Financial
10.6.3 Products/ Services Offered
10.6.4 SWOT Analysis
10.7 SSI SCHAEFER
10.7.1 Company Overview
10.7.2 Financial
10.7.3 Products/ Services Offered
10.7.4 SWOT Analysis
10.8 Swisslog Holding AG
10.8.1 Company Overview
10.8.2 Financial
10.8.3 Products/ Services Offered
10.8.4 SWOT Analysis
10.9 TOYOTA INDUSTRIES CORPORATION
10.9.1 Company Overview
10.9.2 Financial
10.9.3 Products/ Services Offered
10.9.4 SWOT Analysis
10.10 Vanderlande Industries B.V.
10.9.1 Company Overview
10.9.2 Financial
10.9.3 Products/ Services Offered
10.9.4 SWOT Analysis
11. Use Cases and Best Practices
12. Conclusion
An accurate research report requires proper strategizing as well as implementation. There are multiple factors involved in the completion of good and accurate research report and selecting the best methodology to compete the research is the toughest part. Since the research reports we provide play a crucial role in any company’s decision-making process, therefore we at SNS Insider always believe that we should choose the best method which gives us results closer to reality. This allows us to reach at a stage wherein we can provide our clients best and accurate investment to output ratio.
Each report that we prepare takes a timeframe of 350-400 business hours for production. Starting from the selection of titles through a couple of in-depth brain storming session to the final QC process before uploading our titles on our website we dedicate around 350 working hours. The titles are selected based on their current market cap and the foreseen CAGR and growth.
The 5 steps process:
Step 1: Secondary Research:
Secondary Research or Desk Research is as the name suggests is a research process wherein, we collect data through the readily available information. In this process we use various paid and unpaid databases which our team has access to and gather data through the same. This includes examining of listed companies’ annual reports, Journals, SEC filling etc. Apart from this our team has access to various associations across the globe across different industries. Lastly, we have exchange relationships with various university as well as individual libraries.
Step 2: Primary Research
When we talk about primary research, it is a type of study in which the researchers collect relevant data samples directly, rather than relying on previously collected data. This type of research is focused on gaining content specific facts that can be sued to solve specific problems. Since the collected data is fresh and first hand therefore it makes the study more accurate and genuine.
We at SNS Insider have divided Primary Research into 2 parts.
Part 1 wherein we interview the KOLs of major players as well as the upcoming ones across various geographic regions. This allows us to have their view over the market scenario and acts as an important tool to come closer to the accurate market numbers. As many as 45 paid and unpaid primary interviews are taken from both the demand and supply side of the industry to make sure we land at an accurate judgement and analysis of the market.
This step involves the triangulation of data wherein our team analyses the interview transcripts, online survey responses and observation of on filed participants. The below mentioned chart should give a better understanding of the part 1 of the primary interview.
Part 2: In this part of primary research the data collected via secondary research and the part 1 of the primary research is validated with the interviews from individual consultants and subject matter experts.
Consultants are those set of people who have at least 12 years of experience and expertise within the industry whereas Subject Matter Experts are those with at least 15 years of experience behind their back within the same space. The data with the help of two main processes i.e., FGDs (Focused Group Discussions) and IDs (Individual Discussions). This gives us a 3rd party nonbiased primary view of the market scenario making it a more dependable one while collation of the data pointers.
Step 3: Data Bank Validation
Once all the information is collected via primary and secondary sources, we run that information for data validation. At our intelligence centre our research heads track a lot of information related to the market which includes the quarterly reports, the daily stock prices, and other relevant information. Our data bank server gets updated every fortnight and that is how the information which we collected using our primary and secondary information is revalidated in real time.
Step 4: QA/QC Process
After all the data collection and validation our team does a final level of quality check and quality assurance to get rid of any unwanted or undesired mistakes. This might include but not limited to getting rid of the any typos, duplication of numbers or missing of any important information. The people involved in this process include technical content writers, research heads and graphics people. Once this process is completed the title gets uploader on our platform for our clients to read it.
Step 5: Final QC/QA Process:
This is the last process and comes when the client has ordered the study. In this process a final QA/QC is done before the study is emailed to the client. Since we believe in giving our clients a good experience of our research studies, therefore, to make sure that we do not lack at our end in any way humanly possible we do a final round of quality check and then dispatch the study to the client.
Key Segments
By Product
Cranes & Lifting Equipment
Industrial Trucks
Continuous Handling Equipment
Racking & Storage Equipment
By Application
Automotive
Food & Beverages
Chemical
Semiconductor & Electronics
E-commerce
Aviation
Pharmaceutical
Others
Request for Segment Customization as per your Business Requirement: Segment Customization Request
Regional Coverage
North America
US
Canada
Mexico
Europe
Eastern Europe
Poland
Romania
Hungary
Turkey
Rest of Eastern Europe
Western Europe
Germany
France
UK
Italy
Spain
Netherlands
Switzerland
Austria
Rest of Western Europe
Asia Pacific
China
India
Japan
South Korea
Vietnam
Singapore
Australia
Rest of Asia Pacific
Middle East & Africa
Middle East
UAE
Egypt
Saudi Arabia
Qatar
Rest of the Middle East
Africa
Nigeria
South Africa
Rest of Africa
Latin America
Brazil
Argentina
Colombia
Rest of Latin America
Request for Country Level Research Report: Country Level Customization Request
Available Customization
With the given market data, SNS Insider offers customization as per the company’s specific needs. The following customization options are available for the report:
Product Analysis
Criss-Cross segment analysis (e.g. Product X Application)
Product Matrix which gives a detailed comparison of product portfolio of each company
Geographic Analysis
Additional countries in any of the regions
Company Information
Detailed analysis and profiling of additional market players (Up to five)
The Air Duct Market Share was valued at USD 9.67 Billion in 2023 & is now anticipated to grow to USD 13.83 Billion by 2031, with a CAGR of 4.58% by2024-2031.
Modular Robotics Market size was estimated at USD 10.51 billion in 2023 and is expected to reach USD 47.44 billion by 2032 at a CAGR of 18.23% during the forecast period of 2024-2032.
North America Electrostatic Precipitator Market size was estimated at $1.40 Bn in 2023 and will reach $2.10 Bn by 2032 at a CAGR of 4.62% by 2024-2032.
The Smart Pneumatic Market size was estimated at USD 3.42 billion in 2023 and is expected to reach USD 5.61 billion by 2031 at a CAGR of 6.36% during the forecast period of 2024-2031.
The Industrial Automation Market Size was valued at USD 182.1 Billion in 2023 and is expected to reach USD 377.9 Billion by 2032 and grow at a CAGR of 8.45% over the forecast period 2024-2032.
The Oil and Gas Accumulators Market Size was esteemed at USD 2450.5 million in 2023 and is supposed to arrive at USD 4241.9 million by 2031 and develop at a CAGR of 7.1% over the forecast period 2024-2031.
Hi! Click one of our member below to chat on Phone