image

Mercury Analyzer Market Report Scope & Overview:
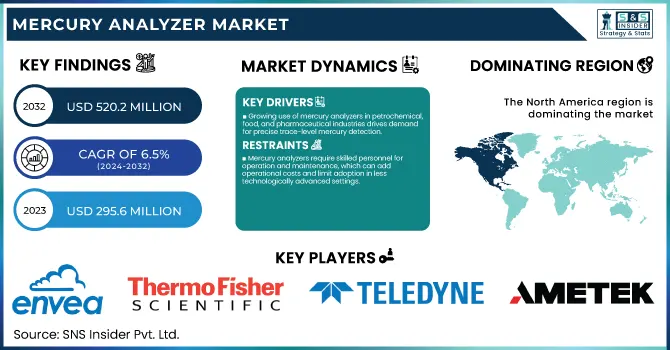
Mercury Analyzer Market Size was valued at USD 295.6 Million in 2023 and is expected to reach USD 520.2 Million by 2032, growing at a CAGR of 6.5% over the forecast period 2024-2032.

The mercury analyzer market is driven primarily by heightened regulatory enforcement on mercury emissions and contamination. Governments worldwide have intensified their focus on controlling mercury emissions due to its severe environmental and public health implications. According to the U.S. Environmental Protection Agency (EPA), mercury emissions have been linked to numerous health risks, particularly affecting the neurological development of fetuses and young children. In response, several governments have imposed stringent regulations on mercury emissions in industries such as mining, waste management, and power generation. For instance, the Minamata Convention on Mercury, adopted by 128 countries, mandates the monitoring and control of mercury emissions. Governments in Europe and North America are particularly proactive, leading the market in mercury analyzer adoption.

In Europe, the European Environmental Agency (EEA) reports a reduction in mercury emissions by nearly 40% since 2010, highlighting the demand for mercury analyzers in industrial applications. In Asia-Pacific, countries like China and India are also introducing emission limits due to rapid industrialization. China’s National Environmental Protection Standard enforces mercury emission thresholds across various industries, requiring companies to adopt mercury analyzers for compliance. This regulatory landscape is a key driver, pushing industries to adopt advanced mercury detection and analysis tools.

The global rise in industrialization has significantly increased mercury contamination, with mercury emissions now three to ten times higher than in the pre-industrial era, according to the U.S. National Institutes of Health. Mercury analyzers provide real-time air quality monitoring, detecting mercury vapor with high accuracy and efficiency, without requiring complex sample preparation. Widely used in petrochemical, oil, and gas sectors, these advanced systems effectively measure mercury levels in air, liquids, natural gas, and solids.

Market Dynamics

Drivers

  • Stringent global environmental regulations, especially around mercury emissions, are driving demand for mercury analyzers to help industries comply with safety standards, particularly in sectors like mining and coal power generation.

  • The increasing application of mercury analyzers in petrochemical, food, and pharmaceutical industries is boosting demand as these sectors need to ensure trace-level mercury detection for safety and quality control.

Globally, the implementation of stringent environmental regulations for the limitation of mercury emissions is one of the key drivers contributing to the growth in the mercury analyzer market. Mercury is one of the most highly toxic substances, and as such, it has a direct (negative) effect on human health and ecosystems that lead to government-enacted guidelines to monitor and mitigate its effects around the globe. Such as the Minamata Convention on Mercury, which has been signed by more than 130 countries since it was created in 2013 and requires signatories to reduce mercury emissions from sources such as coal-fired power plants, waste incineration, and mining. This convention alone has significantly increased demand for mercury analyzers, particularly in countries aiming to achieve compliance quickly​.

Tight controls on mercury emissions in North America and Europe mandate that companies should have to install a mercury analyzer. As an example, the U.S. Environmental Protection Agency (EPA) has established rules such as the Mercury and Air Toxics Standards (MATS) that mandate continuous monitoring of mercury emissions from power plants. As the EPA notes, these standards have resulted in more than an 85% reduction in mercury emissions from the power sector since 2011. Likewise in Europe, coal power plants are subject to the Industrial Emissions Directive (IED), thus forcing companies towards advanced mercury analysis technology. Such regulatory frameworks increase the adoption of mercury analyzers, as companies in affected industries must ensure their emissions are within permissible limits, creating steady demand in this market.

Restraints

  • The advanced technology in mercury analyzers makes them costly, posing a barrier for small and medium-sized enterprises in adopting these solutions despite regulatory pressures.

  • Mercury analyzers require skilled personnel for operation and maintenance, which can add operational costs and limit adoption in less technologically advanced settings.

The high cost of initial investment required for mercury analyzers is one major restraint in the mercury analyzer market. Due to the advanced detection needed for trace-level mercury analysis, it is common that mercury analyzers utilize complex technology that drives high accuracy. This complexity increases their manufacturing and purchasing costs and makes these analyzers a huge investment item for companies, particularly small or medium-sized enterprises. Additionally, to work properly these analyzers often need a specific calibration and require regular periodic maintenance which adds cost. Although regulations may compel industries to reduce mercury emissions, the cost hurdle can dissuade firms, particularly those with narrow margins or limited resource inputs. Consequently, the high cost can limit adoption rates, as companies might seek alternative, albeit less precise, methods for mercury detection to reduce expenditure.

Segmentation Analysis

By Type

Cold Vapor Atomic Absorption (CVAA) held the highest revenue share in the mercury analyzer market with 68% in 2023. CVAA is a universally used method with high sensitivity, low-cost performance, and reliable characteristics in wide applications to detect small concentrations of mercury. The preference for it over the years, across industries reflects its ability to deliver rapid and accurate results, essential for compliance with regulatory standards.

However, the fastest growing segment is Cold Vapor Atomic Fluorescence (CVAF) technology over the forecast period offering ultra-trace level detection for mercury and increasing demand for advanced mercury analytical methods. An increasing regulatory inclination for more accurate mercury measurement solutions is driving CVAF adoption, which offers a higher level of sensitivity and a wider range of detection. With increasing government incentives and grants targeting research in mercury detection technologies, the need for precise mercury analysis has gained momentum, benefiting market growth specifically towards its rapid expansion of CVAF.

By End Use

The environmental monitoring segment was the largest end-use segment, accounting for 28% of revenue in mercury analyzers in 2023. The adoption of newer technologies in manufacturing processes has further accelerated the growth of this segment, as governments globally focus on stringent environmental controls and monitoring provisions under the Minamata Convention on Mercury. The growing industries are investing in mercury analyzers for environmental monitoring to comply with regulatory compliance and avoid penalties.

On the other hand, the food industry segment is projected to register the highest CAGR during the forecast years. This growth is driven by rising mercury contamination issues in the food chain, especially seafood, where stringent regulation on mercury levels is applied. An increase in stringent mercury limits set forth by the U.S. Food and Drug Administration (FDA) and food safety authorities around the world is expected to propel demand for mercury analyzers in seafood, fuelling their market growth over a forecast period of time

Regional Analysis

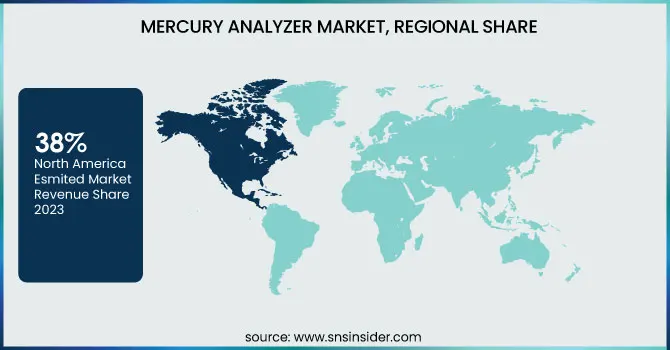
In 2023 North America dominated the mercury analyzer market and held 38% revenue share, owing to favorable regulations like the Clean Air Act operating in the United States that impose stringent regulations on mercury emissions. The strong sales in the market were from the coal-fired power plant and mining sector where regulation is heavy, thus the larger share of North America. The market in Europe was also substantial due to stringent rules on the environment and a proactive European Union.

On the other hand, Asia-Pacific is predicted to grow at the highest compound annual growth rate (CAGR) during the forecast period. Hence, the demand for mercury analyzers is being bolstered by rapid industrialization in economies such as China and India coupled with escalating regulatory pressure. Asia-Pacific is expected to capture a significant share of the mercury control market over the next few years due to various government programs on environmental sustainability and emission reduction, including the China National Action Plan on Mercury.

Recent Developments

  • In February 2024, Lumex Instruments introduced the Light 915M2 mercury analyzer, designed to provide accurate results on the measurement of atmospheric elemental mercury in ambient air and emissions monitoring or testing laboratory samples.

  • The landmark SM-5 Continuous Mercury Monitor from France's ENVEA was released worldwide in February 2023 for the highly accurate and reliable measurement of ultra-low mercury levels in flue gases with rapid response and wide dynamic range.

  • In August 2023, New mercury emission monitoring guidelines issued by the U.S. Department of Energy highlight the focus on deployable mercury analyzers for coal-fired power plants

Key Players

Key Service Providers/Manufacturers in the Mercury Analyzer Market:

  • ENVEA (France) – (SM-5 Continuous Mercury Monitor, Mercury Tracker 3000 XS)

  • Lumex Instruments (Russia) – (Light 915M2, RA-915M Mercury Analyzer)

  • Thermo Fisher Scientific (U.S.) – (Mercury Freedom System, HAAKE Viscotester IQ)

  • Teledyne Leeman Labs (U.S.) – (Hydra IIAA, QuickTrace M-7600)

  • PerkinElmer Inc. (U.S.) – (NexION ICP-MS, SMS 100 Mercury Analyzer)

  • Nippon Instruments Corporation (Japan) – (MA-3000, EMP-3)

  • Brooks Rand Instruments (U.S.) – (MERX-T, QuickTrace 7600)

  • Hitachi High-Tech Analytical Science (Japan) – (HM-3000, EA6000VX)

  • Analytik Jena AG (Germany) – (mercur DUO plus, ZEEnit 700 P)

  • AMETEK Inc. (U.S.) – (Model 919, Model 933)

Key Users of Mercury Analyzers:

  • ExxonMobil Corporation (U.S.)

  • Royal Dutch Shell plc (Netherlands)

  • BASF SE (Germany)

  • Chevron Corporation (U.S.)

  • ArcelorMittal (Luxembourg)

  • Anglo American plc (U.K.)

  • Rio Tinto Group (U.K.)

  • China National Petroleum Corporation (China)

  • Vale S.A. (Brazil)

  • Glencore plc (Switzerland)

Mercury Analyzers Market Report Scope:

Report Attributes Details
Market Size in 2023 USD 295.6 Million
Market Size by 2032 USD 520.2 Million
CAGR CAGR of 6.5% From 2024 to 2032
Base Year 2023
Forecast Period 2024-2032
Historical Data 2020-2022
Report Scope & Coverage Market Size, Segments Analysis, Competitive  Landscape, Regional Analysis, DROC & SWOT Analysis, Forecast Outlook
Key Segments • By Type (Cold Vapor Atomic Absorption (CVAA), Cold Vapor Atomic Fluorescence (CVAF))
• By End Use (Environmental Monitoring {Sample Types [Air, Water, Soil]}, Food Industry, Oil & Gas, Petrochemical, Healthcare, Others)
Regional Analysis/Coverage North America (US, Canada, Mexico), Europe (Eastern Europe [Poland, Romania, Hungary, Turkey, Rest of Eastern Europe] Western Europe] Germany, France, UK, Italy, Spain, Netherlands, Switzerland, Austria, Rest of Western Europe]), Asia Pacific (China, India, Japan, South Korea, Vietnam, Singapore, Australia, Rest of Asia Pacific), Middle East & Africa (Middle East [UAE, Egypt, Saudi Arabia, Qatar, Rest of Middle East], Africa [Nigeria, South Africa, Rest of Africa], Latin America (Brazil, Argentina, Colombia, Rest of Latin America)
Company Profiles ENVEA, Lumex Instruments, Thermo Fisher Scientific, Teledyne Leeman Labs, PerkinElmer Inc., Nippon Instruments Corporation, Brooks Rand Instruments, Hitachi High-Tech Analytical Science, Analytik Jena AG, AMETEK Inc.
Key Drivers • Stringent global environmental regulations, especially around mercury emissions, are driving demand for mercury analyzers to help industries comply with safety standards, particularly in sectors like mining and coal power generation.
• The increasing application of mercury analyzers in petrochemical, food, and pharmaceutical industries is boosting demand as these sectors need to ensure trace-level mercury detection for safety and quality control.
RESTRAINTS • The advanced technology in mercury analyzers makes them costly, posing a barrier for small and medium-sized enterprises in adopting these solutions despite regulatory pressures.

Frequently Asked Questions

Ans. The projected market size for the Mercury Analyzer Market is USD 520.2 Million by 2032.

Ans: The North American region dominated the Mercury Analyzer Market in 2023.

Ans. The CAGR of the Mercury Analyzer Market is 6.5% During the forecast period of 2024-2032.

And: The Cold Vapor Atomic Absorption (CVAA) type segment dominated the Mercury Analyzer Market in 2023.

Ans:  The key players in Mercury Analyzer market are ENVEA, Lumex Instruments, Thermo Fisher Scientific, Teledyne Leeman Labs, PerkinElmer Inc., Nippon Instruments Corporation, Brooks Rand Instruments, Hitachi High-Tech Analytical Science, Analytik Jena AG, AMETEK Inc. and others

Table of Content

1. Introduction

1.1 Market Definition

1.2 Scope (Inclusion and Exclusions)

1.3 Research Assumptions

2. Executive Summary

2.1 Market Overview

2.2 Regional Synopsis

2.3 Competitive Summary

3. Research Methodology

3.1 Top-Down Approach

3.2 Bottom-up Approach

3.3. Data Validation

3.4 Primary Interviews

4. Market Dynamics Impact Analysis

4.1 Market Driving Factors Analysis

4.1.2 Drivers

4.1.2 Restraints

4.1.3 Opportunities

4.1.4 Challenges

4.2 PESTLE Analysis

4.3 Porter’s Five Forces Model

5. Statistical Insights and Trends Reporting

5.1 Production Capacity and Utilization, by Country, by Type, 2023

5.2 Feedstock Prices, by Country, by Type, 2023

5.3 Regulatory Impact, by Country, by Type, 2023

5.4 Environmental Metrics: Emissions Data, Waste Management Practices, and Sustainability Initiatives, by Region

5.5 Innovation and R&D, by Type, 2023

6. Competitive Landscape

6.1 List of Major Companies, By Region

6.2 Market Share Analysis, By Region

6.3 Product Benchmarking

6.3.1 Product specifications and features

6.3.2 Pricing

6.4 Strategic Initiatives

6.4.1 Marketing and promotional activities

6.4.2 Distribution and supply chain strategies

6.4.3 Expansion plans and new product launches

6.4.4 Strategic partnerships and collaborations

6.5 Technological Advancements

6.6 Market Positioning and Branding

7. Mercury Analyzer Market Segmentation, By Type

7.1 Chapter Overview

7.2 Cold Vapor Atomic Absorption (CVAA)

7.2.1 Cold Vapor Atomic Absorption (CVAA) Market Trends Analysis (2020-2032)

7.2.2 Cold Vapor Atomic Absorption (CVAA) Market Size Estimates and Forecasts to 2032 (USD Million)

7.3 Cold Vapor Atomic Fluorescence (CVAF)

7.3.1 Cold Vapor Atomic Fluorescence (CVAF) Market Trends Analysis (2020-2032)

7.3.2 Cold Vapor Atomic Fluorescence (CVAF) Market Size Estimates and Forecasts to 2032 (USD Million)

8. Mercury Analyzer Market Segmentation, By End Use

8.1 Chapter Overview

8.2 Environmental Monitoring

8.2.1 Environmental Monitoring Market Trends Analysis (2020-2032)

8.2.2 Environmental Monitoring Market Size Estimates and Forecasts to 2032 (USD Million)

8.2.3 Sample Types

8.2.3.1 Sample Types Market Trends Analysis (2020-2032)

8.2.3.2 Sample Types Market Size Estimates and Forecasts to 2032 (USD Million)

8.2.3.3 Air

8.2.3.3.1 Air Market Trends Analysis (2020-2032)

8.2.3.3.2 Air Market Size Estimates and Forecasts to 2032 (USD Million)

8.2.3.4 Water

8.2.3.4.1 Water Market Trends Analysis (2020-2032)

8.2.3.4.2 Water Market Size Estimates and Forecasts to 2032 (USD Million)

8.2.3.5 Soil

8.2.3.5.1 Soil Market Trends Analysis (2020-2032)

8.2.3.5.2 Soil Market Size Estimates and Forecasts to 2032 (USD Million)

8.3 Food Industry

8.3.1 Food Industry Market Trends Analysis (2020-2032)

8.3.2 Food Industry Market Size Estimates and Forecasts to 2032 (USD Million)

8.4 Oil & Gas

8.4.1 Oil & Gas Market Trends Analysis (2020-2032)

8.4.2 Oil & Gas Market Size Estimates and Forecasts to 2032 (USD Million)

8.5 Petrochemical

8.5.1 Petrochemical Market Trends Analysis (2020-2032)

8.5.2 Petrochemical Market Size Estimates and Forecasts to 2032 (USD Million)

8.6 Healthcare

8.6.1 Healthcare Market Trends Analysis (2020-2032)

8.6.2 Healthcare Market Size Estimates and Forecasts to 2032 (USD Million)

8.7 Others

8.7.1 Others Market Trends Analysis (2020-2032)

8.7.2 Others Market Size Estimates and Forecasts to 2032 (USD Million)

9. Regional Analysis

9.1 Chapter Overview

9.2 North America

9.2.1 Trends Analysis

9.2.2 North America Mercury Analyzer Market Estimates and Forecasts, by Country (2020-2032) (USD Million)

9.2.3 North America Mercury Analyzer Market Estimates and Forecasts, By Type (2020-2032) (USD Million) 

9.2.4 North America Mercury Analyzer Market Estimates and Forecasts, By End Use (2020-2032) (USD Million)

9.2.5 USA

9.2.5.1 USA Mercury Analyzer Market Estimates and Forecasts, By Type (2020-2032) (USD Million)

9.2.5.2 USA Mercury Analyzer Market Estimates and Forecasts, By End Use (2020-2032) (USD Million)

9.2.6 Canada

9.2.6.1 Canada Mercury Analyzer Market Estimates and Forecasts, By Type (2020-2032) (USD Million)

9.2.6.2 Canada Mercury Analyzer Market Estimates and Forecasts, By End Use (2020-2032) (USD Million)

9.2.7 Mexico

9.2.7.1 Mexico Mercury Analyzer Market Estimates and Forecasts, By Type (2020-2032) (USD Million)

9.2.7.2 Mexico Mercury Analyzer Market Estimates and Forecasts, By End Use (2020-2032) (USD Million)

9.3 Europe

9.3.1 Eastern Europe

9.3.1.1 Trends Analysis

9.3.1.2 Eastern Europe Mercury Analyzer Market Estimates and Forecasts, by Country (2020-2032) (USD Million)

9.3.1.3 Eastern Europe Mercury Analyzer Market Estimates and Forecasts, By Type (2020-2032) (USD Million) 

9.3.1.4 Eastern Europe Mercury Analyzer Market Estimates and Forecasts, By End Use (2020-2032) (USD Million)

9.3.1.5 Poland

9.3.1.5.1 Poland Mercury Analyzer Market Estimates and Forecasts, By Type (2020-2032) (USD Million)

9.3.1.5.2 Poland Mercury Analyzer Market Estimates and Forecasts, By End Use (2020-2032) (USD Million)

9.3.1.6 Romania

9.3.1.6.1 Romania Mercury Analyzer Market Estimates and Forecasts, By Type (2020-2032) (USD Million)

9.3.1.6.2 Romania Mercury Analyzer Market Estimates and Forecasts, By End Use (2020-2032) (USD Million)

9.3.1.7 Hungary

9.3.1.7.1 Hungary Mercury Analyzer Market Estimates and Forecasts, By Type (2020-2032) (USD Million)

9.3.1.7.2 Hungary Mercury Analyzer Market Estimates and Forecasts, By End Use (2020-2032) (USD Million)

9.3.1.8 Turkey

9.3.1.8.1 Turkey Mercury Analyzer Market Estimates and Forecasts, By Type (2020-2032) (USD Million)

9.3.1.8.2 Turkey Mercury Analyzer Market Estimates and Forecasts, By End Use (2020-2032) (USD Million)

9.3.1.9 Rest of Eastern Europe

9.3.1.9.1 Rest of Eastern Europe Mercury Analyzer Market Estimates and Forecasts, By Type (2020-2032) (USD Million)

9.3.1.9.2 Rest of Eastern Europe Mercury Analyzer Market Estimates and Forecasts, By End Use (2020-2032) (USD Million)

9.3.2 Western Europe

9.3.2.1 Trends Analysis

9.3.2.2 Western Europe Mercury Analyzer Market Estimates and Forecasts, by Country (2020-2032) (USD Million)

9.3.2.3 Western Europe Mercury Analyzer Market Estimates and Forecasts, By Type (2020-2032) (USD Million) 

9.3.2.4 Western Europe Mercury Analyzer Market Estimates and Forecasts, By End Use (2020-2032) (USD Million)

9.3.2.5 Germany

9.3.2.5.1 Germany Mercury Analyzer Market Estimates and Forecasts, By Type (2020-2032) (USD Million)

9.3.2.5.2 Germany Mercury Analyzer Market Estimates and Forecasts, By End Use (2020-2032) (USD Million)

9.3.2.6 France

9.3.2.6.1 France Mercury Analyzer Market Estimates and Forecasts, By Type (2020-2032) (USD Million)

9.3.2.6.2 France Mercury Analyzer Market Estimates and Forecasts, By End Use (2020-2032) (USD Million)

9.3.2.7 UK

9.3.2.7.1 UK Mercury Analyzer Market Estimates and Forecasts, By Type (2020-2032) (USD Million)

9.3.2.7.2 UK Mercury Analyzer Market Estimates and Forecasts, By End Use (2020-2032) (USD Million)

9.3.2.8 Italy

9.3.2.8.1 Italy Mercury Analyzer Market Estimates and Forecasts, By Type (2020-2032) (USD Million)

9.3.2.8.2 Italy Mercury Analyzer Market Estimates and Forecasts, By End Use (2020-2032) (USD Million)

9.3.2.9 Spain

9.3.2.9.1 Spain Mercury Analyzer Market Estimates and Forecasts, By Type (2020-2032) (USD Million)

9.3.2.9.2 Spain Mercury Analyzer Market Estimates and Forecasts, By End Use (2020-2032) (USD Million)

9.3.2.10 Netherlands

9.3.2.10.1 Netherlands Mercury Analyzer Market Estimates and Forecasts, By Type (2020-2032) (USD Million)

9.3.2.10.2 Netherlands Mercury Analyzer Market Estimates and Forecasts, By End Use (2020-2032) (USD Million)

9.3.2.11 Switzerland

9.3.2.11.1 Switzerland Mercury Analyzer Market Estimates and Forecasts, By Type (2020-2032) (USD Million)

9.3.2.11.2 Switzerland Mercury Analyzer Market Estimates and Forecasts, By End Use (2020-2032) (USD Million)

9.3.2.12 Austria

9.3.2.12.1 Austria Mercury Analyzer Market Estimates and Forecasts, By Type (2020-2032) (USD Million)

9.3.2.12.2 Austria Mercury Analyzer Market Estimates and Forecasts, By End Use (2020-2032) (USD Million)

9.3.2.13 Rest of Western Europe

9.3.2.13.1 Rest of Western Europe Mercury Analyzer Market Estimates and Forecasts, By Type (2020-2032) (USD Million)

9.3.2.13.2 Rest of Western Europe Mercury Analyzer Market Estimates and Forecasts, By End Use (2020-2032) (USD Million)

9.4 Asia Pacific

9.4.1 Trends Analysis

9.4.2 Asia Pacific Mercury Analyzer Market Estimates and Forecasts, by Country (2020-2032) (USD Million)

9.4.3 Asia Pacific Mercury Analyzer Market Estimates and Forecasts, By Type (2020-2032) (USD Million) 

9.4.4 Asia Pacific Mercury Analyzer Market Estimates and Forecasts, By End Use (2020-2032) (USD Million)

9.4.5 China

9.4.5.1 China Mercury Analyzer Market Estimates and Forecasts, By Type (2020-2032) (USD Million)

9.4.5.2 China Mercury Analyzer Market Estimates and Forecasts, By End Use (2020-2032) (USD Million)

9.4.6 India

9.4.5.1 India Mercury Analyzer Market Estimates and Forecasts, By Type (2020-2032) (USD Million)

9.4.5.2 India Mercury Analyzer Market Estimates and Forecasts, By End Use (2020-2032) (USD Million)

9.4.5 Japan

9.4.5.1 Japan Mercury Analyzer Market Estimates and Forecasts, By Type (2020-2032) (USD Million)

9.4.5.2 Japan Mercury Analyzer Market Estimates and Forecasts, By End Use (2020-2032) (USD Million)

9.4.6 South Korea

9.4.6.1 South Korea Mercury Analyzer Market Estimates and Forecasts, By Type (2020-2032) (USD Million)

9.4.6.2 South Korea Mercury Analyzer Market Estimates and Forecasts, By End Use (2020-2032) (USD Million)

9.4.7 Vietnam

9.4.7.1 Vietnam Mercury Analyzer Market Estimates and Forecasts, By Type (2020-2032) (USD Million)

9.2.7.2 Vietnam Mercury Analyzer Market Estimates and Forecasts, By End Use (2020-2032) (USD Million)

9.4.8 Singapore

9.4.8.1 Singapore Mercury Analyzer Market Estimates and Forecasts, By Type (2020-2032) (USD Million)

9.4.8.2 Singapore Mercury Analyzer Market Estimates and Forecasts, By End Use (2020-2032) (USD Million)

9.4.9 Australia

9.4.9.1 Australia Mercury Analyzer Market Estimates and Forecasts, By Type (2020-2032) (USD Million)

9.4.9.2 Australia Mercury Analyzer Market Estimates and Forecasts, By End Use (2020-2032) (USD Million)

9.4.10 Rest of Asia Pacific

9.4.10.1 Rest of Asia Pacific Mercury Analyzer Market Estimates and Forecasts, By Type (2020-2032) (USD Million)

9.4.10.2 Rest of Asia Pacific Mercury Analyzer Market Estimates and Forecasts, By End Use (2020-2032) (USD Million)

9.5 Middle East and Africa

9.5.1 Middle East

9.5.1.1 Trends Analysis

9.5.1.2 Middle East Mercury Analyzer Market Estimates and Forecasts, by Country (2020-2032) (USD Million)

9.5.1.3 Middle East Mercury Analyzer Market Estimates and Forecasts, By Type (2020-2032) (USD Million) 

9.5.1.4 Middle East Mercury Analyzer Market Estimates and Forecasts, By End Use (2020-2032) (USD Million)

9.5.1.5 UAE

9.5.1.5.1 UAE Mercury Analyzer Market Estimates and Forecasts, By Type (2020-2032) (USD Million)

9.5.1.5.2 UAE Mercury Analyzer Market Estimates and Forecasts, By End Use (2020-2032) (USD Million)

9.5.1.6 Egypt

9.5.1.6.1 Egypt Mercury Analyzer Market Estimates and Forecasts, By Type (2020-2032) (USD Million)

9.5.1.6.2 Egypt Mercury Analyzer Market Estimates and Forecasts, By End Use (2020-2032) (USD Million)

9.5.1.7 Saudi Arabia

9.5.1.7.1 Saudi Arabia Mercury Analyzer Market Estimates and Forecasts, By Type (2020-2032) (USD Million)

9.5.1.7.2 Saudi Arabia Mercury Analyzer Market Estimates and Forecasts, By End Use (2020-2032) (USD Million)

9.5.1.8 Qatar

9.5.1.8.1 Qatar Mercury Analyzer Market Estimates and Forecasts, By Type (2020-2032) (USD Million)

9.5.1.8.2 Qatar Mercury Analyzer Market Estimates and Forecasts, By End Use (2020-2032) (USD Million)

9.5.1.9 Rest of Middle East

9.5.1.9.1 Rest of Middle East Mercury Analyzer Market Estimates and Forecasts, By Type (2020-2032) (USD Million)

9.5.1.9.2 Rest of Middle East Mercury Analyzer Market Estimates and Forecasts, By End Use (2020-2032) (USD Million)

9.5.2 Africa

9.5.2.1 Trends Analysis

9.5.2.2 Africa Mercury Analyzer Market Estimates and Forecasts, by Country (2020-2032) (USD Million)

9.5.2.3 Africa Mercury Analyzer Market Estimates and Forecasts, By Type (2020-2032) (USD Million) 

9.5.2.4 Africa Mercury Analyzer Market Estimates and Forecasts, By End Use (2020-2032) (USD Million)

9.5.2.5 South Africa

9.5.2.5.1 South Africa Mercury Analyzer Market Estimates and Forecasts, By Type (2020-2032) (USD Million)

9.5.2.5.2 South Africa Mercury Analyzer Market Estimates and Forecasts, By End Use (2020-2032) (USD Million)

9.5.2.6 Nigeria

9.5.2.6.1 Nigeria Mercury Analyzer Market Estimates and Forecasts, By Type (2020-2032) (USD Million)

9.5.2.6.2 Nigeria Mercury Analyzer Market Estimates and Forecasts, By End Use (2020-2032) (USD Million)

9.5.2.7 Rest of Africa

9.5.2.7.1 Rest of Africa Mercury Analyzer Market Estimates and Forecasts, By Type (2020-2032) (USD Million)

9.5.2.7.2 Rest of Africa Mercury Analyzer Market Estimates and Forecasts, By End Use (2020-2032) (USD Million)

9.6 Latin America

9.6.1 Trends Analysis

9.6.2 Latin America Mercury Analyzer Market Estimates and Forecasts, by Country (2020-2032) (USD Million)

9.6.3 Latin America Mercury Analyzer Market Estimates and Forecasts, By Type (2020-2032) (USD Million) 

9.6.4 Latin America Mercury Analyzer Market Estimates and Forecasts, By End Use (2020-2032) (USD Million)

9.6.5 Brazil

9.6.5.1 Brazil Mercury Analyzer Market Estimates and Forecasts, By Type (2020-2032) (USD Million)

9.6.5.2 Brazil Mercury Analyzer Market Estimates and Forecasts, By End Use (2020-2032) (USD Million)

9.6.6 Argentina

9.6.6.1 Argentina Mercury Analyzer Market Estimates and Forecasts, By Type (2020-2032) (USD Million)

9.6.6.2 Argentina Mercury Analyzer Market Estimates and Forecasts, By End Use (2020-2032) (USD Million)

9.6.7 Colombia

9.6.7.1 Colombia Mercury Analyzer Market Estimates and Forecasts, By Type (2020-2032) (USD Million)

9.6.7.2 Colombia Mercury Analyzer Market Estimates and Forecasts, By End Use (2020-2032) (USD Million)

9.6.8 Rest of Latin America

9.6.8.1 Rest of Latin America Mercury Analyzer Market Estimates and Forecasts, By Type (2020-2032) (USD Million)

9.6.8.2 Rest of Latin America Mercury Analyzer Market Estimates and Forecasts, By End Use (2020-2032) (USD Million)

10. Company Profiles

10.1 ENVEA

10.1.1 Company Overview

10.1.2 Financial

10.1.3 Products/ Services Offered

110.1.4 SWOT Analysis

10.2 Lumex Instruments

10.2.1 Company Overview

10.2.2 Financial

10.2.3 Products/ Services Offered

10.2.4 SWOT Analysis

10.3 Thermo Fisher Scientific

10.3.1 Company Overview

10.3.2 Financial

10.3.3 Products/ Services Offered

10.3.4 SWOT Analysis

10.4 Teledyne Leeman Labs

10.4.1 Company Overview

10.4.2 Financial

10.4.3 Products/ Services Offered

10.4.4 SWOT Analysis

10.5 PerkinElmer Inc.

10.5.1 Company Overview

10.5.2 Financial

10.5.3 Products/ Services Offered

10.5.4 SWOT Analysis

10.6 Nippon Instruments Corporation

10.6.1 Company Overview

10.6.2 Financial

10.6.3 Products/ Services Offered

10.6.4 SWOT Analysis

10.7 Brooks Rand Instruments

10.7.1 Company Overview

10.7.2 Financial

10.7.3 Products/ Services Offered

10.7.4 SWOT Analysis

10.8 Hitachi High-Tech Analytical Science

10.8.1 Company Overview

10.8.2 Financial

10.8.3 Products/ Services Offered

10.8.4 SWOT Analysis

10.9 Analytik Jena AG

10.9.1 Company Overview

10.9.2 Financial

10.9.3 Products/ Services Offered

10.9.4 SWOT Analysis

10.10 AMETEK Inc.

             10.9.1 Company Overview

10.9.2 Financial

10.9.3 Products/ Services Offered

10.9.4 SWOT Analysis

11. Use Cases and Best Practices

12. Conclusion

An accurate research report requires proper strategizing as well as implementation. There are multiple factors involved in the completion of good and accurate research report and selecting the best methodology to compete the research is the toughest part. Since the research reports we provide play a crucial role in any company’s decision-making process, therefore we at SNS Insider always believe that we should choose the best method which gives us results closer to reality. This allows us to reach at a stage wherein we can provide our clients best and accurate investment to output ratio.

Each report that we prepare takes a timeframe of 350-400 business hours for production. Starting from the selection of titles through a couple of in-depth brain storming session to the final QC process before uploading our titles on our website we dedicate around 350 working hours. The titles are selected based on their current market cap and the foreseen CAGR and growth.


The 5 steps process:

Step 1: Secondary Research:

Secondary Research or Desk Research is as the name suggests is a research process wherein, we collect data through the readily available information. In this process we use various paid and unpaid databases which our team has access to and gather data through the same. This includes examining of listed companies’ annual reports, Journals, SEC filling etc. Apart from this our team has access to various associations across the globe across different industries. Lastly, we have exchange relationships with various university as well as individual libraries.

Secondary Research

Step 2: Primary Research

When we talk about primary research, it is a type of study in which the researchers collect relevant data samples directly, rather than relying on previously collected data.  This type of research is focused on gaining content specific facts that can be sued to solve specific problems. Since the collected data is fresh and first hand therefore it makes the study more accurate and genuine.

We at SNS Insider have divided Primary Research into 2 parts.

Part 1 wherein we interview the KOLs of major players as well as the upcoming ones across various geographic regions. This allows us to have their view over the market scenario and acts as an important tool to come closer to the accurate market numbers. As many as 45 paid and unpaid primary interviews are taken from both the demand and supply side of the industry to make sure we land at an accurate judgement and analysis of the market.

This step involves the triangulation of data wherein our team analyses the interview transcripts, online survey responses and observation of on filed participants. The below mentioned chart should give a better understanding of the part 1 of the primary interview.

Primary Research

Part 2: In this part of primary research the data collected via secondary research and the part 1 of the primary research is validated with the interviews from individual consultants and subject matter experts.

Consultants are those set of people who have at least 12 years of experience and expertise within the industry whereas Subject Matter Experts are those with at least 15 years of experience behind their back within the same space. The data with the help of two main processes i.e., FGDs (Focused Group Discussions) and IDs (Individual Discussions). This gives us a 3rd party nonbiased primary view of the market scenario making it a more dependable one while collation of the data pointers.

Step 3: Data Bank Validation

Once all the information is collected via primary and secondary sources, we run that information for data validation. At our intelligence centre our research heads track a lot of information related to the market which includes the quarterly reports, the daily stock prices, and other relevant information. Our data bank server gets updated every fortnight and that is how the information which we collected using our primary and secondary information is revalidated in real time.

Data Bank Validation

Step 4: QA/QC Process

After all the data collection and validation our team does a final level of quality check and quality assurance to get rid of any unwanted or undesired mistakes. This might include but not limited to getting rid of the any typos, duplication of numbers or missing of any important information. The people involved in this process include technical content writers, research heads and graphics people. Once this process is completed the title gets uploader on our platform for our clients to read it.

Step 5: Final QC/QA Process:

This is the last process and comes when the client has ordered the study. In this process a final QA/QC is done before the study is emailed to the client. Since we believe in giving our clients a good experience of our research studies, therefore, to make sure that we do not lack at our end in any way humanly possible we do a final round of quality check and then dispatch the study to the client.

Key Segments:

By Type

  • Cold Vapor Atomic Absorption (CVAA)

  • Cold Vapor Atomic Fluorescence (CVAF)

By End Use

  • Environmental Monitoring

    • Sample Types

      • Air

      • Water

      • Soil

  • Food Industry

  • Oil & Gas

  • Petrochemical

  • Healthcare

  • Others

Request for Segment Customization as per your Business Requirement: Segment Customization Request

REGIONAL COVERAGE:

North America

  • US

  • Canada

  • Mexico

Europe

  • Eastern Europe

    • Poland

    • Romania

    • Hungary

    • Turkey

    • Rest of Eastern Europe

  • Western Europe

    • Germany

    • France

    • UK

    • Italy

    • Spain

    • Netherlands

    • Switzerland

    • Austria

    • Rest of Western Europe

Asia Pacific

  • China

  • India

  • Japan

  • South Korea

  • Vietnam

  • Singapore

  • Australia

  • Rest of Asia Pacific

Middle East & Africa

  • Middle East

    • UAE

    • Egypt

    • Saudi Arabia

    • Qatar

    • Rest of the Middle East

  • Africa

    • Nigeria

    • South Africa

    • Rest of Africa

Latin America

  • Brazil

  • Argentina

  • Colombia

  • Rest of Latin America

Request for Country Level Research Report: Country Level Customization Request

Available Customization

With the given market data, SNS Insider offers customization as per the company’s specific needs. The following customization options are available for the report:

  • Product Analysis

  • Criss-Cross segment analysis (e.g. Product X Application)

  • Product Matrix which gives a detailed comparison of product portfolio of each company

  • Geographic Analysis

  • Additional countries in any of the regions

  • Company Information

  • Detailed analysis and profiling of additional market players (Up to five)


  •            5000 (33% Discount)


  •            8950 (40% Discount)


  •            3050 (23% Discount)

Start a Conversation

Hi! Click one of our member below to chat on Phone