Metaverse in Gaming Market Size & Overview:
Get More Information on Metaverse in Gaming Market - Request Sample Report
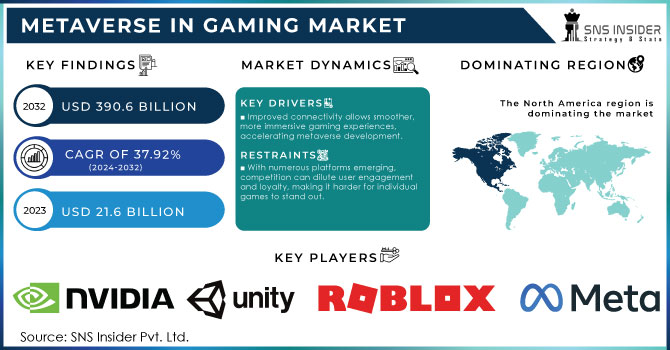
The Metaverse in Gaming Market Size was valued at USD 21.6 billion in 2023 and is expected to reach USD 390.6 Billion by 2032, growing at a CAGR of 37.92% from 2024-2032.
The Metaverse in the Gaming market is snowballing, driven by advancements in virtual reality (VR), augmented reality (AR), and block chain technology, which are creating immersive experiences that blend the digital and physical worlds. The concept of the metaverse—virtual environments where users interact as avatars—has gained momentum in gaming thanks to technological innovations and increasing consumer demand for highly interactive, social gaming experiences. Companies such as Epic Games (with Fortnite), Meta Platforms (with Horizon Worlds), and Roblox Corporation are at the forefront of this movement, developing expansive virtual ecosystems.
A major growth factor is the increasing demand for virtual goods and skins. In 2023, digital item sales in games like Fortnite and Roblox exceeded $20 billion, showcasing the strong potential of virtual economies. Blockchain technology also plays a unique role by enabling true ownership of digital assets through NFTs. A notable example is Axie Infinity, where players can buy, sell, and trade NFT-based creatures, with transactions surpassing $4 billion in 2021. The social component of gaming is another key driver, as metaverse platforms increasingly focus on community-building. For instance, Fortnite has hosted live virtual concerts featuring artists like Travis Scott and Ariana Grande, attracting over 12 million concurrent viewers during some events. These events blur the line between gaming and entertainment, drawing in a broader audience beyond gamers.
The rise of AR and VR technologies is also pivotal to the growth of this market. In 2023, global VR gaming revenue surpassed $3.8 billion, with devices like Meta’s Quest headsets becoming more affordable and accessible, leading to deeper immersion and making the metaverse more reachable for everyday players. Looking forward, as internet speeds improve and 5G networks expand, the market is expected to keep growing, allowing for more seamless, advanced virtual worlds and enhancing the overall metaverse gaming experience.
| Impact Area | Description | Example/Statistics |
|
Immersive Entertainment |
Blending of entertainment and gaming through live events in virtual spaces. |
Fortnite concerts featuring artists like Ariana Grande attracted over 12 million concurrent viewers. |
|
AR/VR Integration |
Enhanced immersion through advanced AR and VR technologies. |
VR gaming revenue hit USD 3.8 billion globally in 2023, driven by the increasing affordability of headsets like Meta’s Quest. |
|
Community Building |
Strengthening online communities with shared, persistent virtual worlds. |
Metaverse games are fostering large, loyal communities, with Fortnite and Roblox organizing regular in-game events. |
|
Monetization Opportunities |
Increased revenue streams through in-game purchases, ads, and events. |
Developers and brands generate significant income from in-game ads, product placements, and sponsorships within the metaverse. |
|
Gaming as a Service (GaaS) |
Transition to service-based models where games evolve through updates and DLCs. |
Subscription-based services like Roblox Premium offer exclusive in-game perks and enhance long-term user engagement. |
Metaverse in Gaming Market Dynamics
Drivers
-
Improved connectivity allows smoother, more immersive gaming experiences, accelerating metaverse development.
-
Virtual concerts and events on platforms like Fortnite attract millions, blending gaming with entertainment.
-
Companies collaborate with game developers for in-game marketing, opening new revenue streams within virtual worlds.
In the Metaverse in Gaming market, companies are increasingly collaborating with game developers to leverage in-game marketing, opening up new revenue opportunities. Brands integrate their products and services seamlessly into virtual gaming environments, offering immersive and interactive ads that enhance the player experience without causing disruption. For instance, Nike partnered with Roblox to launch "NIKELAND," a virtual space where users can explore Nike products, play games, and dress their avatars in branded apparel. This effort not only elevated Nike's brand visibility but also engaged a younger, tech-savvy audience directly. By 2022, Roblox reported that NIKELAND had attracted over 7 million visitors in just a few months.
In 2023, Gucci collaborated with Roblox to create a virtual experience called "Gucci Town," where players can explore various themed areas, participate in mini-games, and purchase exclusive Gucci-themed virtual items. This partnership not only enhanced Gucci's presence in the gaming community but also attracted a younger audience interested in luxury fashion. These partnerships give brands access to growing virtual economies while providing players with more immersive experiences. By entering the metaverse, companies unlock new revenue streams and enrich gameplay with creative branded content. As the metaverse continues to grow, such collaborations are likely to expand, offering even more dynamic opportunities for in-game marketing.
The most notable trend in the metaverse within the Gaming market is the rise of virtual concerts and events, particularly on platforms such as Fortnite. This concept redefine not only the connection between gaming and entertainment, but also attracts millions of gaming enthusiasts, willing to participate in the event. The players can interact with their favor artist in ways that would not typically be available to them. For example, the company has hosted live shows with Travis Scott and Ariana Grande, which attracted over 12 million concurrent players to watch the show. The virtual concerts combined exceptional visuals and performances that one may typically expect from the live show, with the entire context of the game. This allowed them to achieve some goals just as they would during a standard gaming night out.
The virtual event serves as an excellent marketing tool, benefiting not just the concert but also the game itself. It went great on social media and news platforms. Additionally, many young people could get interested in the experience, as the younger demographic tends to be more engaged in digital activities. In the metaverse, such events can bring plenty of opportunities for players, along with continuous development of revenue streams, in the form of in-game purchases, goods, or sponsors. As such, it is expected that in the future, more events for fans, as well as marketing events in general, will be happening over the metaverse.
Restraints
-
With numerous platforms emerging, competition can dilute user engagement and loyalty, making it harder for individual games to stand out.
-
Some players may find it difficult to adapt to new technologies and virtual experiences, limiting the potential user base.
-
Prolonged use of VR and AR technologies can lead to physical discomfort or health concerns, which might deter players from participating.
Continuous use of virtual reality and augmented reality technologies in the Metaverse Gaming market can cause many physical discomfort and health issues, which can restrict players to participate in games. Gamers try to play games for a long time, which cause eye strain, headache, motion sickness, fatigue and others. As the features of virtual components interfere with movements of games, users cannot keep up with the motion of the virtual world which cause their sicknesses. Hence, using VR headsets for a long-time causes “VR sickness”, a kind of disorientation similar to motion sickness, feeling of nausea and dizziness.
Moreover, utilizing AR devices also for long periods may result in eye strain because of the continuous focus on the digital overlays which cause fatigue in the eye. Besides that, the repetitive movements as require in most VR games can further lead to muscle strain and general discomfort in gamers.
| Health Concern | Description | Example |
|
Eye Strain |
Discomfort caused by prolonged screen exposure. |
Players experiencing blurred vision after long sessions. |
|
Motion Sickness |
Dizziness and nausea from disconnect between movements and visuals. |
Users feeling queasy during fast-paced VR games. |
|
Headaches |
Tension headaches resulting from headset use. |
Gamers developing headaches after extended playtime. |
|
Fatigue |
General tiredness due to immersive gaming sessions. |
Players reporting exhaustion after lengthy VR experiences. |
Metaverse in Gaming Market Segmentation Overview
By Component
In 2023, the hardware segment dominated the market with more than 45.2% of the revenue share. The category includes VR, AR, and MR headsets, displays, and other tools. The growth of this segment is caused by an increasing demand for the AR and VR technologies. These tools are used to engage gamers by providing them with the authentic, immersive and real-like experience of metaverse gaming. The tools are standard in gaming and other applications. However, as a result of their becoming more affordable, accessible, and demanded among a wider range of gamers, their segment grows at a high pace and is to expand in the nearest future as well.
Services segment is expected to grow at the fastest CAGR during the forecast period. The rise is to be caused by increasing demand for different metaverse services, such as game and digital asset development and design. Moreover, some of the services are to meet the needs of the virtual real-estate. Many investors and other individuals decided to buy digital property on different platforms and increased the demand for the development and management of this property too.
By Technology
In 2023, the Augmented Reality (AR) and Virtual Reality (VR) segment dominated the market amd represented over 41.8% of revenue share. The primary driver of the Augmented Reality AR and Virtual Reality VR technology segment in the market is social interactions taking place in the metaverse. These fundamental capabilities for players to connect to each other through avatars and interact socially is increasing the sense of community that is crucial for the metaverse to grow.
The Artificial Intelligence AI technology segment is expected to experience the fastest CAGR growth during the forecast period. The reason is the technology being used to analyze player behavior and provide personalized content recommendations, allowing people to further customize their metaverse experience. Moreover, AI is used in Natural Language Processing NLP to improve the quality and versatility of interactions with virtual characters and assistants that drive the social and narrative aspect of the market.
By Genre
In 2023, the adventure genre segment dominated the market, generating more than 32.5% of total revenue. This genre made such significant strides due to the exciting and engaging experience it provides to users. Functioning within the metaverse, adventure games submerge players into rich, comprehensive realities where they explore, solve puzzles, and communicate with Non-Player Characters and other users. Moreover, users frequently have the choice of decisions made by the game’s plot and explore it at a speed that is convenient to them. Therefore, the overall virtual adventure proves so appealing to users across the world.
Sandbox genre segment is expected to grow at fastest CAGR during the forecast period. The fact that the identified software allows players to use unrestricted spaces to create any form of content, shape the functionality of games, and interact with other users matches the concept of the metaverse. The identified similarity will strengthen the position of the identified genre, and substantial progress is expected to be observed over the next years in the specified segment.
Metaverse in Gaming Market Regional Analysis
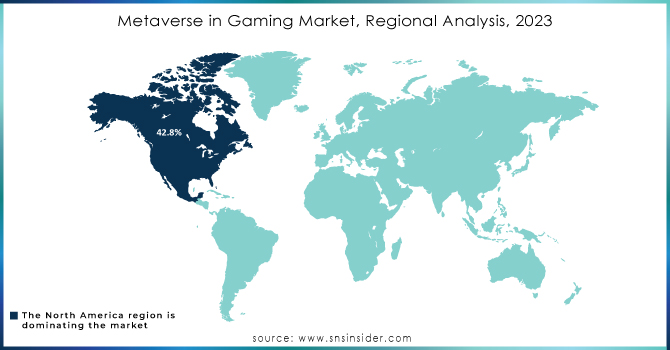
In 2023, the North America market captured the largest revenue share, around 42.8%. This substantial share is largely due to the presence of major players who actively collaborate and form partnerships to innovate their offerings while consistently adopting advanced technologies to solidify their position in the region. Notably, in April 2022, Epic Games, Inc. raised USD 2 billion in funding from Sony Group Corporation and Kirkbi, the parent company of the Lego Group. This investment aims to shape the future of the metaverse by ensuring a safe and enjoyable environment for children and creating an immersive digital playground for kids to engage in play.
Meanwhile, the Asia Pacific region is expected to grow at the highest CAGR during the forecast period. The surge of Esports in this region has laid a strong foundation for the metaverse, providing new opportunities for competitive and immersive gaming experiences. Local gaming giants, along with major global players, are expanding their presence, driving both innovation and investment in metaverse development.
Do You Need any Customization Research on Metaverse in Gaming Market - Enquire Now
Key Players in Metaverse in Gaming Market
The major key players are
-
Meta Platforms, Inc. - Oculus VR
-
Epic Games, Inc. - Unreal Engine
-
Roblox Corporation - Roblox Studio
-
Unity Technologies, Inc. - Unity Engine
-
Microsoft Corporation - HoloLens
-
NVIDIA Corporation - GeForce GPUs
-
Sony Group Corporation - PlayStation VR
-
Tencent Holdings Limited - WeGame
-
Valve Corporation - Steam VR
-
Niantic, Inc. - ARCore
-
Decentraland - Decentraland Marketplace
-
The Sandbox - VoxEdit
-
Hadean Supercomputing Ltd. - Hadean Engine
-
Activision Blizzard, Inc. - Call of Duty Franchise
-
Electronic Arts Inc. - EA Sports
-
Square Enix Holdings Co., Ltd. - Final Fantasy Franchise
-
Ubisoft Entertainment S.A. - Assassin's Creed Franchise
-
Take-Two Interactive Software, Inc. - Grand Theft Auto Franchise
-
Crytek GmbH - CryEngine
-
Paradox Interactive AB - Paradox Development Studio
Users
-
Horizon Worlds
-
Fortnite
-
Adopt Me!
-
Hollow Knight
-
Minecraft
-
NVIDIA Omniverse
-
Beat Saber (PlayStation VR)
-
Honor of Kings
-
Half-Life: Alyx
-
Pokémon GO
-
Genesis City
-
SAND Token
-
Hadean Engine
-
Call of Duty: Warzone
-
The Sims
-
Final Fantasy XIV
-
Assassin's Creed Valhalla
-
Grand Theft Auto V
-
Crysis
-
Cities: Skylines
Recent Developments
In April 2023, Electronic Arts unveiled EA SPORTS FC, marking a new brand identity, vision, and logo. This platform is designed to create, innovate, and enhance football experiences, bringing together hundreds of millions of fans across console, mobile, online, and esports products.
In March 2023, Epic Games released Unreal Editor for Fortnite (UEFN), a version of the Unreal Editor that allows users to create and publish experiences directly within Fortnite.
| Report Attributes | Details |
| Market Size in 2024 | USD 21.6 billion |
| Market Size by 2032 | USD 390.6 Billion |
| CAGR | CAGR of 37.92% From 2024 to 2032 |
| Base Year | 2024 |
| Forecast Period | 2024-2032 |
| Historical Data | 2020-2022 |
| Report Scope & Coverage | Market Size, Segments Analysis, Competitive Landscape, Regional Analysis, DROC & SWOT Analysis, Forecast Outlook |
| Key Segments | • By Component (Hardware, Software, Services) • By Technology (AR, VR, MR Technologies, Blockchain, Artificial Intelligence (AI), Others), • By Genre (Action, Adventure, Role-playing Games (RPGs), Simulation, Sports and Racing, Strategy, Sandbox, Card and Casino Games, Others) |
| Regional Analysis/Coverage | North America (US, Canada, Mexico), Europe (Eastern Europe [Poland, Romania, Hungary, Turkey, Rest of Eastern Europe] Western Europe [Germany, France, UK, Italy, Spain, Netherlands, Switzerland, Austria, Rest of Western Europe]). Asia Pacific (China, India, Japan, South Korea, Vietnam, Singapore, Australia, Rest of Asia Pacific), Middle East & Africa (Middle East [UAE, Egypt, Saudi Arabia, Qatar, Rest of Middle East], Africa [Nigeria, South Africa, Rest of Africa], Latin America (Brazil, Argentina, Colombia Rest of Latin America) |
| Company Profiles |
Meta Platforms, Inc. (formerly Facebook, Inc.), Epic Games, Inc., Roblox Corporation, Unity Technologies, Inc., Microsoft Corporation, NVIDIA Corporation, Sony Group Corporation, Tencent Holdings Limited, Valve Corporation, Niantic, Inc., Decentraland, The Sandbox, Hadean Supercomputing Ltd., Activision Blizzard, Inc., Electronic Arts Inc., Square Enix Holdings Co., Ltd |
| Key Drivers | • Improved connectivity allows smoother, more immersive gaming experiences, accelerating metaverse development • Virtual concerts and events on platforms like Fortnite attract millions, blending gaming with entertainment. • Companies collaborate with game developers for in-game marketing, opening new revenue streams within virtual worlds. |
| Market Restraints | • With numerous platforms emerging, competition can dilute user engagement and loyalty, making it harder for individual games to stand out. • Some players may find it difficult to adapt to new technologies and virtual experiences, limiting the potential user base. • Prolonged use of VR and AR technologies can lead to physical discomfort or health concerns, which might deter players from participating. |
Frequently Asked Questions
Ans. The metaverse has the potential to revolutionize the gaming industry. It could allow gamers to interact with each other in more realistic and immersive ways, and it could create new opportunities for gaming companies to generate revenue.
Ans.The adventure segment is forecasted to have the highest growth during forecast period due to the increasing use of mobile phones and smart devices gaming traverse and stable bandwidth Internet penetration among the youth generation as well as adult. adventure based games are open world -games where users can roam, get on missions, and meet new people virtually.
Ans. The growing investment in metaverse technology, the increasing number of VR users, and the growing adoption of blockchain-based products such as cryptocurrencies And NFTs are driving the metaverse in gaming market.
Ans. USD 390.6 Billion is the projected Metaverse in Gaming Market size of the Company by 2032.
Ans. The Compound Annual Growth rate for Metaverse in Gaming Market over the forecast period is 37.92%.
Get in Touch
