Artificial Intelligence In Agriculture Market Report Scope & Overview:
The Artificial Intelligence In Agriculture Market was valued at USD 1.8 billion in 2023 and is expected to reach USD 12.8 billion by 2032, growing at a CAGR of 24.34% from 2024-2032.
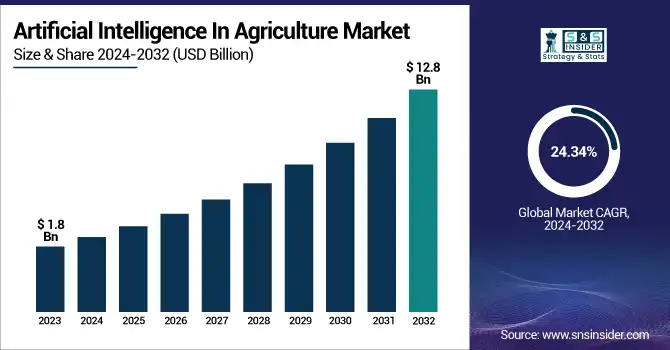
To Get more information on Artificial Intelligence In Agriculture Market - Request Free Sample Report
The 2023 data highlights that AI technology adoption in precision farming is most prominent in North America and Europe, driven by advanced agri-tech infrastructure and supportive government policies. The use of AI-enabled drones and robotics in crop monitoring has surged, especially in countries like the U.S., China, and Brazil, enhancing field-level data collection. Investment in AI-driven smart irrigation systems has grown across arid regions, aiming to optimize water use. Furthermore, AI-based forecasting models have significantly improved crop yields, particularly in the cereal and fruit farming sectors. The report also unveils trends in AI integration across agribusiness value chains, increasing automation, and the role of machine learning in enhancing sustainability and reducing input costs.
The U.S. Artificial Intelligence in Agriculture Market was valued at USD 0.5 billion in 2023 and is expected to reach USD 3.4 billion by 2032, growing at a CAGR of 24.03% from 2024-2032. due to the rising demand for precision farming and increasing investments in agri-tech innovations. Strong government support and early adoption of AI tools like drones and smart irrigation systems are accelerating deployment. The market is expected to maintain robust growth, reaching substantial valuation by 2032 with a high CAGR.
Artificial Intelligence In Agriculture Market Dynamics
Driver
-
AI is boosting productivity and resource efficiency in farming to meet growing global food demand.
The growing global population is putting pressure on food systems, pushing farmers to adopt advanced solutions to increase yield and efficiency. AI helps streamline crop management, irrigation, pest control, and resource utilization. Precision farming, supported by AI algorithms and data analytics, enables farmers to make real-time decisions and optimize output. Additionally, the rise in sensor-based technologies and drone surveillance has boosted AI integration across large-scale farms. Governments and private entities are investing significantly in digital agriculture initiatives, further driving adoption. These factors combined are creating a solid foundation for the sustained growth of AI in agriculture, especially in regions with advanced technological infrastructures.
Restraint
-
Lack of internet and tech access in rural areas limits AI adoption in agriculture.
While AI technologies offer numerous benefits, limited access to stable internet, power, and digital infrastructure in rural and remote areas hampers widespread adoption. Many developing countries still face gaps in connectivity and affordability, which restricts the deployment of cloud-based AI tools and real-time monitoring systems. Furthermore, the high initial cost of AI-enabled devices and a lack of technical expertise among farmers create barriers to entry. Without targeted efforts to bridge these infrastructure and education gaps, the market growth potential of AI in agriculture remains uneven, particularly in small and medium-scale farming operations in emerging economies.
Opportunity
-
Combining AI with IoT and satellite data opens new possibilities for real-time, data-driven farming.
The convergence of AI with IoT devices and satellite imaging presents vast opportunities to transform agricultural practices. Smart sensors combined with AI can monitor soil health, crop conditions, and weather patterns in real time. Satellite-based imagery analysis using machine learning allows for early detection of pest infestations and crop stress. These capabilities help optimize input use and boost sustainability. With falling hardware costs and expanding rural connectivity, the integration of such technologies is becoming more feasible. This creates an ideal landscape for companies and governments to implement AI-driven platforms and expand precision agriculture solutions at scale.
Challenge
-
Unclear data ownership and lack of standard protocols hinder trust and seamless AI integration.
One of the significant challenges in the AI in agriculture market is the lack of clear data ownership policies and standards. AI systems depend heavily on large datasets gathered from farms, drones, and IoT devices, raising concerns about who controls and benefits from this information. Many farmers are hesitant to share their operational data due to mistrust or unclear data usage terms. Moreover, the absence of universal standards for data collection, sharing, and interpretation hinders interoperability between systems from different vendors. This fragmentation not only reduces efficiency but also slows down innovation and cross-platform deployment, limiting the full potential of AI in agriculture.
Artificial Intelligence In Agriculture Market Segmentation Analysis
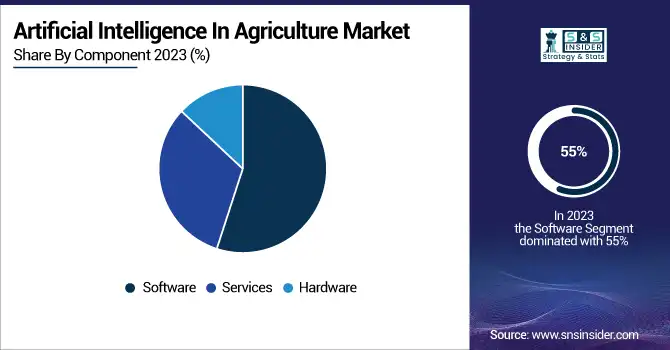
By Component
In 2023, the software segment led artificial intelligence in the agriculture market and held a revenue share of 55%. The growing demand for precision farming and resource allocation is driving the growth of this segment. With the introduction of modern technologies in the agriculture sector, diverse data is being generated from different sources such as sensors, drones, and weather stations, etc. Using data obtained by sensors to understand crop health, soil conditions and weather patterns, software will also be key to interpret these data, allowing farmers to use the data to maximize crop yields and reduce waste.
The fastest CAGR during the forecast period is expected to be seen in the hardware segment. This segment is being propelled by the rising adoption of AI-driven sensors and drones. These hardware systems aid farmers in accurately tracking various dynamics pertinent to the agriculture industry. Soil monitoring using sensors involves placing devices that measure various factors, including soil moisture, temperature, pH levels, and nutrient content.
By Technology
In 2023, the machine learning & deep learning technology segment led the market and held the largest revenue share of more than 47%. Big Data technologies have allowed farmers to make precise decisions based on insights gained from the analysis of complex data sets. Machine learning and deep learning apply historical data, weather patterns, and soil conditions to predict crop yields, sense diseases, and measure when to plant. Additionally, the incorporation of these technologies within AI is projected to help provide groundbreaking and sophisticated solutions in agriculture, including predictive analytics platforms and AI-enabled farm management systems.
The computer vision segment is projected to offer the fastest CAGR during the forecast period. Computer vision technology uses these algorithms and other technology-driven tools and enables the analysis of visual data collected through cameras and sensors, detects problems, and allows quick action to prevent crop losses. It enables real-time data analytics, which helps in making timely decisions and better yield.
By Application
The precision farming segment held the largest share of the market in 2023. Just like C2C, precision farming is emerging as one of the most prominent uses of AI in the agriculture sector. It allows farmers to be more cost-efficient and control resources better. Precision agriculture, which is enabled by artificial intelligence, allows farmers to collect real-time data on soil conditions, temperature, and moisture levels using advanced technologies like GPS, drones, and satellite imaging so they can make data-driven decisions.
The agriculture robots segment is anticipated to register the fastest growth rate during the forecast period. Advances in robotics, computer vision, and machine learning also allow robots to carry out sophisticated crop monitoring and harvesting activities. As the demand for food production increases, the need for improved efficiency and productivity in farming processes and the development of robotics technologies will drive the growth of the segment.
Regional Landscape
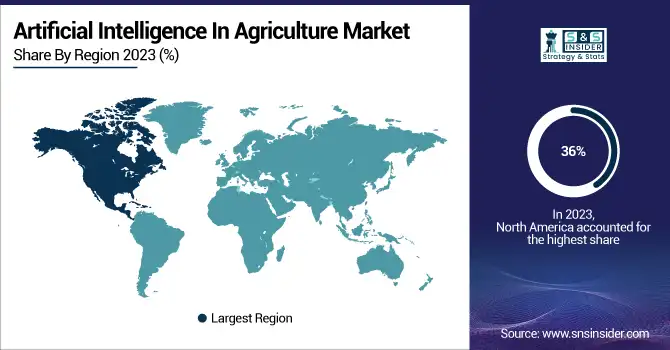
North America dominated the market and accounted for the largest share of 36% in 2023. Some of the major growth contributors for this segment include strong technological innovation and hastened acceptance of AI solutions. This market is also gaining from increased penetration of technology, such as AI, machine learning, and data analytics, in almost every sector in the region.
The Asia-Pacific is expected to grow at the fastest CAGR from 2024 to 2032. This regional industry has expanded due to the growing population, its increasing agricultural productivity requirements, and major agro-tech enhancements supported by governments and other organizing bodies. With countries like China and India seeing population explosions, there is a growing demand for improved food production techniques in order to maintain food security.
Get Customized Report as per Your Business Requirement - Enquiry Now
Key Players
The major key players along with their products are
-
IBM Corporation – Watson Decision Platform for Agriculture
-
Microsoft Corporation – Azure FarmBeats
-
Deere & Company – See & Spray
-
Trimble Inc. – Trimble Ag Software
-
AGCO Corporation – Fuse Smart Farming
-
BASF SE – xarvio Digital Farming Solutions
-
Corteva Agriscience – Granular Insights
-
Bayer AG (Climate LLC) – Climate FieldView
-
Raven Industries, Inc. – VSN (Visual Guidance System)
-
Prospera Technologies – Prospera Crop Monitoring
-
Taranis – Taranis Precision Scouting
-
Gamaya – Gamaya AI Crop Intelligence
-
PrecisionHawk – PrecisionAnalytics Agriculture
-
AgEagle Aerial Systems Inc. – MicaSense RedEdge Sensor
Recent Developments
-
On Nov 14, 2024, IBM and Sustainable Energy for All launched AI-powered solutions to support sustainable urban development, including the Open Building Insights platform and an urban growth model. These tools aim to help policymakers address energy and infrastructure needs in developing regions.
-
On Aug 23, 2024, Bayer Crop Science is developing a new AWS-based data science platform with generative AI capabilities to create innovative agricultural solutions. The platform, built with Amazon SageMaker Studio and Bedrock, is in the discovery phase, with production models expected by 2025.
|
Report Attributes |
Details |
|
Market Size in 2023 |
US$ 1.8 Billion |
|
Market Size by 2032 |
US$ 12.8 Billion |
|
CAGR |
CAGR of 24.34 % From 2024 to 2032 |
|
Base Year |
2023 |
|
Forecast Period |
2024-2032 |
|
Historical Data |
2020-2022 |
|
Report Scope & Coverage |
Market Size, Segments Analysis, Competitive Landscape, Regional Analysis, DROC & SWOT Analysis, Forecast Outlook |
|
Key Segments |
• By Component (Hardware, Software, Services) |
|
Regional Analysis/Coverage |
North America (US, Canada, Mexico), Europe (Eastern Europe [Poland, Romania, Hungary, Turkey, Rest of Eastern Europe] Western Europe] Germany, France, UK, Italy, Spain, Netherlands, Switzerland, Austria, Rest of Western Europe]), Asia Pacific (China, India, Japan, South Korea, Vietnam, Singapore, Australia, Rest of Asia Pacific), Middle East & Africa (Middle East [UAE, Egypt, Saudi Arabia, Qatar, Rest of Middle East], Africa [Nigeria, South Africa, Rest of Africa], Latin America (Brazil, Argentina, Colombia, Rest of Latin America) |
|
Company Profiles |
IBM Corporation, Microsoft Corporation, Deere & Company, Trimble Inc., AGCO Corporation, BASF SE, Corteva Agriscience, Bayer AG (Climate LLC), Raven Industries Inc., Descartes Labs, Prospera Technologies, Taranis, Gamaya, PrecisionHawk, AgEagle Aerial Systems Inc. |
Get in Touch
