Narcotics Scanner Market Report Scope & Overview:
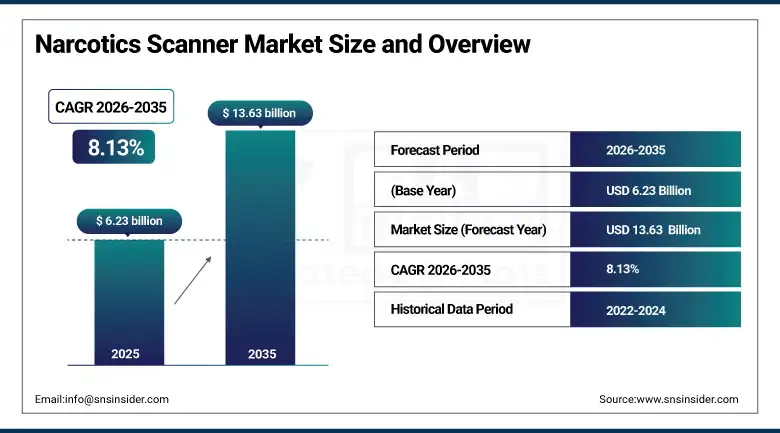
The Narcotics Scanner market was valued at USD 6.23 billion in 2025 and is expected to reach USD 13.63 billion by 2035, growing at a CAGR of 8.13% from 2026–2035.
Narcotics scanners encompass a diverse range of chemical detection platforms designed to identify trace quantities of illicit substances, synthetic opioids, psychoactive compounds, and controlled precursor chemicals across the full spectrum of security environments from airport terminals and seaport container inspection facilities through correctional institution visitor processing, military forward operating base access control, customs and border protection checkpoints, and healthcare and rehabilitation settings where preventing drug introduction is critical to patient recovery programme integrity. The technology landscape encompasses multiple detection modalities including ion mobility spectrometry that separates ionized molecules by their drift time through a gas-filled tube to produce compound-specific signatures, mass spectrometry that provides unambiguous molecular weight confirmation for definitive substance identification, infrared and Raman spectroscopy that identify compounds through their unique molecular vibrational fingerprints without consuming the sample, and emerging immunoassay-based colorimetric detection strips offering low-cost presumptive field identification without laboratory infrastructure requirements.
The U.S. Drug Enforcement Administration's identification of over 140 distinct fentanyl analogues and related synthetic opioids in trafficking samples between 2020 and 2025, each requiring specific calibration updates in ion mobility spectrometry and mass spectrometry detection libraries, demonstrates the ongoing technology refresh investment that the synthetic opioid crisis is driving in the narcotics scanner market's installed base.
Narcotics Scanner Market Size and Forecast
-
Market Size in 2026E: USD 6.74 Billion
-
Market Size by 2035: USD 13.63 Billion
-
CAGR: 8.13% from 2026 to 2035
-
Fastest Growing Region: Asia Pacific
-
Largest Region: North America
To Get more information On Narcotics Scanner Market - Request Free Sample Report
Narcotics Scanner Market Trends
-
Rapid integration of artificial intelligence and machine learning algorithms into narcotics scanner software platforms enabling automated substance library matching, reduction of false-positive alert rates through pattern recognition across historical scan datasets, and predictive flagging of samples with spectral signatures consistent with novel psychoactive substances not yet formally classified in regulatory reference libraries.
-
Growing adoption of multi-modal detection platforms that combine ion mobility spectrometry with Raman or infrared spectroscopy in a single instrument, providing both the speed advantage of IMS screening and the confirmatory specificity of spectroscopic analysis within a single scan event without requiring sample transfer between separate instruments.
-
Increasing deployment of networked narcotics detection systems that transmit scan results, alarm events, and substance identification data to central security management platforms in real time, enabling threat pattern analysis across multiple security checkpoints, automated compliance reporting for regulated facilities, and remote technical support from vendor operations centers for field instrument issues.
-
Expanding correctional facility investment in narcotics detection driven by the introduction of ultra-potent synthetic opioids through non-traditional smuggling channels including contaminated mail, clothing, and legal documents that have rendered conventional manual search procedures inadequate for preventing drug introduction into secure custody environments.
-
Rising demand for handheld and portable narcotics detection devices from law enforcement agencies, military units, and customs field teams operating in remote or resource-constrained environments where the analytical performance of transportable detection instruments now approaches laboratory-grade fixed equipment through advances in miniaturized mass spectrometry and spectroscopy components.
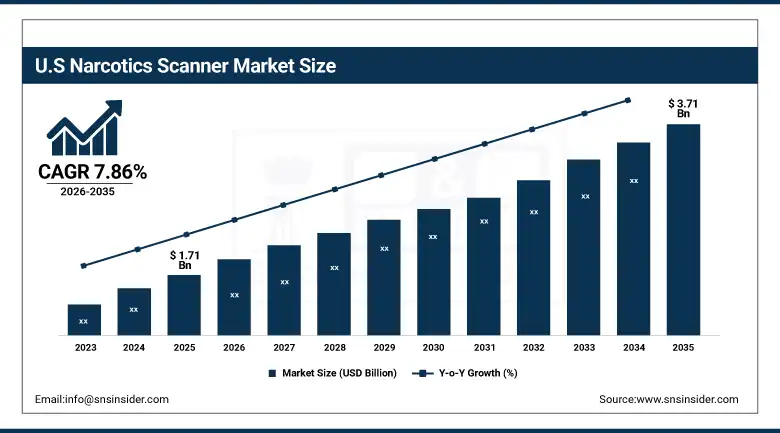
The U.S. Narcotics Scanner Market Outlook
The U.S. Narcotics Scanner Market was valued at approximately USD 1.71 billion in 2025 and is expected to reach approximately USD 3.71 billion by 2035, growing at a CAGR of 7.86%.
The United States represents the world's largest single national market for narcotics detection equipment, reflecting the country's extraordinary investment in border security infrastructure across land ports of entry, international airports, and seaports combined with the acute operational need created by the fentanyl trafficking crisis that has made synthetic opioid detection the defining challenge of American counter-narcotics technology procurement. The TSA's deployment of advanced explosives and narcotics trace detection systems across major U.S. international airports, CBP's investment in non-intrusive inspection technology for cargo and vehicle inspection at border crossings, and the Bureau of Prisons' accelerating adoption of body scanners and mail inspection technologies for correctional facility drug interdiction collectively represent the primary federal procurement programmes that sustain the U.S. narcotics scanner market's revenue base.
The Stopping Overdoses of Fentanyl through Forensics, Forensic Enforcement and Recording Act and broader U.S. legislative mandates for enhanced synthetic opioid detection at ports of entry have created compliance-driven procurement requirements for narcotics detection systems with demonstrated fentanyl and fentanyl analogue sensitivity that are sustaining technology refresh investment across federal and state law enforcement agencies independent of discretionary budget cycle pressures.
Narcotics Scanner Market Segment Analysis
-
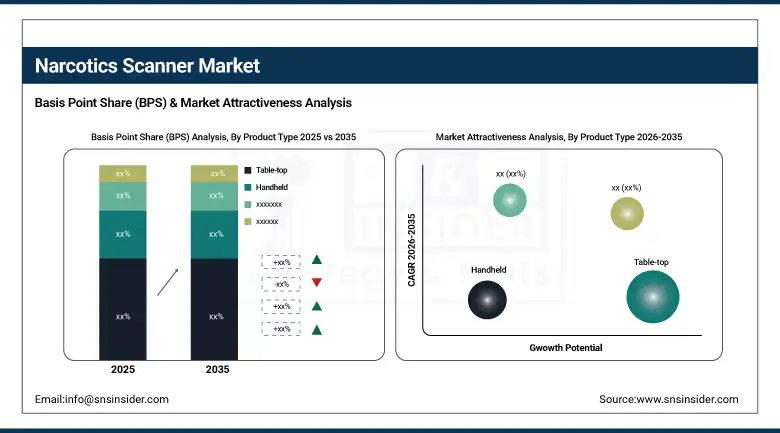
By Product Type, Table-top scanners dominated with approximately 45.20% in 2025; Handheld devices are the fastest-growing segment at a CAGR of 7.04% as portability advantages drive adoption by law enforcement field units and military personnel requiring mobile narcotics detection capability.
-
By Technology, Ion Mobility Spectrometry held the largest share at approximately 44.54% in 2025; Infrared Spectroscopy is the fastest-growing technology at a CAGR of 7.84%.
-
By Application, Correctional Facilities dominated with approximately 35.06% in 2025; Healthcare & Rehabilitation Centers are the fastest-growing application at a CAGR of 7.14%.
By Product Type, table-top dominates, handheld is expected to grow fastest
Table-top scanners retained the dominant product type position with approximately 45.20% of the narcotics scanner market in 2025, reflecting their well-established deployment across the fixed security infrastructure of international airports, seaports, border crossing facilities, and correctional institutions where the combination of the highest analytical performance, comprehensive substance library coverage, and integration with facility access control systems justifies the larger physical footprint and higher unit cost relative to portable alternatives.
Handheld narcotics detection devices are the fastest-growing product type as the convergence of miniaturized mass spectrometry, microelectromechanical sensor arrays, and advanced spectroscopy components into hand-portable form factors has brought laboratory-grade analytical performance within reach of field deployable platforms that law enforcement officers, customs inspectors, and military personnel can carry and operate without fixed infrastructure support.
By Technology, IMS dominates, infrared spectroscopy is expected to grow fastest
Ion Mobility Spectrometry retained the dominant technology position with approximately 44.54% of narcotics scanner market revenues in 2025, as the most extensively deployed and operationally proven trace detection technology for controlled substances globally across the full range of security checkpoint applications. IMS separates ionized molecules through a gas-filled drift tube under an applied electric field, with each compound's characteristic drift time providing a specific identification signature that instruments compare against comprehensive reference libraries covering hundreds of regulated controlled substances, their cutting agents, and increasingly their novel psychoactive substance analogues.
Infrared Spectroscopy is the fastest-growing technology segment in the narcotics scanner market at a CAGR of 7.84% through 2035, driven by the development of compact Fourier-transform infrared and attenuated total reflectance spectroscopy instruments that provide definitive molecular identification of bulk controlled substance samples through their characteristic infrared absorption spectra without requiring sample dissolution or extraction.
Regional Analysis
|
Region |
Major Country |
Share within Region, 2025 (%) |
|---|---|---|
|
North America |
United States |
86.3% |
|
Europe |
United Kingdom |
22.7% |
|
Asia Pacific |
China |
40.4% |
|
Middle East & Africa |
Saudi Arabia |
32.5% |
|
Latin America |
Brazil |
41.8% |
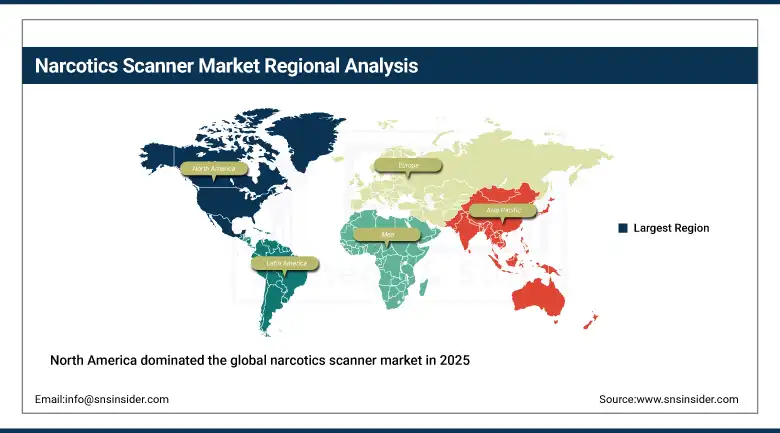
North America Narcotics Scanner Market Insights
North America dominated the global narcotics scanner market in 2025 with the United States accounting for approximately 86.3% of North American revenues. The region's market leadership reflects the combination of the world's largest absolute investment in border security and counter-narcotics technology procurement, the acute fentanyl trafficking crisis creating compliance-mandated detection technology investment across federal and state correctional systems, and the presence of major narcotics detection technology companies including Smiths Detection, L3 Technologies, and Morpho Detection that sustain a competitive domestic innovation ecosystem. The U.S. government's sustained annual investment in customs and border protection technology, consistently exceeding several billion dollars across all non-intrusive inspection and trace detection programmes, provides a stable and large-volume procurement foundation that sustains domestic narcotics scanner market growth independent of commercial sector budget cycles.
Get Customized Report as per Your Business Requirement - Enquiry Now
Europe Narcotics Scanner Market Insights
Europe is a sophisticated narcotics scanner market driven by the European Union's comprehensive drug strategy and the Schengen Area's investment in border technology at external frontier crossing points, combined with the national security investment programmes of individual member states responding to domestic drug trafficking routes and synthetic opioid import threats. The United Kingdom accounts for approximately 22.7% of European revenues through its Home Office investment in airport and seaport narcotics detection, HM Prison & Probation Service correctional facility drug interdiction programmes, and Border Force technology procurement. Germany, France, the Netherlands, and Spain represent significant additional European markets where the combination of major international transportation hubs, extensive correctional facility networks, and active law enforcement narcotics detection programmes create consistent procurement demand across all narcotics scanner product categories.
Asia Pacific Narcotics Scanner Market Insights
Asia Pacific is the fastest-growing narcotics scanner market, driven by the rapid expansion of international airport and seaport security infrastructure across China, India, South Korea, Japan, Singapore, and the ASEAN economies that are investing in narcotics detection technology to meet international civil aviation and customs security standards, combined with growing domestic law enforcement investment as regional drug trafficking routes evolve and synthetic substance availability increases across Asian markets. China accounts for approximately 40.4% of Asia Pacific revenues through its combination of the world's largest international cargo and passenger handling volumes creating extensive narcotics detection infrastructure requirements, significant domestic law enforcement investment in detection technology, and a growing domestic narcotics scanner manufacturing capability that is increasingly competitive with international brands in the mid-tier performance segment.
MEA & Latin America Narcotics Scanner Market Insights
The Middle East and Africa and Latin America represent growing narcotics scanner markets were expanding international trade and passenger transport volumes, increasing government counter-narcotics investment, and in Latin America the particular urgency of addressing narcotics trafficking that represents the defining organised crime challenge of the region collectively drive market development. Saudi Arabia leads MEA narcotics detection investment at approximately 32.5% of regional revenues through its Vision 2030 infrastructure expansion that includes major new airport capacity, seaport development, and border crossing modernization programmes that incorporate narcotics detection as standard security equipment. Brazil leads Latin American narcotics scanner revenues at approximately 41.8% of regional revenues through its Federal Police and Recite Federal customs authority investment in detection technology at major international airports and the country's extensive Atlantic coast seaport facilities.
Market Dynamics
Growth Drivers: Synthetic opioid trafficking crisis creating acute detection urgency combined with expanding regulatory mandates requiring narcotics detection capability across progressively more security-sensitive facility categories
The primary structural growth drivers for the narcotics scanner market are the synthetic opioid trafficking crisis cent red on fentanyl and its analogues that has elevated narcotics detection from a routine security operational function to an acute public health emergency response requirement across correctional facilities, border protection agencies, and law enforcement organizations where detection failures directly contribute to fatal overdose events among inmates, officers, and community members, combined with the regulatory expansion of mandatory narcotics detection requirements into facility categories and geographic markets that previously lacked formal detection programme obligations. The WHO's classification of synthetic opioid overdose deaths as a global public health crisis is creating political pressure for increased detection investment that transcends routine security budget cycle considerations, while the operational discovery that fentanyl contamination can occur through casual contact with contaminated surfaces rather than only through intentional drug use has expanded the scope of facilities requiring detection capability to include legal and social service environments previously outside the narcotics detection market.
Restraints: High false-positive rates in conventional IMS platforms reducing operational confidence in detection alerts, high procurement and maintenance costs limiting adoption in resource-constrained facilities, and rapidly evolving novel psychoactive substance landscape requiring continuous reference library updates
A significant restraint on the narcotics scanner market is the false-positive alarm rate that IMS-based systems generate from common legitimate substances including certain medications, cosmetics, fertilizers, and food compounds whose ionization signatures partially overlap with controlled substance reference patterns, creating alarm events that require secondary verification screening and generate checkpoint throughput delays that can create operational pressure to reduce detection sensitivity thresholds in high-volume environments where processing speed is a primary operational priority. The proliferation of novel synthetic psychoactive substances at rates that consistently outpace regulatory scheduling and commercial detection library development creates gaps in coverage that allow traffickers exploiting novel analogue chemistry to potentially circumvent detection platforms calibrated only against formally scheduled reference compounds.
Opportunities: AI-enhanced substance library management enabling rapid novel compound integration, expansion into new facility categories including schools and treatment centers, and quantum sensing research creating next-generation detection sensitivity
The integration of machine learning-driven substance library management systems that can automatically characterised novel psychoactive substances from mass spectrometry fragmentation pattern databases and update field instrument libraries through over-the-air updates without requiring physical service visits represents a significant competitive differentiation opportunity for narcotics scanner platform providers, as the speed of novel analogue library integration becomes an increasingly important procurement evaluation criterion for agencies managing the synthetic opioid detection challenge. The expansion of narcotics detection into educational institution security programmes, where the fentanyl overdose risk associated with counterfeit pharmaceutical tablets circulating among adolescent and young adult populations has created school administrator demand for non-invasive detection capability, represents a large and previously unaddressed addressable market that compact, low-cost tabletop and handheld detection platforms are making commercially viable for the first time.
Recent Developments:
-
2025: Smiths Detection launched an updated version of its IONSCAN 600 ion mobility spectrometry platform incorporating expanded fentanyl analogue library coverage including over 100 novel synthetic opioid variants identified in recent trafficking seizures, addressing the growing law enforcement and correctional facility requirement for comprehensive synthetic opioid detection beyond the scheduled compound reference sets of previous platform generations.
-
2025: Bruker Corporation expanded its MIRA DS handheld Raman spectrometer library with new narcotics and novel psychoactive substance reference spectra, enabling field identification of emerging synthetic cannabinoids, cathinones, and opioid analogues that conventional IMS platforms calibrated to scheduled compound libraries may not reliably detect.
-
2025: OSI Systems' Optotek subsidiary received contract awards for narcotics trace detection system deployment at multiple major U.S. international airports following TSA programme expansion requiring enhanced synthetic opioid detection capability at all Category X and Category I airport security checkpoints.
Narcotics Scanner Market Key Players are:
-
Smiths Detection Group Ltd.
-
Bruker Corporation
-
OSI Systems Inc. (Optotek)
-
Rapiscan Systems
-
L3Harris Technologies Inc.
-
FLIR Systems Inc.
-
Morpho Detection (Safran SA)
-
Chemring Group PLC
-
DetectaChem
-
908 Devices Inc.
-
Rigaku Analytical Devices
-
Thermo Fisher Scientific
-
BioMerieux SA
-
Autoclear LLC
-
Westminster International Ltd.
-
Nuctech Company Ltd.
-
InVision Technologies
-
Implant Sciences Corporation
-
Electronic Sensor Technology
-
Environics Oy
Narcotics Scanner Market Report Scope:
| Report Attributes | Details |
|---|---|
| Market Size in 2025 | USD 6.23 Billion |
| Market Size by 2035 | USD 13.63 Billion |
| CAGR | CAGR of 8.13% From 2026 to 2035 |
| Base Year | 2025 |
| Forecast Period | 2026-2035 |
| Historical Data | 2022-2024 |
| Report Scope & Coverage | Market Size, Segments Analysis, Competitive Landscape, Regional Analysis, DROC & SWOT Analysis, Forecast Outlook |
| Key Segments | • By Product Type (Table-top, Handheld, Walkthrough) • By Technology (Ion Mobility Spectrometry, Mass Spectrometry, Infrared Spectroscopy, Raman Spectroscopy, Others) • By Application (Correctional Facilities, Customs & Border Protection, Transportation & Public Safety, Military & Defense, Healthcare & Rehabilitation Centers, Others) |
| Regional Analysis/Coverage | North America (US, Canada), Europe (Germany, UK, France, Italy, Spain, Russia, Poland, Rest of Europe), Asia Pacific (China, India, Japan, South Korea, Australia, ASEAN Countries, Rest of Asia Pacific), Middle East & Africa (UAE, Saudi Arabia, Qatar, South Africa, Rest of Middle East & Africa), Latin America (Brazil, Argentina, Mexico, Colombia, Rest of Latin America). |
| Company Profiles | Smiths Detection Group Ltd., Bruker Corporation, OSI Systems Inc. (Optotek), Rapiscan Systems, L3Harris Technologies Inc., FLIR Systems Inc., Morpho Detection (Safran SA), Chemring Group PLC, DetectaChem, 908 Devices Inc., Rigaku Analytical Devices, Thermo Fisher Scientific, BioMerieux SA, Autoclear LLC, Westminster International Ltd., Nuctech Company Ltd., InVision Technologies, Implant Sciences Corporation, Electronic Sensor Technology, and Environics Oy. |
Frequently Asked Questions
North America dominated the Narcotics Scanner Market in 2025
Table-top scanners dominated with approximately 45.20% of revenues in 2025.
The synthetic opioid trafficking crisis creating acute detection urgency in correctional facilities and border security combined with expanding regulatory mandates requiring narcotics detection capability across progressively more facility categories.
The Narcotics Scanner Market was valued at USD 6.23 billion in 2025.
The Narcotics Scanner Market is expected to grow at a CAGR of 8.13% from 2026 to 2035.
Get in Touch
