R&D Cloud Collaboration Market Analysis & Overview:
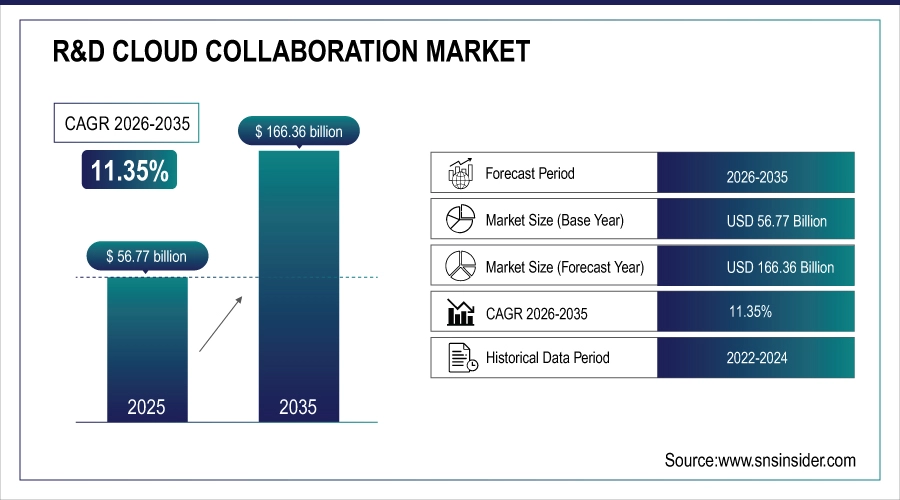
The R&D Cloud Collaboration Market was valued at USD 56.77 billion in 2025 and is expected to reach USD 166.36 billion by 2035, growing at a CAGR of 11.35% from 2026-2035.
The growth of the R&D Cloud Collaboration Market is driven by the rising demand for real-time data sharing, cross-border research, and remote innovation management. As enterprises prioritize faster product development and globalized R&D workflows, cloud platforms enable seamless collaboration across departments and geographies. The increasing adoption of AI, big data analytics, and IoT in research processes also boosts the need for scalable, secure cloud-based environments. The surge in hybrid work models and digital transformation strategies further accelerates market expansion, especially in healthcare, IT, and advanced manufacturing sectors.
Furthermore, the America’s AI Action Plan (July 2025) emphasizes the creation of regulatory sandboxes and AI Centers of Excellence to support open data sharing and public‑private collaboration, reinforcing the importance of robust cloud-based R&D infrastructure.
Notably, 94% of enterprises use cloud services in some capacity, and 77% have at least one application or part of their infrastructure in the cloud, with 76–80% adopting multi-cloud or hybrid strategies to enhance flexibility and performance.
R&D Cloud Collaboration Market Size and Forecast
-
Market Size in 2025: USD 56.77 Billion
-
Market Size by 2035: USD 166.36 Billion
-
CAGR: 11.35% from 2026 to 2035
-
Base Year: 2025
-
Forecast Period: 2026–2035
-
Historical Data: 2022–2024
To Get more information on R&D Cloud Collaboration Market - Request Free Sample Report
R&D Cloud Collaboration Market Trends
-
Rising need for remote and collaborative research workflows is driving the R&D cloud collaboration market.
-
Growing adoption of cloud-based platforms in pharmaceuticals, biotechnology, and engineering sectors is boosting market growth.
-
Expansion of global research networks and virtual labs is fueling deployment.
-
Increasing focus on secure data sharing, version control, and real-time collaboration is shaping adoption trends.
-
Advancements in AI, analytics, and integrated project management tools are enhancing efficiency and innovation.
-
Rising demand for cost-effective, scalable, and flexible research solutions is supporting market expansion.
-
Collaborations between cloud service providers, research institutions, and enterprises are accelerating technology adoption and global reach.
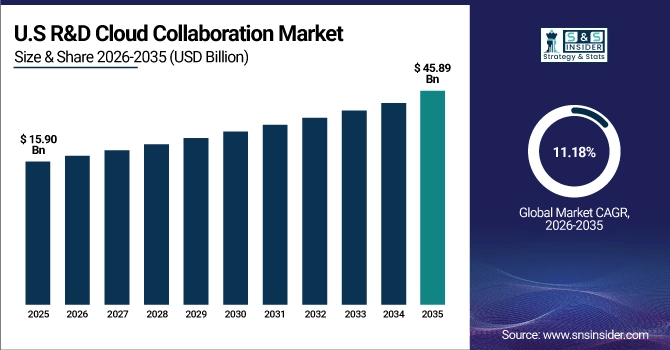
U.S. R&D Cloud Collaboration Market was valued at USD 15.90 billion in 2025 and is expected to reach USD 45.89 billion by 2035, growing at a CAGR of 11.18% from 2026-2035.
The U.S. R&D Cloud Collaboration Market is growing due to increased investments in innovation, rising demand for remote collaboration tools, and the widespread adoption of cloud technologies across key sectors like healthcare, defense, and IT to accelerate research and development processes.
R&D Cloud Collaboration Market Growth Drivers:
-
Rapid shift towards remote and distributed R&D operations accelerating adoption of secure, real-time cloud-based collaboration platforms globally
The increasing prevalence of remote and distributed research teams is driving the demand for robust cloud collaboration tools in R&D. Organizations require platforms that support real-time data sharing, version control, and secure access to sensitive intellectual property from anywhere in the world. This shift reduces operational bottlenecks, accelerates project timelines, and improves coordination among multidisciplinary teams. As enterprises increasingly embrace hybrid work models, the ability to maintain seamless collaboration without physical boundaries becomes critical.
-
A study shows that 35% of organizations expanded their cloud strategy, and 47% accelerated their cloud timeline driven by remote work needs. Key benefits cited include scalability (65%), reduced on‑prem investments (59%), and improved business continuity (56%).
-
A Stanford study cited on Atlassian’s blog found remote employees using cloud apps were 13% more productive than their office-based counterparts. Additionally, location flexibility was credited with productivity gains by 85% of businesses translating into approximately USD 11,000 in savings per employee working half-time remote.
R&D Cloud Collaboration Market Restraints
-
High concerns over data security, intellectual property protection, and regulatory compliance limiting adoption of cloud collaboration tools
In R&D, the exchange of sensitive data such as proprietary designs, experimental results, and patented technologies demands the highest security measures. Organizations often hesitate to adopt cloud platforms due to concerns about data breaches, cyberattacks, and non-compliance with industry-specific regulations. Intellectual property theft risks can result in significant financial and reputational damage, especially in competitive markets. Additionally, varying global data protection laws complicate cross-border collaboration. Without robust encryption, access controls, and compliance frameworks, enterprises may delay or restrict cloud collaboration adoption, slowing innovation and reducing potential efficiency gains across research-driven industries.
R&D Cloud Collaboration Market Opportunities
-
Rising adoption of digital twin and simulation technologies increasing the value proposition of cloud-based R&D collaboration
Digital twin models and advanced simulations require vast computing resources, real-time updates, and collaborative input from geographically dispersed teams. Cloud collaboration platforms offer the scalability, computational power, and shared workspaces necessary for effective digital twin integration into R&D workflows. This allows for faster prototyping, continuous testing, and real-world scenario modeling without significant physical resource investments. As industries adopt simulation-driven design to reduce costs and accelerate innovation, cloud-enabled collaboration tools that seamlessly integrate with digital twin ecosystems are positioned to capture significant market growth opportunities.
-
Unilever implemented a digital twin strategy in its Valinhos, Brazil factory. By using IoT-generated real-time data and advanced analytics, the company saved approximately USD 2.8 million and achieved 1%–3% productivity gains.
-
In manufacturing and defense, Boeing has leveraged digital twins for aircraft design and virtual prototyping, achieving a 40% improvement in part quality, along with enhanced collaboration and efficiency across its supply chain.
R&D Cloud Collaboration Market Challenges
-
Ensuring scalability and performance reliability during peak R&D workloads presents significant operational challenges for cloud platforms
R&D projects often experience workload spikes during phases like testing, validation, or product launch, demanding consistent performance from cloud infrastructure. If platforms cannot scale effectively or maintain reliability during high-demand periods, productivity and timelines suffer. Latency issues, downtime, or insufficient computational resources can disrupt sensitive experiments and collaborative decision-making. Providers must ensure robust infrastructure, elastic scalability, and failover mechanisms to meet these fluctuating demands. Without addressing performance reliability, cloud collaboration tools may fall short of supporting the rigorous operational needs of dynamic, large-scale R&D environments.
R&D Cloud Collaboration Market Segmentation Analysis
By Component
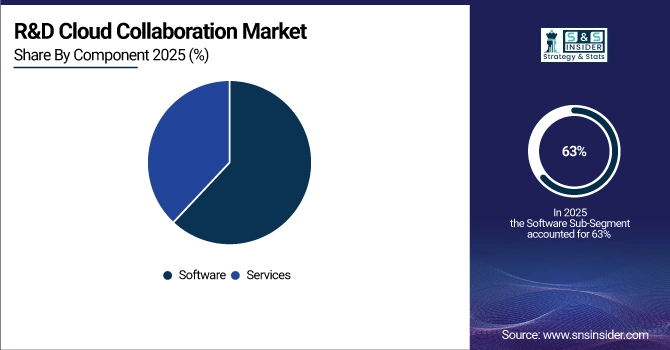
The software segment led the R&D Cloud Collaboration Market in 2025 with a 63% revenue share due to its scalability, flexibility, and ability to integrate advanced tools like AI, analytics, and project management. These platforms streamline complex research workflows, enable real-time collaboration, and ensure data security. Continuous innovation and feature enhancements make software solutions indispensable for organizations seeking efficient, centralized environments to manage distributed R&D teams and global research operations effectively.
The services segment is projected to grow at the fastest CAGR of 12.89% from 2026–2035, driven by the rising demand for implementation, customization, and managed support for cloud collaboration platforms. Organizations increasingly rely on specialized service providers to ensure smooth integration with legacy systems, optimize performance, and provide training. This personalized approach reduces operational disruptions and maximizes ROI, making professional services essential for achieving long-term efficiency in global R&D collaboration initiatives.
By Enterprises
Large enterprises dominated the R&D Cloud Collaboration Market in 2025 with a 57% share due to their extensive research operations, larger budgets, and the need for advanced, secure collaboration environments. These organizations often operate across multiple geographies, requiring centralized platforms to coordinate teams and manage large-scale data securely. Investments in robust infrastructure and compliance capabilities further support their preference for high-performance cloud solutions, ensuring efficiency in complex, multi-domain research projects.
SMEs are anticipated to grow at the fastest CAGR of 12.71% from 2026–2035, supported by increasing adoption of cost-effective cloud collaboration tools to enhance innovation capacity. These solutions eliminate the need for heavy infrastructure investment, providing SMEs with scalable, on-demand capabilities for research. Access to advanced features like real-time data sharing and integrated analytics enables smaller firms to compete effectively, accelerating R&D processes while optimizing operational costs in competitive market environments.
By Verticals
The BFSI segment held the largest revenue share of 32% in 2025 due to its heavy reliance on secure, compliant, and collaborative environments for financial research and innovation. Financial institutions often manage sensitive data and complex analytics, requiring high-security, real-time collaboration solutions to coordinate global teams. Regulatory demands and the need for precise, confidential data handling make cloud-based collaboration platforms vital for innovation in financial products and services.
The IT & Telecommunication segment is forecasted to grow at the fastest CAGR of 13.57% from 2026–2035, fueled by the industry’s rapid innovation cycles and global project teams. Cloud collaboration platforms enable real-time coordination between developers, engineers, and product teams, enhancing speed-to-market. Integration with emerging technologies such as AI, IoT, and 5G further amplifies efficiency, making these tools essential for managing distributed R&D environments and maintaining competitiveness in the fast-evolving tech landscape.
By Deployment model
The public deployment segment led the R&D Cloud Collaboration Market in 2025 with a 52% revenue share due to its cost efficiency, ease of access, and scalability for large research networks. Public cloud solutions offer faster deployment, on-demand resources, and broad accessibility, making them ideal for cross-border collaboration. They allow organizations to avoid heavy capital expenditure while ensuring reliable, high-performance environments for large-scale, data-intensive R&D projects.
Hybrid cloud is expected to grow at the fastest CAGR of 12.89% from 2026–2035, driven by its ability to balance security, control, and scalability. Combining public and private cloud benefits, it allows organizations to securely store sensitive R&D data while leveraging public infrastructure for non-sensitive operations. This flexibility supports compliance needs, optimizes costs, and enables seamless collaboration, making it increasingly attractive for enterprises managing diverse research workloads globally.
R&D Cloud Collaboration Market Regional Outlook
North America R&D Cloud Collaboration Market Insights
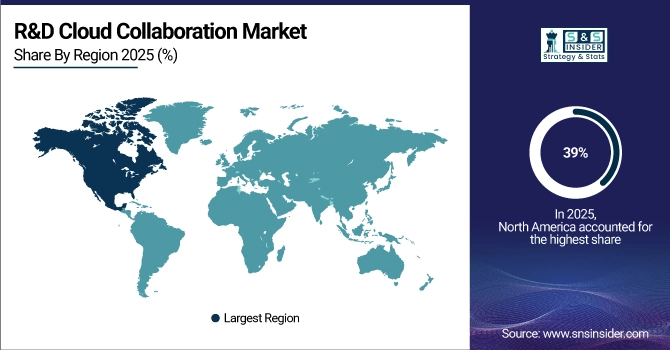
North America accounted for the largest revenue share of 39% in 2025 due to its advanced technological infrastructure, high R&D expenditure, and strong presence of leading cloud solution providers. The region benefits from well-established research ecosystems, early adoption of innovative collaboration platforms, and a strong focus on data security and compliance. Government funding and corporate investments further accelerate adoption across industries, reinforcing North America’s leadership in the R&D Cloud Collaboration Market.
The United States is dominating the R&D Cloud Collaboration Market in North America, driven by advanced infrastructure, high R&D spending, and strong technology leadership.
Get Customized Report as per Your Business Requirement - Enquiry Now
Asia Pacific R&D Cloud Collaboration Market Insights
Asia Pacific is projected to grow at the fastest CAGR of 13.20% from 2026–2035, driven by rapid digital transformation, expanding research activities, and increasing cloud adoption across emerging economies. Rising investments in innovation, supportive government initiatives, and the growing presence of technology startups enhance demand for scalable collaboration platforms. The region’s large talent pool and cost advantages make it an attractive hub for global R&D projects, fueling strong market expansion in the coming years.
China is dominating the R&D Cloud Collaboration Market in Asia Pacific, driven by massive R&D investments, rapid digitalization, and strong government support for innovation.
Europe R&D Cloud Collaboration Market Insights
Europe holds a significant position in the R&D Cloud Collaboration Market, driven by strong industrial research capacity, cross-border innovation projects, and strict data protection regulations. Widespread adoption across sectors like manufacturing, healthcare, and automotive supports collaborative advancements and technological competitiveness.
Germany is dominating the R&D Cloud Collaboration Market in Europe, supported by strong industrial R&D investments, advanced technological capabilities, and a well-established innovation ecosystem.
Middle East & Africa and Latin America R&D Cloud Collaboration Market Insights
The Middle East & Africa and Latin America are emerging markets for R&D Cloud Collaboration, driven by growing digital infrastructure, increasing research investments, and cross-border collaborations. Expanding technology adoption and supportive government initiatives are fostering innovation and market growth in these regions.
R&D Cloud Collaboration Market Competitive Landscape:
IBM Corporation
IBM drives hybrid cloud and AI innovation through global collaborations and research partnerships, focusing on AI, machine learning, and cloud-native orchestration. By engaging with universities, enterprise partners, and national institutions, IBM strengthens R&D capabilities, enhances skills development, and accelerates AI adoption across sectors. Its initiatives integrate advanced computing platforms with hybrid cloud frameworks to enable scalable enterprise solutions, AI-driven analytics, and cutting-edge research in cloud and AI technologies.
-
2023: IBM renewed research collaboration with IIT Bombay and IISc Bangalore, advancing hybrid cloud, AI inferencing, and ML orchestration R&D.
-
2024: IBM and SAP expanded cloud and generative AI collaboration to co-develop enterprise cloud-native solutions and AI-driven innovation frameworks.
-
2025: IBM partnered with AICTE to establish a National AI Lab, enhancing cloud and AI R&D, skills, and access to advanced computing platforms.
Microsoft Corporation
Microsoft leverages strategic cloud and AI partnerships to expand enterprise productivity, collaboration, and cloud-native solutions. Its initiatives combine AI labs, public-private collaborations, and industry-focused cloud centers, enabling scalable cloud platforms and integrated AI services for millions of users. Microsoft focuses on co-development with global partners to enhance hybrid collaboration, secure cloud frameworks, and advanced AI capabilities, fostering innovation and seamless integration of AI-powered workflows across enterprise and public sector applications.
-
2024: Microsoft and Cloud Software Group signed an eight-year cloud & AI partnership, co-developing cloud solutions for over 100 million users.
-
2025: Microsoft expanded AI and cloud collaborations with global partners, establishing strategic AI labs and industry AI centers for cloud integration.
Salesforce.com
Salesforce combines cloud data, analytics, and AI to deliver integrated enterprise collaboration and CRM workflows. Its partnerships with Google Cloud and other global entities enable autonomous AI agents, hybrid reasoning, and advanced data-driven solutions across cloud ecosystems. Salesforce focuses on life sciences, digital labor, and biomedical R&D, leveraging AI-driven analytics and cloud-native collaboration tools to streamline operations, enhance enterprise productivity, and enable secure, real-time insights across hybrid enterprise cloud platforms.
-
2023: Salesforce launched AI Cloud, integrating cloud, analytics, and generative AI for enterprise collaboration.
-
2024: Salesforce and Google Cloud unveiled autonomous AI agents for cloud-native productivity across Salesforce and Google Workspace.
-
2025: Salesforce and Google expanded cloud integration with hybrid reasoning and Google Gemini in Agentforce 360.
-
2025: Salesforce launched Life Sciences Partner Network to accelerate AI and cloud data programs for biomedical R&D collaboration.
Key Players
Some of the R&D Cloud Collaboration Market Companies
-
IBM Corporation
-
Microsoft Corporation
-
Cisco Systems
-
Google Inc.
-
Salesforce.com
-
Jive Software
-
Mitel Networks
-
Citrix Systems, Inc.
-
BroadSoft, Inc.
-
HighQ Solutions Limited
-
Atlassian Corporation Plc
-
Asana, Inc.
-
Slack Technologies
-
Box, Inc.
-
Zoho Corporation
-
Notion Labs, Inc.
-
Monday.com Ltd.
-
Trello
| Report Attributes | Details |
|---|---|
| Market Size in 2025 | USD 56.77 Billion |
| Market Size by 2035 | USD 166.36 Billion |
| CAGR | CAGR of 11.35% From 2026 to 2035 |
| Base Year | 2026 |
| Forecast Period | 2026-2035 |
| Historical Data | 2022-2024 |
| Report Scope & Coverage | Market Size, Segments Analysis, Competitive Landscape, Regional Analysis, DROC & SWOT Analysis, Forecast Outlook |
| Key Segments | • By Component (Software, Services) • By Deployment Model (Public, Private, Hybrid Cloud) • By Enterprise Size (SMEs, Large Enterprises) • By Vertical (BFSI, Government Institution, Healthcare & Life Sciences, Media & Advertising, IT & Telecommunication, Managed Business Service Providers, Others) |
| Regional Analysis/Coverage | North America (US, Canada), Europe (Germany, UK, France, Italy, Spain, Russia, Poland, Rest of Europe), Asia Pacific (China, India, Japan, South Korea, Australia, ASEAN Countries, Rest of Asia Pacific), Middle East & Africa (UAE, Saudi Arabia, Qatar, South Africa, Rest of Middle East & Africa), Latin America (Brazil, Argentina, Mexico, Colombia, Rest of Latin America). |
| Company Profiles | IBM Corporation, Microsoft Corporation, Cisco Systems, Google Inc., Oracle Corporation, Salesforce.com, Jive Software, Mitel Networks, Citrix Systems, Inc., BroadSoft, Inc., HighQ Solutions Limited, Atlassian Corporation Plc, Asana, Inc., Slack Technologies, Box, Inc., Dropbox, Inc., Zoho Corporation, Notion Labs, Inc., Monday.com Ltd., Trello |
Frequently Asked Questions
Ans: North America held the largest share at 39% in 2025, driven by advanced infrastructure, high R&D spending, and strong technology leadership.
Ans: The software segment led with a 63% share in 2025 due to scalability, integration capabilities, and support for complex research workflows.
Ans: Increasing demand for real-time data sharing, remote innovation management, and cross-border research collaboration is significantly boosting the R&D Cloud Collaboration Market.
Ans: In 2025, the R&D Cloud Collaboration Market was valued at USD 56.77 billion, reflecting strong adoption across industries and global research ecosystems.
Ans: The market is projected to grow at a CAGR of 11.35% from 2026 to 2035, driven by rising global R&D collaboration needs.
Get in Touch
