Next Generation Display Market Report Scope & Overview:
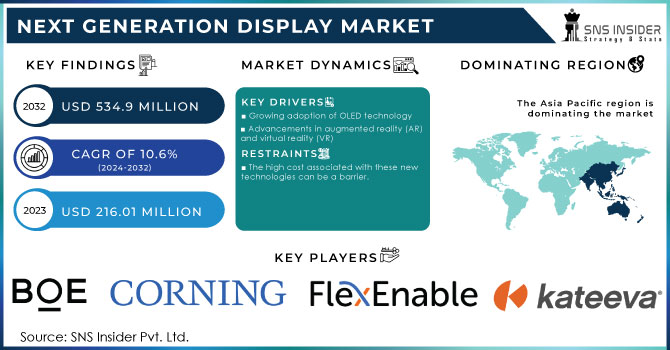
The Next Generation Display Market was valued at USD 208.08 billion in 2023 and is expected to reach USD 417.61 billion by 2032, growing at a CAGR of 8.09% over the forecast period 2024-2032.Next generation display market is achieving fast technology penetration as various advanced display technologies like OLED, QD, and flexible displays are increasingly being integrated into different devices. Application-wise market share analysis reveals notable adoption across consumer electronics, automotive, and advertising sectors as the demand for high-performance visuals propels innovation in this space. With the rising interest in immersive, high-definition experiences particularly with home entertainment and mobility, consumer sentiment is also aligned. By device type, there is a clear movement to include next-gen displays in smartphones, TVs, wearables, and automotive displays that utilize significantly improved color performance, more power-efficient displays, and improved flexibility and ruggedness
Get more information on Next Generation Display Market - Request Sample Report
Market Dynamics
Key Drivers:
-
Rising Consumer Demand and Technological Advancements Fuel Growth in Next Generation Display Market
The demand for high-quality display experiences in televisions, smartphones, and gaming devices is increasing among consumers, demanding vibrant, high-definition displays. In addition, the presence of 4K and 8K displays in consumer electronics, as well as flexible and lightweight displays, which are becoming increasingly common in applications such as foldable displays, are driving the market. Technological advancements in display technology, particularly the increase in the utilization of Quantum Dots and Carbon Nanotubes are key influencing factors driving the Next Generation Display Market segment.
Restrain:
-
High Manufacturing Costs and Environmental Concerns Challenge Growth of Next Generation Display Market
One of the primary restraints is the high manufacturing cost of QDs, CNTs, OLED displays, etc. Such expenses can impose a severe burden on the overall cost of end-user commercial goods, which can act as a major barrier to the commercialization of such technologies, especially in low-cost markets. Also, it raises the cost of operation due to complicated production and integration processes, especially for new materials such as CNTs. This could present challenges for small and mid-sized firms trying to gain entry to the market and compete with incumbents. In addition to this, the production of display technologies could use hazardous materials and therefore the resulting E-waste may pose environmental dangers as such, the market will also be burdened by concerns about sustainability and environmental impacts.
Opportunity:
-
Significant Growth Opportunities in Automotive Industrial Applications and Advertising Drive Next Generation Display Market
The next decade presents significant opportunities for growth, especially with automotive, industrial applications, and advertising. The growing automotive focus on in-car displays, augmented reality dashboards, and smart rearview mirrors is another major area for new advanced displays. Better durability and flexibility are required for displays in industrial applications like wearable tech and smart factories. Consumer electronics has been driving up demand for digital billboards and interactive advertising displays, especially as technologies like OLED and microLED become less experimental.
Challenges:
-
Technology Limitations and Competition from Traditional Displays Hinder Growth of Next Generation Display Market
In the next-generation display market, challenges over technology limitations exist in various types of display technologies. For Quantum Dots, the image quality advantage is offset by potential screen burn-in and limited life for certain materials, well-known obstacles to ubiquitous adoption for OLED displays. More importantly, display technology has yet to come to a common ground for effective communication between devices. The competition from traditional (non-league) display technologies such as LCDs and OLEDs, providing more affordable alternatives, also slows down the transition to newer generation displays in certain regions.
Segment Analysis
By Ingredients
In 2023, Quantum Dots led the display market due to their excellent performance characteristics, having maintained a 46.7% share. Improved color performance, brightness, and energy efficiency are some features that have pushed them into consumer electronics for HD, 4K, and 8K displays easing into TVs, smartphones, and monitors. Quantum dots are another asset that is leading to higher market volumes within the OLED display manufacturing sector. With a surge in large display manufacturing owing to increased demand in the consumer world, the ability of QDs to emit bright, true-to-nature colors at relatively lower power levels suits individual consumer needs as well.
Carbon Nanotubes are expected to witness the fastest growth in the Next Generation Display Market from 2024 to 2032 because CNTs possess some unique properties like high electrical conductivity, mechanical strength, and flexibility as a result, they are rapidly being utilized for producing next generation flexible displays. These properties render CNTs exceptional candidates for flexible and foldable displays that are predicted to witness wide-scale adoption within the next few years. CNTs also harbors prospects for use in better touchscreens and transparent conductive films providing numerous opportunities in the consumer electronics, automotive, and advertising industries.
By Display Technology
In 2023, LCD (Liquid Crystal Display) dominate, capturing a considerable 56.8% share of the display market. LCD's widespread adoption owes to its low manufacturing cost, mature production technology, and broad applicability in consumer products, such as televisions and smartphones, as well as in industrial and automotive displays. More than the price when it comes to manufacturing, up until very recently, manufacturers have preferred the low production costs of LCD technology over newer and better technologies like OLED, thus reserving LCD for the budget-conscious consumer and consumer business.
OLED (Organic Light Emitting Diode) displays are forecast to grow with the highest CAGR from 2024 to 2032. OLED gives you a better image, with a higher contrast ratio, richer colors, and better refresh rates than LCD. In addition, OLED is thinner and more flexible than its LCD counterpart, paving the way for future opportunities in new markets such as foldable smartphones, wearables, and automotive displays. OLED has always shone in the high-end television category, and as the consumer demand moves toward increased quality of life, more premium products with better viewing experience will be in demand, paving the way for OLED for quick acceptance on larger scales high-end TVs, gaming monitors, and most mobile devices
By Application
The Consumer Electronics segment accounted for 34.3% in 2023, owing to the continued demand for high-definition televisions along with smartphones, tablets, and gaming devices. The latest advancements in display technologies such as Quantum Dots, OLED, and LCD technologies have improved the consumer viewing experience thereby aiding the wider proliferation of premium devices. Rising demand for 4K & 8K displays and other flexible & foldable displays also compromised a greater share of the market. Furthermore, this segment continues to be driven by the ubiquitous nature of consumer electronics with a large consumer base.
The Industrial Applications segment is expected to witness the fastest CAGR growth from 2024 to 2032. The increase is mainly driven by a greater use of cutting-edge displays in industries such as manufacturing, healthcare, logistics, and wearables. The requirement for displays in industrial settings that are robust, flexible, and energy efficient is increasing in smart factories, wearable devices, and automation systems. Moreover, the demand for augmented reality (AR) and virtual reality (VR) displays for industrial training and operations is also adding to the rapid growth of this segment.
By End Use
The Personal Use segment accounted for 45.8% of the market in 2023. This is mainly fueled by the increased deployment of the latest display devices in consumer electronics such as smartphones, TVs, laptops, and wearables. However, with consumers thirsty for high-quality visual experiences, the need for better color accuracy, higher resolutions (4K, 8K), and energy efficiency in displays has spilled into the latter realm. In addition, the expansion of smart devices and home entertainment systems has also strengthened the said segment as the leader of the paper since they are intended for use above the individual level on every continent.
The Commercial Use segment is forecast to see the highest CAGR between 2024 and 2032. The use of advanced display technologies in sectors like retail, advertisement, corporate and public information systems have become more advanced over the years and this explains the growth as well. So, interactive digital signage, large-scale video walls, and Augmented Reality (AR) apps are becoming popular for use in commercial ones to offer new ways for customers to be engaged and enjoyed message communication.
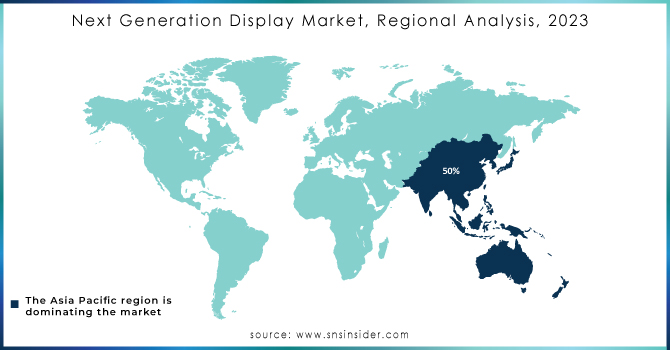
Regional Analysis
In 2023, the Asia Pacific led the market and accounted for a 34.3% share of the production. This market growth can be attributed to the presence of major manufacturing hubs and strong consumer demand. Next-gen display nations China, Japan, So. Korea, India China are specifically a frontrunner in display panel manufacturing, leading to numerous LCD, OLED, and Quantum Dot displays for smartphones along with televisions and consumer electronics. A place where OLED & QD already exist: South Korea (Samsung & LG) Demand for high-quality displays spans various sectors, from automotive to gaming, driven largely by Japan’s advanced manufacturing electronics industries.
North America is projected to be the region with the highest CAGR growth from 2024-2032, thanks to advancements in technology, as well as the high popularity of various applications, such as automotive, healthcare, and entertainment. OLED display adoption is a major trend in high-end smartphones, and the adoption of OLED for smart TVs and digital signage in the region is another key driver. With the presence of companies such as Apple, Tesla, and other tech giants implementing innovative display technologies in their devices, this region is expected to carry out promising growth shortly. In addition, the adoption of AR/VR applications in commercial, education, and healthcare will propel the display market over the forecast timeline.
Need any customization research on Next Generation Display Market - Enquiry Now
Key players
Some of the major players in the Next Generation Display Market are:
-
Samsung Display (Galaxy S23 Ultra, Odyssey G9 Monitor)
-
LG Display (OLED evo C2 Series, UltraGear Gaming Monitor)
-
BOE Technology (Xiaomi Mi MIX 4 Display, Huawei MatePad Pro Display)
-
Japan Display (Sony Xperia 1 IV Display, Nintendo Switch Display)
-
Corning Inc. (Gorilla Glass, Lotus Glass)
-
Sony Corporation (Bravia XR A90J OLED TV, Xperia 1 III Smartphone)
-
TCL Technology (6-Series QLED TV, 10 Pro Smartphone)
-
Hisense (U8H ULED TV, U6H ULED TV)
-
Sharp Corporation (Aquos R6 Smartphone Display, 8K TV Display)
-
AU Optronics (AMOLED Panels for Smartphones, 4K UHD Monitors)
-
Innolux Corporation (LCD Panels for TVs, Touch Panels for Laptops)
-
E Ink Holdings (E Ink Carta HD, E Ink Prism)
-
BOE Varitronix (Automotive Displays, Industrial Displays)
-
Visionox Technology (Flexible AMOLED Displays, In-Display Fingerprint Sensors)
-
EverDisplay Optronics (AMOLED Panels for Smartphones, Wearable Device Displays)
Recent Trends
-
In July 2024, Samsung Display's next-gen OLED technology enhances Krafton's upcoming game, inZOI, by featuring virtual versions of its innovative products, including foldable and rollable displays.
-
In January 2025, LG Display unveiled its fourth-generation OLED panel, optimized for the AI era, featuring 4,000 nits’ brightness and improved color performance.
-
In October 2024, Chinese display panel makers, including BOE and Visionox, unveiled new flexible OLED technologies, targeting flagship smartphones and wearable devices.
| Report Attributes | Details |
|---|---|
| Market Size in 2023 | USD 208.08 Billion |
| Market Size by 2032 | USD 417.61 Billion |
| CAGR | CAGR of 8.09% From 2024 to 2032 |
| Base Year | 2023 |
| Forecast Period | 2024-2032 |
| Historical Data | 2020-2022 |
| Report Scope & Coverage | Market Size, Segments Analysis, Competitive Landscape, Regional Analysis, DROC & SWOT Analysis, Forecast Outlook |
| Key Segments | • By Ingredients (Quantum Dots, Other Nanomaterials, Carbon NanoTubes (CNT)) • By Display Technology (OLED Display, LCD, LED Display Technology, E-Ink) • By Application (Consumer Electronics, Industrial Applications, Movie/Entertainment, TV/Monitors, Automotive, Advertising, E-Reader) • By End Use (Personal Use, Commercial Use, Industrial Use) |
| Regional Analysis/Coverage | North America (US, Canada, Mexico), Europe (Eastern Europe [Poland, Romania, Hungary, Turkey, Rest of Eastern Europe] Western Europe] Germany, France, UK, Italy, Spain, Netherlands, Switzerland, Austria, Rest of Western Europe]), Asia Pacific (China, India, Japan, South Korea, Vietnam, Singapore, Australia, Rest of Asia Pacific), Middle East & Africa (Middle East [UAE, Egypt, Saudi Arabia, Qatar, Rest of Middle East], Africa [Nigeria, South Africa, Rest of Africa], Latin America (Brazil, Argentina, Colombia, Rest of Latin America) |
| Company Profiles | Samsung Display, LG Display, BOE Technology, Japan Display, Corning Inc., Sony Corporation, TCL Technology, Hisense, Sharp Corporation, AU Optronics, Innolux Corporation, E Ink Holdings, BOE Varitronix, Visionox Technology, EverDisplay Optronics. |
Frequently Asked Questions
Ans: Asia Pacific dominated the Next Generation Display Market in 2023.
Ans: The LCD segment dominated the Next Generation Display Market in 2023.
Ans: The major growth factor of the Next Generation Display Market is the increasing demand for high-quality, energy-efficient, and innovative display technologies in consumer electronics, automotive, and industrial applications.
Ans: Next Generation Display Market size was USD 208.08 billion in 2023 and is expected to Reach USD 417.61 billion by 2032.
Ans: The Next Generation Display Market is expected to grow at a CAGR of 8.09% during 2024-2032.
Get in Touch
