Hand Geometry Biometrics Market Size Analysis:
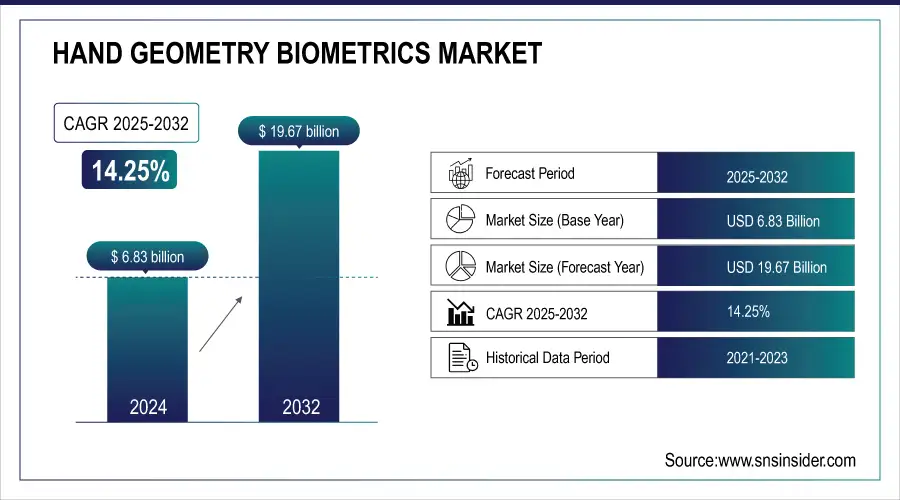
The Hand Geometry Biometrics Market Size was valued at USD 6.83 billion in 2024 and is expected to reach USD 19.67 billion by 2032 and grow at a CAGR of 14.25% over the forecast period 2025-2032.
The global Hand Geometry Biometrics Market is witnessing tremendous growth due to the growing need for secure, contactless authentication solutions in different industries. The growth of biometric technology, increased security needs, and the demand for effective access control systems are driving market growth. The market is likely to keep evolving with new developments and increased adoption in industries such as healthcare, banking, and government.
Fujitsu introduced the PalmSecure Authentication Library Millions Edition, enabling authentication of up to 10 million individuals using palm vein authentication, 50 times more than previous versions. This system maintains high accuracy with a 0.01% false rejection rate and is suitable for large-scale applications like payment and transportation.
To Get more information on Hand Geometry Biometrics Market - Request Free Sample Report
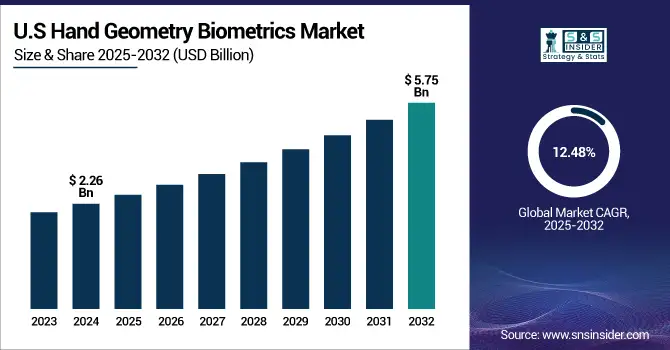
The U.S. Hand Geometry Biometrics Market size was USD 2.26 billion in 2024 and is expected to reach USD 5.75 billion by 2032, growing at a CAGR of 12.48% over the forecast period of 2025–2032.
The U.S. Hand Geometry Biometrics Market is set to experience tremendous growth, driven by the growing use of biometric solutions in different industries. With organizations focusing on secure access control and identity verification, hand geometry biometrics are becoming increasingly popular because of their accuracy and reliability. The market is set to experience high demand, especially in industries like healthcare, government, and banking.
Hand Geometry Biometrics Market Dynamics
Key Drivers:
-
Rising Security Concerns and Increasing Demand for Contactless Authentication Solutions Accelerate Market Growth.
The increased focus on security across industries like government, healthcare, and finance is propelling the demand for accurate and contactless biometric authentication. Hand geometry biometrics are increasingly in vogue as they can authenticate people accurately and in a quick manner without any physical contact. Not only does the technology provide increased security but also facilitates the automation of access control and identity verification procedures, thus being increasingly used in private as well as public sectors.
According to research, UPM developed a contactless hand geometry system for smartphones, achieving 98% accuracy and near-zero false acceptance, verifying users within 2 seconds without additional hardware or flat surfaces.
Restrain:
-
Technological Limitations and Incompatibility with Existing Security Systems Restrict Market Growth.
Hand geometry biometric devices are also prone to compatibility issues when interfacing with legacy or other security solutions, and these can be costly upgrades or custom integrations. The units also become less scalable, with organizations experiencing a hassle to scale their biometric solution harmoniously as they expand. The systems can also be technically demanding to implement and maintain, again raising operational costs and complexity.
Opportunities:
-
Advancements in Artificial Intelligence and Integration with Other Biometric Technologies Open New Growth Avenues for Hand Geometry Biometrics.
The combination of artificial intelligence (AI) and hand geometry biometrics holds great promise to improve the efficiency and accuracy of the technology. AI has the ability to better optimize the recognition algorithms, enabling the systems to be faster and more responsive to varying environmental factors. Further, the union of hand geometry biometrics with other modalities such as facial identification or fingerprint reading can deliver multi-faceted security solutions, which will be attractive to industries demanding highly secure, versatile authentication systems.
In October 2024, researchers introduced a hand geometry recognition method using Dempster-Shafer theory, achieving a 99.5% identification rate and 0.625% false acceptance with 201 subjects, improving accuracy without pose constraints.
Challenges:
-
Privacy Concerns and Regulatory Compliance Issues Pose Significant Barriers to the Widespread Adoption of Hand Geometry Biometrics.
Managing sensitive biometric data needs to be done under privacy laws and regulations, including GDPR and CCPA. Non-compliance of data protection laws can lead to legal liabilities, lack of consumer trust, and even data breach. Leveraging secure data storage and use still becomes essential for organizations to function in challenging compliance waters. Also, businesses need to audit their systems on an ongoing basis and update their protocols to keep up with changing regulations to ensure they are handling data correctly and not leaving themselves open to costly breaches and legal punishments.
Hand Geometry Biometrics Market Segment Analysis:
By Technology Type
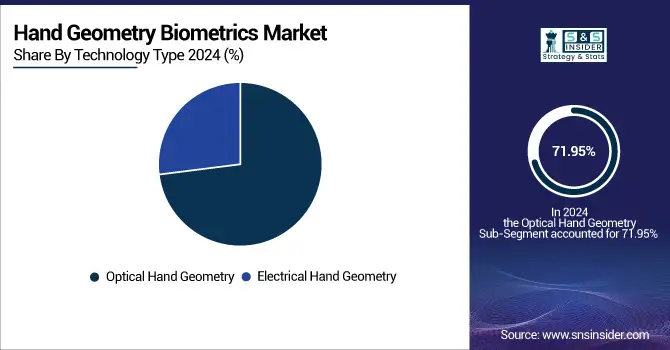
The Optical Hand Geometry segment dominated the highest revenue share of 71.95% in 2024 due to its popularity owing to its precision and non-invasive approach. Hand geometry biometrics companies such as ZK Teco and Suprema have widened their product portfolios with high-end optical hand geometry readers, incorporating AI for improved recognition. The technology's dominance mirrors the overall Hand Geometry Biometrics Market growth, providing secure access control solutions in industries such as healthcare, finance, and government.
The Electrical Hand Geometry segment is growing very quickly, having the fastest CAGR of 15.67% during 2025-2032. The growth is spurred by emerging sensor technologies and the need for more secure, multi-purpose biometric systems. Firms such as M2SYS Technology and Crossmatch are spearheading the innovations, embedding electrical sensors to provide quicker, more precise authentication. Consequently, this technology will be a major contributor to the developing Market, particularly in security-critical usage.
By End Use
The Government segment dominated with the highest hand geometry biometrics market share of 35.95% in 2024 fueled by demand for safe identification systems to be used in national security, border management, and law enforcement. Firms like Fingerprint Cards and Virdi have come up with niche hand geometry biometric products specifically for use in government institutions. This growth follows that of the total Hand Geometry Biometrics Market as governments around the world invest in more efficient and secure forms of access control to guard critical infrastructure and sensitive information.
The Healthcare segment is expected to expand at the fastest CAGR of 15.69% from 2025 to 2032, due to growing demand for secure and accurate patient identification systems. Integrated Biometrics and IDEMIA are some of the players that have introduced hand geometry biometrics solutions specifically tailored for healthcare facilities to ensure patient data security and enhance operational efficiency. This fast growth mirrors the broader hand geometry biometrics market trends, with healthcare organizations making identity authentication and secure access to sensitive medical data a priority.
By Application
The Physical Access Control segment dominated with the highest revenue share of 64.33% in 2024 led by increasing demand for secure entry solutions in high-security facilities. Firms such as Crossmatch and Suprema have developed hand geometry biometric systems for access control, providing better security in institutions such as government facilities, corporate offices, and data centers. This expansion corresponds with the Market's total growth, wherein institutions and companies focus on secure and trusted physical access control systems.
The Logical Access Control segment is expected to expand at the fastest of CAGR of 15.42% between 2025 and 2032. Organizations like Anviz Global and SecuGen are developing hand geometry biometric systems for secure network and IT infrastructure access. With increasing cybersecurity issues, the use of hand geometry biometrics for digital verification is likely to fuel the Hand Geometry Biometrics Market, providing increased security for organizational data and systems.
By Product Type
The Standalone Hand Geometry Readers segment dominated the highest market share of 52.99% in 2024 due to their common usage as they are easy to integrate, inexpensive, and sure to work with secure access control. The growth of this segment is associated with the overall Market, in which standalone readers are more likely to be selected for simplicity and effectiveness in the healthcare, government, and corporate sectors with the perfect solution for identity authentication and physical access control.
Integrated Hand Geometry Systems segment is expanding at the fastest CAGR of 14.90% during 2025-2032, which is a result of increasing demand for sophisticated biometric systems that integrate various security features into a single solution. The growth of this segment is associated with the Hand Geometry Biometrics Market's transformation toward more advanced all-in-one solutions, as integrated systems are more scalable, have faster processing, and offer higher levels of security, thereby they are preferable for high-security installations and mass deployments.
Hand Geometry Biometrics Market Regional Outlook:
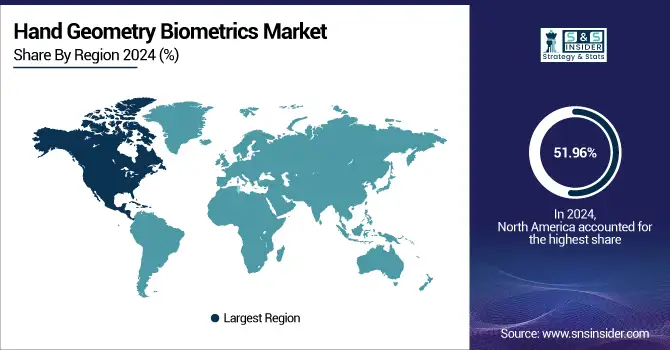
North America dominated the Hand Geometry Biometrics Market with the highest revenue share of 51.96% in 2024 with increasing demand for sophisticated security systems in government, healthcare, and corporate sectors. The companies here have been rolling out new hand geometry biometric solutions, riding the wave of the demand for more advanced access control and identification verification systems. This dominance is commensurate with the general expansion of the Market, where North America is the dominant adopter of biometric security technologies.
Get Customized Report as per Your Business Requirement - Enquiry Now
-
The U.S. leads the North American Market with its sophisticated technological infrastructure, strong demand for security solutions, and extensive use of biometrics across industries like government, healthcare, and finance, fueling robust market growth.
The Asia Pacific region is expected to the fastest CAGR of 15.81% during the forecast period of 2025-2032 due to the rising economies in the region, which are increasingly focusing on security and biometric solutions for different industries. Asian Pacific companies are increasingly releasing hand geometry biometric systems that are specifically designed for different applications like physical access control and secure identification. The expansion in this area is consistent with the overall Market pattern, where demand for biometric solutions is increasing on account of rising security concerns and advancements in technology.
-
China leads the Asia Pacific Market owing to its accelerated technological growth, widespread use of biometric systems in government and commercial sectors, and robust investments in security infrastructure, fueling high growth in the biometric solutions market.
Europe's Market is growing exponentially due to the rise in security threats and robust regulations in government, healthcare, and finance sectors. Germany, France, and the UK are leading the pack when it comes to implementing biometric solutions in access control, identity verification, and time management. Technological progress and robust data privacy regulations are driving market growth further.
-
Germany leads the market in Europe owing to its technologically advanced infrastructure, strong demand for security solutions and leading the market in biometric technology. Tough rules on data protection and security in areas such as government and health have also helped Germany solidify its position in the market.
The UAE and Saudi Arabia dominated in the Middle East & Africa Market due to increasing security requirements, government policies, and large-scale infrastructure schemes. Brazil dominates the market in Latin America due to increasing demand for biometric solutions across government, finance, and healthcare sectors, which drives market growth.
Hand Geometry Biometrics Companies are:
Major Key Players in Hand Geometry Biometrics Market are NEC Corporation, Fujitsu Limited, 3M Cogent, Inc., Safran S.A., Suprema Inc., Crossmatch Technologies, Inc., HID Global Corporation, Thales Group, Siemens AG, Fingerprint Cards AB.
Recent Development:
-
September 2024, NEC launched a biometric authentication system capable of quickly identifying large numbers of people in motion, enhancing efficiency in crowded environments like airports and amusement parks.
-
December 2024, Thales Cogent introduced fingerprint scanners capable of capturing flat fingerprints, slap fingerprints, and palm prints, enhancing biometric data collection for various applications.
| Report Attributes | Details |
|---|---|
| Market Size in 2024 | USD 6.83 Billion |
| Market Size by 2032 | USD 19.67 Billion |
| CAGR | CAGR of 14.25% From 2025 to 2032 |
| Base Year | 2024 |
| Forecast Period | 2025-2032 |
| Historical Data | 2021-2023 |
| Report Scope & Coverage | Market Size, Segments Analysis, Competitive Landscape, Regional Analysis, DROC & SWOT Analysis, Forecast Outlook |
| Key Segments | • By Technology Type (Optical Hand Geometry, Electrical Hand Geometry) • By End Use (Government, Banking and Financial Services, Healthcare, Education, Transportation) • By Application (Physical Access Control, Logical Access Control) • By Product Type (Standalone Hand Geometry Readers, Integrated Hand Geometry Systems) |
| Regional Analysis/Coverage | North America (US, Canada, Mexico), Europe (Germany, France, UK, Italy, Spain, Poland, Turkey, Rest of Europe), Asia Pacific (China, India, Japan, South Korea, Singapore, Australia, Taiwan, Rest of Asia Pacific), Middle East & Africa (UAE, Saudi Arabia, Qatar, South Africa, Rest of Middle East & Africa), Latin America (Brazil, Argentina, Rest of Latin America) |
| Company Profiles | NEC Corporation, Fujitsu Limited, 3M Cogent, Inc., Safran S.A., Suprema Inc., Crossmatch Technologies, Inc., HID Global Corporation, Thales Group, Siemens AG, Fingerprint Cards AB. |
Frequently Asked Questions
Ans: North America dominated the Hand Geometry Biometrics Market in 2024.
Ans: Optical Hand Geometry segment dominated the Hand Geometry Biometrics Market.
Ans: The major growth factor of the Hand Geometry Biometrics Market is the increasing demand for secure and efficient access control solutions.
Ans: The Hand Geometry Biometrics Market size was USD 6.83 billion in 2024 and is expected to reach USD 19.67 billion by 2032.
Ans: The Hand Geometry Biometrics Market is expected to grow at a CAGR of 14.25% from 2025-2032.
Get in Touch
