Next Imaging Technology Market Report Scope & Overview:
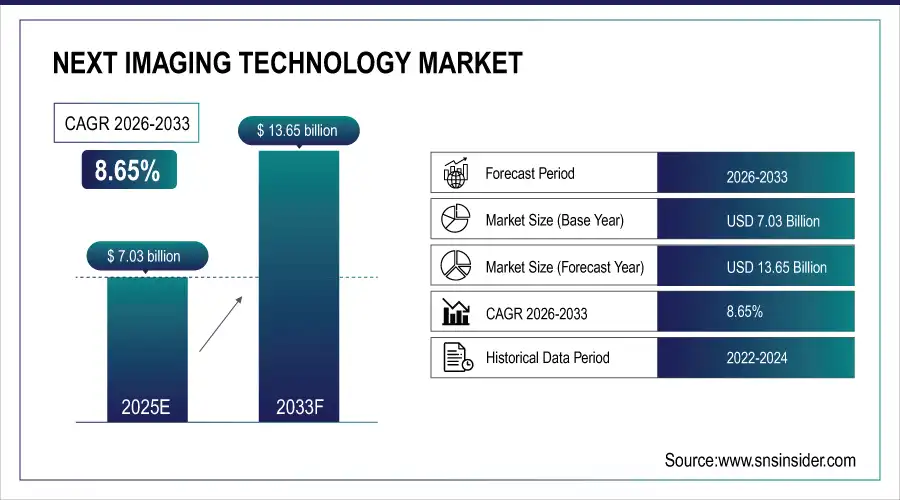
The Next Imaging Technology Market was valued at USD 7.03 billion in 2025E and is expected to reach USD 13.65 billion by 2033, growing at a CAGR of 8.65% from 2026-2033.
The Next Imaging Technology Market is experiencing significant growth driven by advancements in AI-powered diagnostic systems, increased demand for high-speed, high-resolution imaging, and a strong shift toward sustainable solutions. Dual-AI engine integration and zero-click workflow automation has revolutionized MRI efficiency to be significantly faster, sharper imaging resulting in unequivocal diagnostic confidence. Helium-free systems address the commitment of the industry to sustainability and provide a path for reduced long-term operating expenses.
On February 26, 2025, Philips unveils dual-AI engine SmartSpeed Precise for up to X3 faster MRI scans and images that are 80% more) The helium-free 1.5T BlueSeal scanner and AI-driven MR Workspace R12 optimize diagnostic quality, productivity, and sustainability across all global MRI systems.
Next Imaging Technology Market Size and Forecast
-
Market Size in 2025E: USD 7.03 Billion
-
Market Size by 2033: USD 13.65 Billion
-
CAGR: 8.65% from 2026 to 2033
-
Base Year: 2025E
-
Forecast Period: 2026–2033
-
Historical Data: 2022–2024
To Get more information On Next Imaging Technology Market - Request Free Sample Report
Next Imaging Technology Market Trends
-
Rising demand for advanced imaging solutions in healthcare, defense, and industrial applications is driving the next imaging technology market.
-
Growing adoption of AI, machine learning, and computational imaging is enhancing image quality and analysis capabilities.
-
Expansion of 3D imaging, hyperspectral imaging, and multisensor systems is boosting market growth.
-
Increasing focus on early diagnosis, precision medicine, and non-destructive testing is shaping adoption trends.
-
Advancements in high-resolution sensors, real-time processing, and cloud-based imaging platforms are improving efficiency and accessibility.
-
Rising investments in R&D and technology commercialization are supporting market expansion.
-
Collaborations between imaging technology providers, research institutions, and industry players are accelerating innovation and global deployment.
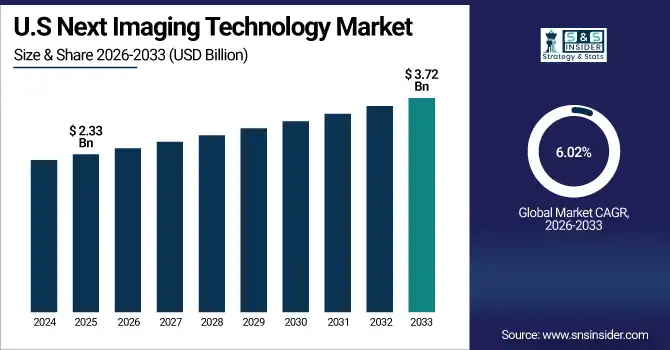
The U.S. Next Imaging Technology Market was valued at USD 2.33 billion in 2025E and is expected to reach USD 3.72 billion by 2033, growing at a CAGR of 6.02% from 2026-2033. Next Imaging Technology Market growth is due to increased adoption of AI-based imaging systems, growing functional and anatomical diagnostic applications, as well as improvement in MRI, CT, and optical imaging technologies. In this regard, the rapid transformation to sustainable and helium-free imaging solutions; workflow automation; and high-resolution visualization is streamlining clinical workflow and improving patient outcomes.
Next Imaging Technology Market Growth Drivers:
-
Rising Need for High-Precision Eye Tracking Accelerates Adoption of Advanced 3D Imaging Technologies
Rise in Demand for Advanced 3D Imaging Technologies that enables Efficient Eye-tracking Systems RTLU Traditional approaches that use less data points are not good enough for the new scenarios coming from fields such as virtual and augmented reality, automotive driver monitoring, medical diagnostics or behavior sciences. In recent years, some advanced imaging solutions have provided dense real-time surface data from the eye which has greatly improved gazes detection accuracy and consistency. This level of precision improves the experiences for more natural and responsive human–machine interfaces.
April 1st, 2025: A new deflectometry-based 3D imaging approach for ultra-high-precision attention tracking in future AR/VR design enviroments was discovered originating from researchers at the University of Arizona.
Next Imaging Technology Market Restraints:
-
High Costs and System Complexity Limit Widespread Adoption of Next Imaging Technologies
Despite their potential, the high cost and complexity of next imaging technologies pose significant restraints to market growth. Advanced imaging systems often require sophisticated hardware, high-performance computing infrastructure, and specialized software integration, making them financially unfeasible for many mid- and small-scale healthcare and industrial facilities. Additionally, the need for trained personnel to operate and interpret outputs from these systems further raises implementation barriers. Integration into existing workflows can also be challenging due to compatibility issues and lengthy calibration processes. These technical and financial hurdles slow the rate of adoption, particularly in developing regions, limiting the scalability and accessibility of cutting-edge imaging solutions across various industries and reducing their overall market penetration.
Next Imaging Technology Market Opportunities:
-
Breakthroughs in Real-Time Battery Imaging Unlock Opportunities for Next-Gen Energy Storage Solutions
Advancements in real-time, high-resolution imaging techniques are creating major opportunities in the Next Imaging Technology Market, particularly in energy storage research. The development of methods like electrified cryogenic electron microscopy (eCryoEM) enables scientists to observe electrochemical reactions during battery operation at sub-wavelength resolution. The breakthrough offers much-needed illumination on the behaviour of lithium-metal batteries, including how quickly corrosion layers form and what effects this has on performance and longevity. Imaging solutions which are capable of providing precise time-resolved diagnostics are assisting in developing better and longer lasting batteries. This could lead to new possibilities in electric vehicles, portable electronics and grid-scale storage, which require higher energy densities and stability.
On June 13, 2025, The lithium metal battery in this eCryoEM imaging technique from UCLA researchers at days zero (left), two (center), and five (right) shows the corrosion layer with time, presenting opportunities for how to potentially elongate battery lifespans.
Next Imaging Technology Market Challenges:
-
Technical Limitations and Data Processing Demands Challenge Next Imaging Technology Adoption
The Next Imaging Technology Market faces key challenges related to technical complexity, data volume, and integration barriers. High-resolution imaging systems generate massive datasets that require advanced computing infrastructure and real-time processing capabilities, which many institutions lack. Additionally, developing algorithms that can accurately interpret imaging outputs across various applications—such as medical diagnostics, energy systems, or industrial inspection—remains a significant hurdle. Ensuring cross-platform compatibility, standardization, and secure data handling adds further complexity. Moreover, limitations in hardware miniaturization and imaging in dynamic or harsh environments restrict widespread deployment.
Next Imaging Technology Market Segment Analysis
By Type
In 2025, the CMOS Imaging segment accounted for approximately 44% of the Next Imaging Technology Market share, expected to experience the fastest growth over 2025-2032 with a CAGR of 13.69%. Rising demand for compact, energy-efficient, and high-resolution imaging sensors in consumer electronics, automotive advanced driver assistance systems (ADAS), medical imaging devices, and industrial automation is the key push behind this growth. This segment is being helped by sensor technology being more advanced than ever, ability to leverage AI capabilities and increased usage in low-light and high speed-imaging applications.
By Technique
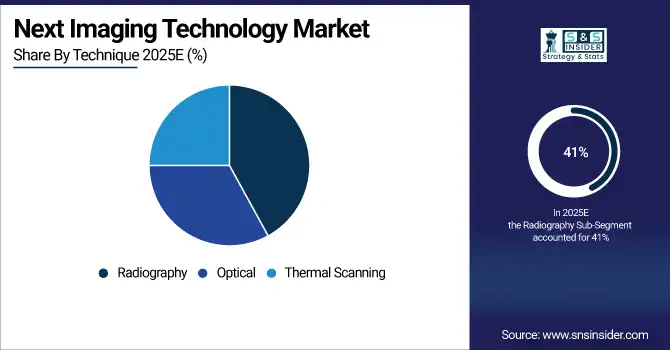
In 2025, the Radiography segment accounted for approximately 41% of the Next Imaging Technology Market share, driven by its widespread use in medical diagnostics, industrial inspection, and security screening. The segment continues to grow due to rising demand for non-invasive imaging, digital X-ray systems, and real-time radiographic solutions that offer enhanced clarity and faster processing. Technological advancements such as AI integration, flat-panel detectors, and portable radiography units are further expanding its adoption across healthcare and non-healthcare applications.
The Optical segment is expected to experience the fastest growth in Next Imaging Technology Market over 2026-2033 with a CAGR of 12.37%, This growth is fueled by rising adoption in biomedical imaging, remote sensing, and machine vision systems. Advancements in lens technology, photonic sensors, and light-based scanning methods are enhancing image resolution and detection accuracy. Additionally, increasing demand for compact, real-time, and non-contact imaging solutions across healthcare, defense, and industrial sectors is accelerating the segment’s expansion.
By Application
In 2025, the Healthcare segment accounted for approximately 31% of the Next Imaging Technology Market share, expected to experience the fastest growth in over 2025-2032 with a CAGR of 10.50%. This is primarily attributed to increasing demand for improved diagnostic tools, AI integrated imaging systems and early disease diagnosis services. MRI, CT and optical imaging advances allow for more accurate diagnosis and better care of patients. The Rise in Increased Investment in Medical Infrastructure and the Move to Personalized Healthcare Will Further Propel Market Growth.
By End-User Industry
In 2025, the Consumer Electronics segment accounted for approximately 27% of the Next Imaging Technology Market share, experience the fastest growth in Next Imaging Technology Market over 2026-2033 with a CAGR of 11.37%. This growth is driven by increasing integration of advanced imaging sensors in smartphones, tablets, AR/VR headsets, and smart home devices. Demand for high-resolution cameras, facial recognition, gesture control, and immersive user experiences is accelerating innovation. Miniaturization, AI-enhanced image processing, and multi-sensor integration are further fueling adoption across consumer applications.
Next Imaging Technology Market Regional Analysis
North America Next Imaging Technology Market Insights
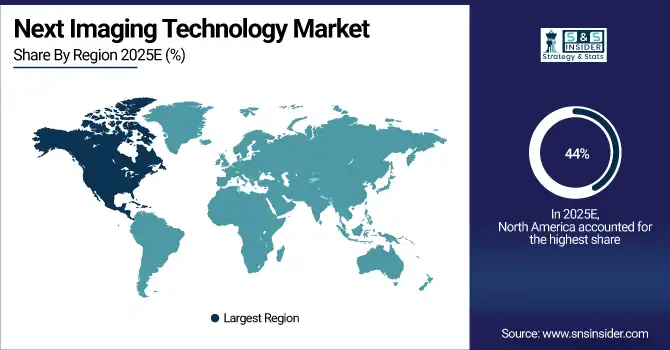
In 2025 North America dominated the Next Imaging Technology Market and accounted for 44% of revenue share, due its pace of investment in research and development, early adoption of advance imaging technology and well-established presence of key industry players. There is significant demand in healthcare, defense, consumer electronics, and industrial automation sectors in the region. The market growth in North America can be accredited to government funding for medical and scientific imaging, along with rapid integration of AI and 3D imaging solutions.
Get Customized Report as per Your Business Requirement - Enquiry Now
Asia Pacific Next Imaging Technology Market Insights
Asia-Pacific is expected to witness the fastest growth in the Next Imaging Technology Market over 2026-2033, with a projected CAGR of 10.34% because of rapid industrialization, improving healthcare infrastructure and increased development and demand for advanced imaging in consumer electronics and automotive industries. Increased uptake is driven by government push in AI integration and smart manufacturing initiatives Furthermore, surging R&D outlays and tech-savvy populations, escalating presence of economies such as China, India as well as South Korea are aiding the regional market to expand more rapidly.
Europe Next Imaging Technology Market Insights
In 2025, Europe emerged as a promising region in the Next Imaging Technology Market, supported by gradual advancements in healthcare, industrial automation, and security applications. Growing investments in medical imaging infrastructure, increasing adoption of smart devices, and rising awareness of early diagnostics are driving demand. While market penetration remains lower compared to developed regions, ongoing digital transformation, government initiatives, and collaborations with global technology providers are fostering gradual uptake. These regions present untapped opportunities for imaging technology expansion.
Middle East & Africa and Latin America Next Imaging Technology Market Insights
Latin America (LATAM) and the Middle East & Africa (MEA) regions are witnessing steady growth in the Next Imaging Technology Market, owing growing investments in health care, urban security and industrial progress. Increasing uptake of advanced imaging tools across diagnostic centers, public safety systems and infrastructure projects While budget constraints and slower adoption of technology are likely to constrain the size of the prize, enabling government policies stand to facilitate access to markets through partnership with global players. This represents exciting opportunities for growth in the future as we move more and more into a digital-first world.
Next Imaging Technology Market Competitive Landscape:
Samsung Electronics Co., Ltd.
Samsung Electronics drives innovation in semiconductor imaging for smartphones, consumer devices, and industrial applications. The company’s ISOCELL and mobile CMOS sensors emphasize high resolution, AI-enhanced image processing, and superior dynamic range. Samsung integrates imaging solutions across flagship devices, leveraging proprietary controllers, advanced V-NAND, and next-generation fabrication nodes. The firm targets mobile photography, automotive AI imaging, and enterprise applications, focusing on performance, low-power operation, and integration of AI for advanced computational photography.
-
2025 – Samsung expanded its mobile imaging portfolio, including OMNIVISION OV50X 50 MP sensor, supporting high-end smartphones with improved dynamic range and cinematic capture.
-
2024 – Samsung launched ISOCELL HP9, GNJ, and JN5 sensors, enhancing smartphone camera performance with better color reproduction and high-dynamic-range imaging.
Qualcomm Technologies, Inc.
Qualcomm specializes in advanced mobile and automotive imaging solutions, combining high-performance processors with computer vision and AI capabilities. The company develops Snapdragon platforms and edge processors that support multi-camera integration, perception systems, and high-resolution imaging. Qualcomm emphasizes automotive vision, smartphone photography, and embedded device imaging. Its innovations in AI-assisted processing, sensor fusion, and hardware acceleration allow for real-time analysis, enhanced image quality, and advanced perception applications in both consumer and industrial markets.
-
2025 – Qualcomm highlighted AI-driven computer vision and imaging research at CVPR 2024, showcasing advancements for future smartphones and automotive sensors.
-
2024 – Qualcomm and Bosch showcased a central vehicle computer system supporting multiple imaging sensors, demonstrating AI-powered automotive perception at CES 2024.
-
2023 – Qualcomm launched QCM5430 / QCS5430 processors supporting up to five vision sensor inputs for high-performance imaging and computer vision applications.
OMNIVISION Technologies, Inc.
OmniVision Technologies designs CMOS image sensors for mobile, automotive, and industrial applications, emphasizing high dynamic range, cinematic capture, and AI-enhanced imaging. The company collaborates closely with OEMs to integrate sensors into next-generation flagship devices. OmniVision’s focus includes low-power operation, compact designs, and multi-sensor fusion for superior image quality. Their sensors are used in smartphones, smart cameras, and automotive perception systems, providing versatile, high-performance imaging across consumer and professional segments.
-
2025 – OmniVision launched the OV50X 50 MP CMOS image sensor for flagship smartphones, offering cinematic capture, enhanced dynamic range, and next-generation mobile imaging capabilities.
Sony Corporation
Sony Semiconductor Solutions develops high-performance CMOS image sensors for industrial, automotive, and consumer imaging. Its IMX sensor line incorporates stacked global shutter technology, high frame rates, and advanced AI compatibility. Sony focuses on industrial imaging, automotive cameras, and professional photography, emphasizing precision, reliability, and superior low-light performance. The company leverages sensor innovation to enable high-speed capture, real-time analysis, and integration with AI-assisted image processing for enhanced quality and functionality across devices.
-
2024 – Sony introduced the IMX925 industrial CMOS sensor (24.55 MP) with global shutter and high-frame-rate capability for next-generation industrial imaging applications.
Siemens Healthineers
Siemens Healthineers develops medical imaging systems combining advanced sensor technology with AI-driven automation. Their focus includes digital radiography, workflow efficiency, and precision imaging. Siemens integrates AI-assisted positioning, image optimization, and analytics into clinical radiography to reduce errors and enhance diagnostic quality. Solutions target hospitals, diagnostic centers, and healthcare providers, combining hardware and software innovation for high-quality, AI-enhanced imaging in patient care and clinical workflow optimization.
-
2025 – Siemens Healthineers launched the Definium Pace Select ET X-ray system, featuring AI-enabled automation for positioning, image quality optimization, and improved clinical workflow efficiency.
GE HealthCare
GE HealthCare focuses on AI-enabled digital radiography and imaging solutions for hospitals and clinical environments. Their systems integrate sensor technology, workflow automation, and AI-driven image optimization to improve efficiency and diagnostic quality. GE emphasizes scalable clinical solutions, real-time analytics, and advanced imaging features for patient care. The company supports hospitals with systems that reduce manual effort, enhance throughput, and leverage AI for precision imaging, workflow automation, and operational reliability.
-
2025 – GE HealthCare rolled out the Definium Pace Select ET digital X-ray system, integrating AI for automation, workflow efficiency, and clinical imaging quality improvement.
Key Players
Some of the Next Imaging Technology Market Companies
-
Qualcomm Technologies
-
Sony Corporation
-
GE HealthCare
-
Toshiba Corporation
-
Karl Storz
-
Olympus Corporation
-
Barco NV
-
FLIR Systems (Teledyne FLIR)
-
Imaging Technology Solutions
-
GalaxyCore Inc.
-
SK Hynix Inc.
-
Canon Inc.
-
Samsung Electronics Co., Ltd.
-
OmniVision Technologies, Inc.
-
Leica Microsystems (Danaher Corporation)
-
Siemens Healthineers
-
Intel Corporation
-
Teledyne Technologies Incorporated
-
Nikon Corporation
-
Hamamatsu Photonics K.K.
| Report Attributes | Details |
| Market Size in 2025 | USD 7.03 Billion |
| Market Size by 2033 | USD 13.65 Billion |
| CAGR | CAGR of 8.65% From 2026 to 2033 |
| Base Year | 2025 |
| Forecast Period | 2026-2033 |
| Historical Data | 2022-2024 |
| Report Scope & Coverage | Market Size, Segments Analysis, Competitive Landscape, Regional Analysis, DROC & SWOT Analysis, Forecast Outlook |
| Key Segments | • By Type(Induction Tomography, Electromagnetic Imaging and CMOS Imaging) • By Technique (Optical, Radiography and Thermal Scanning) • By Application (Automotive, Healthcare, Security & Surveillance and Civil Engineering) • By End-User Industry(Aerospace & Defense, Consumer Electronics, Industrial Manufacturing, Agriculture and Research & Development) |
| Regional Analysis/Coverage | North America (US, Canada), Europe (Germany, UK, France, Italy, Spain, Russia, Poland, Rest of Europe), Asia Pacific (China, India, Japan, South Korea, Australia, ASEAN Countries, Rest of Asia Pacific), Middle East & Africa (UAE, Saudi Arabia, Qatar, South Africa, Rest of Middle East & Africa), Latin America (Brazil, Argentina, Mexico, Colombia, Rest of Latin America). |
| Company Profiles | The Next Imaging Technology Market Companies are Qualcomm Technologies, Sony Corporation, GE HealthCare, Toshiba Corporation, Karl Storz, Olympus Corporation, Barco NV, FLIR Systems (Teledyne FLIR), Imaging Technology Solutions, GalaxyCore Inc., SK Hynix Inc., Canon Inc., Samsung Electronics Co., Ltd., OmniVision Technologies, Inc., Leica Microsystems (Danaher Corporation), Siemens Healthineers, Intel Corporation, Teledyne Technologies Incorporated, Nikon Corporation, Hamamatsu Photonics K.K. and Others. |
Get in Touch
